American Express suggests continuation of downtrendThanks for viewing,
I'll give my technical and fundamental view briefly;
Technical;
- After the sharp drop from February highs AMEX has under-performed the market - dipping ~51%,
- This compares to an over 80% drop in 2009,
- The dip was followed by the formation of a rising wedge, which normally indicates continuation of the trend preceding the pattern (which is down),
- Elliot Wave seems to also suggest continuation - with wave (5) down possible,
- The 55 EMA showing resistance,
- I see potential support below at $60, $57, and the $50 - but if the stock equals its 2008-9 drop in % terms we are looking at sub-$25.
Fundamental;
- Credit Card (and charge card) Companies have a licence to print money, all payments made on credit expand the monetary supply (inflationary) - until debt is extinguished (deflationary). Over the past 10 years, they have been able to borrow at negative real rates and pocket the spread. But when the economy turns down, these Companies are hit hard by defaults,
- Even in good times, retailers balk at being charged 6% per charge card transaction,
- What are air miles gained on transactions worth these days when no-one is flying?,
- From the last recession, I read one consumer credit exec talking about the increase in defaults in terms of MULTIPLES of the rise in unemployment www.forbes.com). They didn't say what multiple, but If the multiple is just 1, then the default rate (which would impact shadow banking, consumer credit, and unsecured lenders first and worst) could jump to 20-25% of all outstanding debt balances (pre-crisis unemployment below 4% and estimated to exceed 30% by Goldman Sachs). Even a 1.5 multiple would yield 35% default rates. Who knows how things will shake out,
- It will all depend on the underwriting standards over the past few years, if newly signed-up customers are among the most credit-worthy, then things won't be so bad (data suggests that default rates even among CC customers with FICO scores above 740 have tripled recently www.forbes.com). If, when times were good cards were sent to anyone with a pulse then things won't be as great,
- The Fed is buying distressed ABS and MBS securities, apparently without regard for the creditworthiness of the underlying security, it is feasible that all this credit card debt packaged up and sold as an asset backed security has/will be been sold to the Fed at 100 cents on the dollar as it started to show signs of rising defaults in the underlying assets. This is a positive factors for the Company - I have doubts if it is positive for the economy down the line,
- CC Companies are offering repayment holidays - possibly in part to defer incurring defaults - this will of course impact on profitability.
- It all depends how you see this crisis - as being better or worse than 2008-9. My view is that this is many times worse, but that is just me. There are many reasons to expect higher defaults as compared to 2008-9 in an economy that has stopped on a dime,
- Today's dividend yield of 1.79% seems insufficient to compensate investors for the higher risk associated with holding equities - considering the stock is down over 30% from Feb highs. This is my view in general as well, a lot of stocks are "growth" stocks, which do not pay (in my view) a high enough risk-adjusted dividend to be worth owning. This is all gravy when the stock is rising, but when the dividend is below inflation AND the stock is losing value, there is less incentive for an investor to hold firm. If you combine this with a tendency of this stock to significantly underperform the market in recessions then you understand the basis for my bearish view.
So, overall, this stock rides high when times are good and has a history of being impacted more than the average. I don't see why that wouldn't still apply.
Cheers, and protect those funds
4AXP trade ideas


An 18 month slow, simple position with large cap US DowThe selloff appeared to have reached a recent low defined by liquidation, high anxiety,
hitting potential short to medium term lows by 2:30 PM on March 23, 2020.
For the longer term position trader who would be no different than a long term investor in large cap companies, The prices for the week ended March 25, 2020, may have been an opportune window of entry given the levels of volatility and broad liquidation across most asset classes.
positions were taken by the close of March 24 and March 25, 2020, Q1 2020
A small selection of Dow Dividend giants was chosen for this experiment in counter trend positions,
which will be concluded in 18 months, or about September 2021, the end of Q3 2021
The lineup includes:
Home Depot
Intel
Microsoft
American Express
Visa
Goldman Sachs
Apple
Disney
3M

American Express Earnings TradeAmerican Express is in a wedge right now with earnings tomorrow. Depending on the outcome, it could move up or down 10 dollars. It is most likely down as they will get less income as not as many people will be spending money during quarantine and they will not collect on fees. Options are very cheap either way. Who knows though?
Good Luck!
If you find my ideas helpful, please comment and give me a like and a follow. Thanks!

Keeping my eyes on thisThis has the potential for a very nice return. I'm watching for the MACD to punch through 0 and the price to punch through the 50EMA. I will have an idea whether i'm in by Friday, Right now, its nothing but a Sunday fantasy ;)

American Express
UPCOMING EARNINGS!!
With earings on Apr 24, I think they will miss, due to the stay at home ordes b/c of the coronavirus.
-I'm sure a large number of customers are choosing to defer their payments, ultimately affecting AXP revenue.
- Am. Express has been on a nose dive since January
- it found resistance at the 38. 2 level and im riding it down back to 68-70 (or the 0.0) fib level where it may find support..
- Price also respected the 6.81 fib level on the daily time frame
Feel free to like, comment, follow.

Roller COASTER, Fisrt BULL and BEAR taking over on EARNINGSSimply based on the trend cycle, uptrend will continue for the next couple of days before earnings. We could see how much damage the pandemic will do to AXP Earnings. Good luck :)

short to buy level at weekly timeframe by put option to $53short to buy level at weekly timeframe by put option to $53

AXP turning around ..... 82c 4/24AXP has been getting hammered. For reason however. Less travel, consumption and socializing has led to decreased credit card use. However, this bull rally left AXP behind. The bull rally is slated to end next week. AXP will tag along for this ride.
RSI is going back up.
MACD will cross over
Let me know down in the comments what you think and if you have any other stocks you would like to see.

BULLISH AXP, V, MAIn the last 4 days, these tickers are showing significant drops. Downtrend becomes exhausted and based on history it'll pop up for the three days. The trend is your friend! if you're playing options, I will be selling by next Tuesday. Good luck :)


April - $98 soon?As long as it stays above that below trend line, there is a high change it can reach 98 this month.

CYCTB? American Express CO. Hello friends,
I feel in this time, it is important to document.
With that being said, I have always felt in the past I was always calling the bottom.
With this chain of posting I will post my thoughts on what I think the bottom will be.
Most companies are over sold and over leveraged.
Hope this finds you well.
Happy trading.
Disclaimed - This is NOT financial advice - Its chart speculation.

American ExpressFebruary 20th - March 18th saw a 50% drawdown to AXP, this is a long term play, but also a short-term trade with size.

AXP Triangle.Looks to be taking shape on the hourly. Current range around 108-115. Obviously range will continue to get tighter until break out.
MACD looking weaker on hourly, but thinking we'll see it strengthen up again like prior to stay green a bit longer until 115 is reached.
RSI also trending upwards along with A/D.


Weekly Support - 3/20 120 CALL - low riskChart shows weekly trendline support from 2016 drop and 2019 drop. Solid yellow line connects closing price, while dashed yellow line connects lows. Prices are about 207.50 and 205, respectively.
You can easily set stop losses to scale out of position, otherwise this will be a nice trade if buyers step in and market bounces upward next week. Also on stochastic, %K has stretched far from %D, which indicates there might be a move up.
*** Option value may decline if IV drops and price does not move up enough. I suggest only a small amount of capital into this trade.

38.2% & POSSIBLE 61.8% Retracement SHORT GWAVE38.2% & POSSIBLE 61.8% Retracement SHORT GWAVE.
FIB Retracement Percentage is calculated in a Higher Cartesian and or Euclidean Dimension.
PLEASE ALWAYS WAIT FOR STOCHASTIC CONFIRMATION!!! THANKS.

American Express Breakout
Super earnings has produced a nice rally in the stock.
Currently hitting resistance so possibly wise to wait until it is passed.
Plenty of upside for this stock as society continues to go cashless.

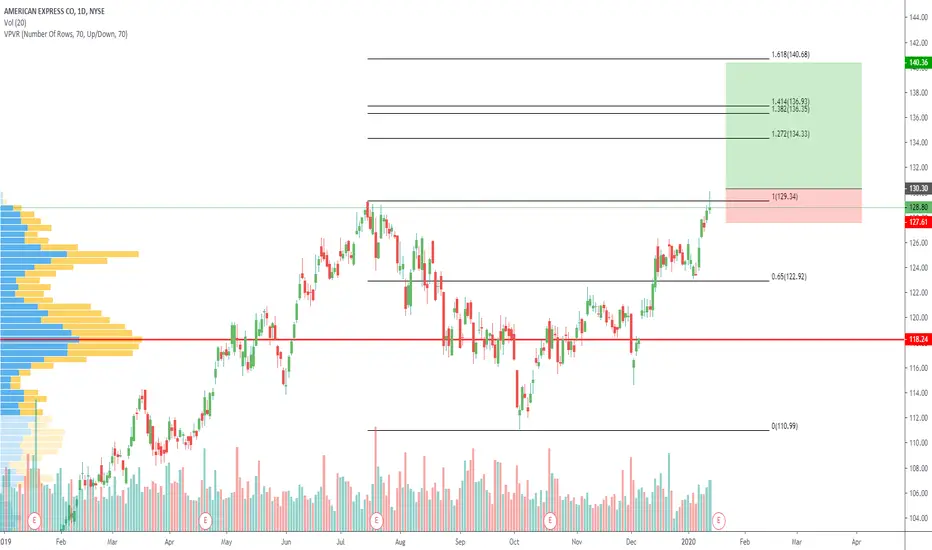
Breakout for American expressPossible entry level @ $130.25 above previous high.
Target price @ $140.00 to just below Fibonacci expansion target.

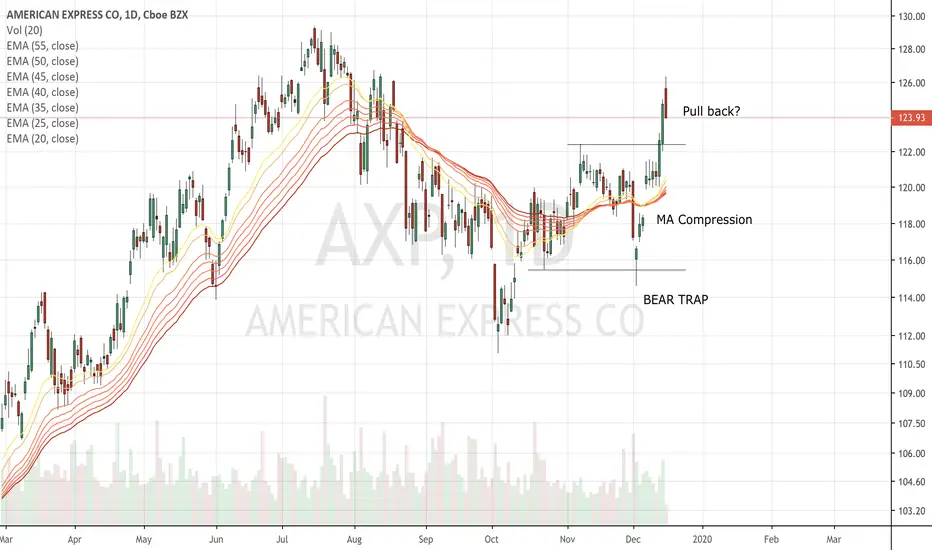
AXP - Bullish?AXP shows several features that may indicate that it can move higher in the next weeks: MA compression, a range breakout and possibly a pullback to previous resistance.