BAC: Quantitative Analysis and Targets Should you invest in BAC, or even more generally, banks right now?
No.
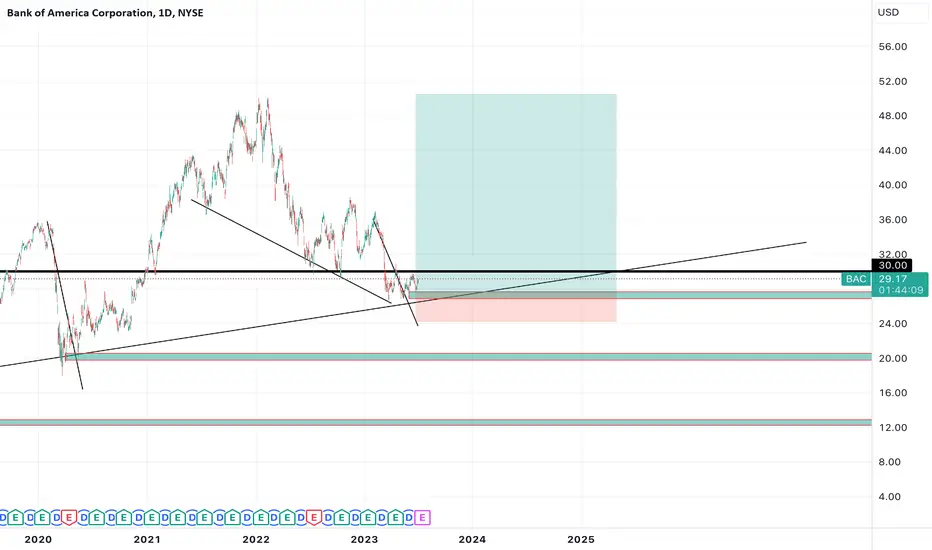
BAC is likely going to come down. If we look at its scatter plot chart below we can see more clearly the likely trajectory here:
Touching that linear line is almost a guaranteed IMO, which is a price point in the mid 30s.
I also expect it to come to or at least close to that quadratic line which is between $20 and $26.
If you look at the monthly chart (Above), I have plotted out some key technical support/resistance areas as well.
Bank stocks are not inflation resistant but tend to be more hardy against recessions. However, if this is what you are looking for, I would probably shift my interest to Canadian banks. They tend to perform better and are more secure. However, I wouldn't advise investing in anything Canadian right now, because the Canadian stock market is still currently trading at ATHs. RY is in ATH territory and its really interesting to see the huge disconnect between the NYSE/US market in general and the Canadian market. Canada is like, in a different world apparently, with no concerns of inflation, recession or anything, lol. Check out XIC (The SPY version of the TSX):
My thoughts, no financial advice!
Feel free to comment/question/critique.
Thanks for reading!
4BAC trade ideas


Falling wedge, 3 rising valleys at key supportThis looks like a buy to me. I am seeking a minimum 30% move here.
MACD looks nice too.

BAC Bank of America Corporation Options Ahead of EarningsIf you haven`t bought BAC here:
Then analyzing the options chain of BAC Bank of America Corporation prior to the earnings report this week,
I would consider purchasing the 30usd strike price Calls with
an expiration date of 2023-9-15,
for a premium of approximately $0.83.
If these options prove to be profitable prior to the earnings release, I would sell at least half of them.
Looking forward to read your opinion about it.


40 - +60% ROI from BAC Bullish divergence on the annual time frame indicating a continuation of the annual trend towards $40+.
Oversold stochastic and RSI showing signs that bears are loosing control giving a great buying opportunity to secure your 3.02 dividend payments.

BAS EARNINGS IDEAok so the way i marked this up was according to what ghost showed us over the weekend. im not sure how i did so any feedback is great

BAC pre earningsBank America headed into earnings..
Im looking for a 30.50 gap close this week... this move could have after earnings .. Despite Fridays profit taking banks are still setup for a move higher.
Strong support at 28.30 or 50sma..

BACIf you don't think the world is going to fall apart & banks are going to collapse, this probably isn't a bad spot for a BAC long for the next few quarters imo.

Shorting Bank of America. BACMultiple Harmonics within a channel identified. We have changed the tune somewhat to harmonic theory of market action, but this is not a move away from Elliott. At the end, Harmonics are another or roundabout way to describe Wave action in the markets. For instance, this picture does fit WXY type corrective pattern, if we allow the current formation post a low at 26.33 to be X Wave. It is our opinion that individual indicators should never be the sole reason to put a position down, rather only act as supporting evidence what is seen through masterful Elliott Wave counts or accurate depictions of harmonic patterns.
We are not in the business of getting every prediction right, no one ever does and that is not the aim of the game. The Fibonacci targets are highlighted in green with invalidation in red. Confirmation level, where relevant, is a pink dotted, finite line. Fibonacci goals, it is prudent to suggest, are nothing more than mere fractally evident and therefore statistically likely levels that the market will go to. Having said that, the market will always do what it wants and always has a mind of its own. Therefore, none of this is financial advice, so do your own research and rely only on your own analysis. Trading is a true one man sport. Good luck out there and stay safe.

Bank of America priced in SilverBanks close to melt down.. silver close to melt up
#Silver on brink of historical breakout.
#Banks on brink of historical breakdown.
Notes:
silver quarterly defined take off platform
2003 Bank of America tops vs silver
2003 silver breaks out
topping structure (lower highs)

Bank of America priced in goldBank of America in survival mode (priced in gold).
If it fails, expect #gold and #silver to go bonkers!
2000s
BULL ERA FOR GOLD AND SILVER
1970-1980
BULL ERA FOR GOLD AND SILVER
momentum breakdowns
8 year moving average

BAC - Short term sellExpecting upward thrust this week to fade with price falling back to recent low of 27.75 by next Friday. Selling July 15 29 -31 call bear spreads at $0.75. But do have a long term stock position in my core accounts.

Bank of America, showing strength and growth...BANK OF AMERICA (BAC) is showing signs of net buying / accumulation at the current levels -- conveying anticipation of the April 18 earnings results. The last December 2022 results beat expectations -- and it looks like the confidence will be the same for this season.
SEEDED L at 27.5
TAYOR.
-------------------------------------
Here are some fundamental data last quarter 2022:
DECEMBER 2022 (DATA)
EPS (USD)
Expected
0.77
Reported
0.85
Surprise
10.71%
Revenue (USD)
Expected
24.22B
Reported
24.53B
Surprise
1.28%

BAC longHigher low
Demand
30 a share
Double in price
Higher high incoming
Dollar weakness
3rd Qrt 2023
$BAC being as attractive as it could beA long term portfolio type stock, down about 50% from previous high and a technical view supports the idea we might see an upcoming bullish trend.

More Downside in Bank of America?Bank of America has struggled since the plunging in March, and now some traders may see more downside in the lender.
The first pattern on today’s chart is the June 13 high of $29.80 -- below April’s peak of $30.93. The broader S&P 500, in contrast, made a higher high this month. That lack of relative strength may suggest fewer investors are accumulating BAC.
Second is the rising trend line along the lows of May and June. The stock closed slightly below it yesterday and remains there today, resulting in a potentially bearish flag breaking to the downside.
Third, MACD has turned lower.
Fourth, BAC is back under its 50-day simple moving average (SMA). Is the intermediate-term downtrend resuming?
TradeStation has, for decades, advanced the trading industry, providing access to stocks, options, futures and cryptocurrencies. See our Overview for more.
Important Information
TradeStation Securities, Inc., TradeStation Crypto, Inc., and TradeStation Technologies, Inc. are each wholly owned subsidiaries of TradeStation Group, Inc., all operating, and providing products and services, under the TradeStation brand and trademark. TradeStation Crypto, Inc. offers to self-directed investors and traders cryptocurrency brokerage services. It is neither licensed with the SEC or the CFTC nor is it a Member of NFA. When applying for, or purchasing, accounts, subscriptions, products, and services, it is important that you know which company you will be dealing with. Please click here for further important information explaining what this means.
This content is for informational and educational purposes only. This is not a recommendation regarding any investment or investment strategy. Any opinions expressed herein are those of the author and do not represent the views or opinions of TradeStation or any of its affiliates.
Investing involves risks. Past performance, whether actual or indicated by historical tests of strategies, is no guarantee of future performance or success. There is a possibility that you may sustain a loss equal to or greater than your entire investment regardless of which asset class you trade (equities, options, futures, or digital assets); therefore, you should not invest or risk money that you cannot afford to lose. Before trading any asset class, first read the relevant risk disclosure statements on the Important Documents page, found here: www.tradestation.com .

#BAC straddle! Notional Value- 1,5M$Based on our team's research of the options market, we expect buy activity at the support level.
We do research and find new opportunities every day.
Stay with us!

Bank of America Collapse?Current #Gold, #Silver and #Oil price action might be trying to tell us something is about to happen...
This #BankofAmerica chart is PRIMED for a major fall down.
Hold your breath!
note that 12 year rising trend line confirmed breakdown

Short Term Trade IdeaBased on my analysis, there is a potential for the ongoing rally to initiate an upward impulse cycle. The chart suggests that the upward movement can be identified as an ABC pattern, rather than a 12-12 setup as previously counted. If this interpretation is accurate, it indicates a possibility of significant downward movement ahead. However, I hold a different perspective regarding the ABC count due to the prolonged duration of this correction. The extended timeframe suggests that it is unlikely to be a typical ABC wave 2. Instead, it appears more probable that there is further upside potential to be explored.

BAC to 31.25Chart pattern is in an accumulation period (according to wyckoff method).
That means that we can see a long explosion after the accumulation period. Entrance at 29.48 or above
The target profit should be at 31.25, but we can stay more time using trend-following indicators.

Buying zone of bank of america Hi every body , Me personally absolutely bullish on this share around 23 dollar for first entry and second entry for dollar cost averaging ..... consider i will keep you posterd on that time because sharp sell off and time factor are very monumental for my strategy ...
anyway look at major trendlines around there and beautiful fibo level ....
argue with me about this on comment section ......
Good bless you all.

I am short BAC 30.38Daily stoch ready turn
look vol lots selling to buying
had earnings and its red today selling off
heading into huge resistance
31.35 50 day
My stop is 31.81
