BERKSHIRE HATHAWAY INC NYSE BRK.Auptrend closeup 296300.00 buy
1 target 315100.00
2 target 323400.00
3 target 334600.00
4 target 346000.00
4BRK trade ideas

BRK.B - can we cross support?Need a few more positive signs to see if this will go above the support line

BRK. B will be testing resistance this week. Looking for BRB.B to break out above the $200 level this week!


BERKSHIRE HATHAWAY INC BULLISHCame out of consolidation and ready to move upward
The target of $290000
Stop Loss $285000
#investocon

BRK.A in THe next days !Technical indicateurs indicat has bigs investiseur entred this market as buyers with a lot of monye , I advais you to keep it in the portfolio and You can BUy More after crossing the red line

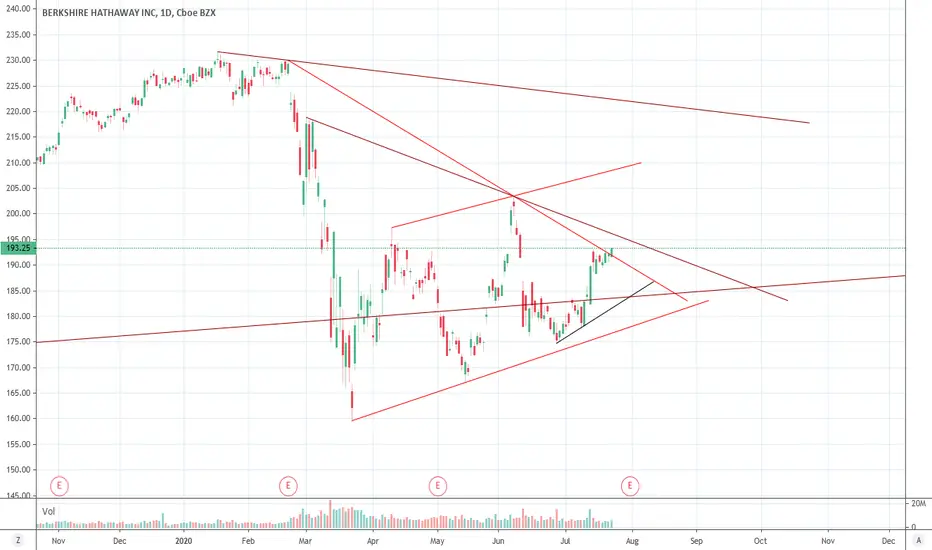
Upside in Berkshire HathawayStock is trading in an ascending channel. We can potentially see Berkshire hitting the 200 range soon but before that, there is a small resistance it must overcome at $187.


BERKSHIRE HATHAWAY has high probabilily of going down to 180.3First of all, please support our work by smashing that like button or following! These really help us to reach more traders like you
BERKSHIRE HATHAWAY has high probabilily of going down to 180.3

DAILY ANALYSIS BERKSHIRE HATHAWAY Hi friends
the daily chart of this market shows with a very strong probability that it will know a downward trend until the level of with the vigilance that this market changes the direction towards the opposite direction
please subscribe to receive new analyzes

BRK.B | Long @ DemandLong @ Demand zone
Entry: 179
SL: 173.65
TP1: 198.84
TP2: 224.03
________________________________________________________________________________________
Note: Consistent success in financial markets requires a personalized trading strategy
*A method that specifies the type and amount of patience
*Entry and exit points
*Your customized psychology plan
*Risk management program based on your personality
________________________________________________________________________________________
Press Like if you like it
You are welcome to share comment
Hope this is helpful, Thank you for your support, have a great day

Inverse Head and Shoulder?I am very new to stock and patterns and would like some insight. I only know a few patterns right now and it is likely I am wrong but will this turn into an inverse head and shoulders? Maybe see a decent increase for a little for an opportunity to buy calls? Any advice or opinions is valued and I will take all criticism into my studying. Thanks!


Berkshire B It is a BullEmotion is generally disappointment on this one.
But really it is all a matter of perspective.
Morgan Stanly said on 5th may it was on equal weight. No change ever since.
I am nog good at investigating the financials. But the regular ratings say it is on par right now.
Only emotion can push it down. Maybe a drop of 2 percent. But it has to go up eventually.
If this breaks, sentiment among value investors may break
I am going Long.

Berkshire B - Next stop at?I am willing to invest in this value share but really... I have no clue as to where it is going. Is it a buy or is it going down?
The chart says a good short will give you a huge profit. But... this is Warren Buffet. Is it his moment of truth?
I am going in with my paper trading account for a long. historically it should go up. But the current situation in US says auch.
Who can shed a light on the next election results in favor of Liberals? What would possibly be the effect on this share.
BTW I m a noob. Just started. But I want to go long on this one.

Berkshire ShortBerkshire Hathaway has long been a leader for the S&P, but it currently looks like the conglomerate is heading into a rough period of time.
The Daily 200 SMA in pink has rolled over bearish, and the key Weekly support level for the past 2-3 years has been breached to the downside.
Being one of the top 10 holdings in the S&P index, if this downtrend continues this could be a stock that acts as a downside-weight for the indexes and market as a whole.
(Plus many big financial names look like shit right now, which should act as a similar downside-weight to more financially-weighted indexes like the Dow)
Long-term Market outlook: BEARISH
(not financial advice, just an opinion)

BRK.B downiesYou know I hate to bet against Uncle Warren but here we are. Stock hasn't been doing so hot lately and it's mostly financials.


👍 Berkshire Going To Test Channel Support. (BRK.A)💰 LET'S GET INTO SOME BERKSHIRE HATHAWAY ANALYSIS!💰
1️⃣ First off SMASH that LIKE BUTTON & Give us a FOLLOW for DAILY ANALYSIS! ❤❤❤
(Overall Market Sentiment) 🐻 Bearish
- Daily Chart
- Red Engulfing Candle
- 3/3 EMA DOTS Red
It looks to me that berkshire will continue down to test the upward channel support. Look for all indicators to shift on support otherwise it could be disaster if we breached below that main level.
Best of luck to you and all of your trades this week! 🤜
Drop your charts and comments down below, share with us what you think is going on in the markets! ❤❤❤
Thanks for checking out our analysis! ✌😁✌
🥇MLT | MAJOR LEAGUE TRADER
