4C trade ideas

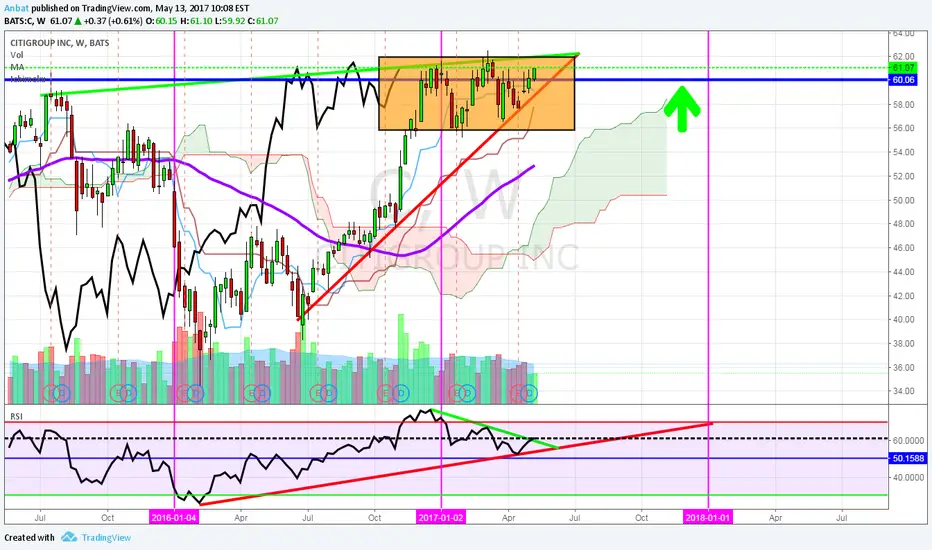
CITIGROUP- Where Is It Going?I believe that Citigroup will continue to be bullish for several years. You would need to look at higher time frames on where Citigroup was prior to 2008. For last eight years, been in a sideways and slowly raising price action. I will be either going long with stocks and/or doing call option strategies. If price action breaks $62.00, then this will confirm the upward trend. RSI is above 50 and forming a triangle pattern, which will be broken above. The dividends are not much around 0.16 cents, per share- but you get a stable company, which will be around for a long stable and without to much stability. Wish you the best.
Another Bearish Signal For Financials, CitigroupOn April 28, 2017, Citigroup stock ( C ) 20 day moving average (DMA) crossed below its 100 day moving average (DMA). Historically this has occurred 237 times and the stock does not always continue to drop. The median drop is 3.213% and maximum drop is 37.140% over the next 11 trading days.
When we take a look at other technical indicators, the relative strength index (RSI) is at 49.4113. RSI tends to determine trends, overbought and oversold levels as well as likelihood of price swings. I personally use anything above 75 as overbought and anything under 25 as oversold. The current reading declares the stock has been neutral and not likely to produce volatile price swings.
The true strength index (TSI) is currently -4.9549. The TSI determines overbought/oversold levels and/or current trend. I solely use this as an indicator of trend as overbought and oversold levels vary. The TSI is double smoothed in its calculation and is a great indicator of upward and downward movement. The current reading declares the stock has been moving down, but has begun to slightly move up.
The positive vortex indicator (VI) is at 0.8428 and the negative is at 0.9875. When the positive level is higher than 1 and higher than the negative indicator, the overall price action is moving upward. When the negative level is higher than 1 and higher than the positive indicator, the overall price action is moving downward. The current reading declares the stock has been moving down.
The stochastic oscillator K value is 66.5123 and D value is 62.8527. This is a cyclical oscillator that is highly accurate and can be used to identify overbought/oversold levels as well as pending reversals and short-term activity. I personally use anything above 80 as overbought and below 20 as oversold. When the K value is higher than the D value, the stock is trending up. When the D value is higher that the K value the stock is trending down. The current reading declares the stock did not make it to overbought territory before recently reversing downward. This indicator does not always have to break above the overbought level before reversing, but there is always the slightest chance it could move up. The latter is not likely however due to the stock's position in its multiple trend channels and lines of resistance.
Four days prior to this cross below the 100 DMA, the stock crossed above the 100 DMA. This similar cross up and cross down within 5 trading days has occurred 11 times since the financial crisis recovery began. It has occurred in May 2009, June 2009, July 2009, June 2010, July 2010, August 2010, December 2011, October 2013, June 2014, July 2014, November 2015. The stock dropped 0.595%, 15%, 8.571%, 8.354%, 2.036%, 8.845%, 13.444%, 3.559%, 1.159%, 1.938%, 1.27% on the respective occasions. The minimal drop was 0.595% while the median drop was 3.559% over the next 11 trading days on these occasions.
Considering the moving average crossover, RSI, TSI, VI and stochastic levels, the overall direction appears to be pointing down in the near term. Based on historical movement compared to current levels and the current position, the stock could drop another 1.39% if not more over the next 11 trading days.

C - Citigroup respects the Medianlines.Price gapped up to the seller zone to the tick.
Even price made a hagopian, means that price did not reached the centerline, I bet on the short side since C. is respecting the Medianlines so good.
P!

Citigroup potential upmove after consolidationTrendline continuation $C
Set near stoploss and reverse position if trendline is clearly broken.
Happy trading and good luck!

Slightly Mixed Signals For CITI (C)On March 28, 2017 Citigroup (C) crossed above its 50 day moving average (MA). Historically this has occurred 349 times. When this happens, the stock does not always continue to rise. It has a median gain of 4.839% and maximum gain of 62.909% over the next 18 trading days.
When we take a look at other technical indicators, the relative strength index (RSI) is at 49.2324. RSI tends to determine overbought and oversold levels. I personally use anything above 75 as overbought and anything under 25 as oversold. The current reading declares the stock is looking for direction but favoring the highside at the moment.
The true strength index (TSI) is currently 3.5677. The TSI determines overbought/oversold levels and/or current trend. I solely use this as an indicator of trend as overbought and oversold levels vary. The TSI is double smoothed in its calculation and is a great indicator of upward and downward movement. The current reading declares the stock is looking for direction. Even though it is still a positive number, it is trending downward.
The negative vortex indicator (VI) is currently 1.1597. The VI determines current trend and direction. When the positive level is higher than 1 and higher than the negative indicator, the overall price action is moving upward. When the negative level is higher than 1 and higher than the positive indicator, the overall price action is moving downward. The current reading declares the stock is trending downward, but the positive VI is also beginning to trend up.
Considering the moving average crossover, RSI, TSI, and VI levels, the overall near-term stock direction appears to be slightly trending upward. Based on historical movement compared to current levels and the current upward trend channel, the stock could gain at least another 5% over the next three weeks. In its current trend channel, Citi has been at this position (not price) twice since December 2016. The stock rose 6.46% over 18 trading days to the top of the channel and also rose 5.92% over 15 days to the top of the channel. Similar movement is possible which would result in a gain of around 5.79%.
Citigroup is scheduled to have an earnings call within the next 15 trading days which could be the catalyst for this move up. The current consensus Earning Per Share estimate from Earnings Whispers is $1.28, which would be the highest Earning Per Share since October 2015.

Citigroup (C) A Great Candidate For A Downside SpreadAlthough the banking sector has largely had a rally since the Presidential election, regulatory headwinds and near-term fundamental outlook and projections have seemed bleak for Citigroup’s growth potential. Long-term, the stock is a great purchase at a somewhat discounted price to its recent trading, but for our swing strategy, the latest break to the downside into a possible downtrend or consolidation is an opportunity for us.
If you’re looking for a 1:1 risk/reward trade with a skewed probability curve starting at roughly 62% chance of success to earn 100% ROI, then Citigroup is a gem in this turbulent market. Actually, we found this trade while scanning due to possibly having to close for a loss on our recent Alphabet (GOOG) trade due to management’s screw-up on an epic scale regarding extremist videos and advertisements on Youtube .
Anyways, here’s the trade we see:
Current stock price $58.46
Buy X Puts; 13 Apr 17 Exp; 58.50 Strike
Sell X Puts; 13 Apr 17 Exp; 58 Strike
Max Return on Risk/ROI: ~100%
Fun times.


US Stock, Citigroup, H1 LongPossible move price in long direction as continuation last big move on D1 chart and after removed last 2 peak on H1 chart.


C- double top to double bottom?Higher lows, fed out of way. Watch for bounce off this area. If fails, short

C retest gapCitigroup just gaped above previous resistance. It retested that area for a good buying opportunity. placing stop at 45.00 trend is bullish. not to mention trump made claims about an increase in credit lines for small business growth. I am bullish on the financial sector. I see an increase in lending power under a trump presidency.

C- double topCitigroup shares showing a potential double top here with a break below 58.75. If it does not hold, may consider reshorting on pop bask up toward 59. Will see how it reacts.


citigroup...watching ....buybuy after breakout....its a important price level for chart and after breaking it will be a nice support


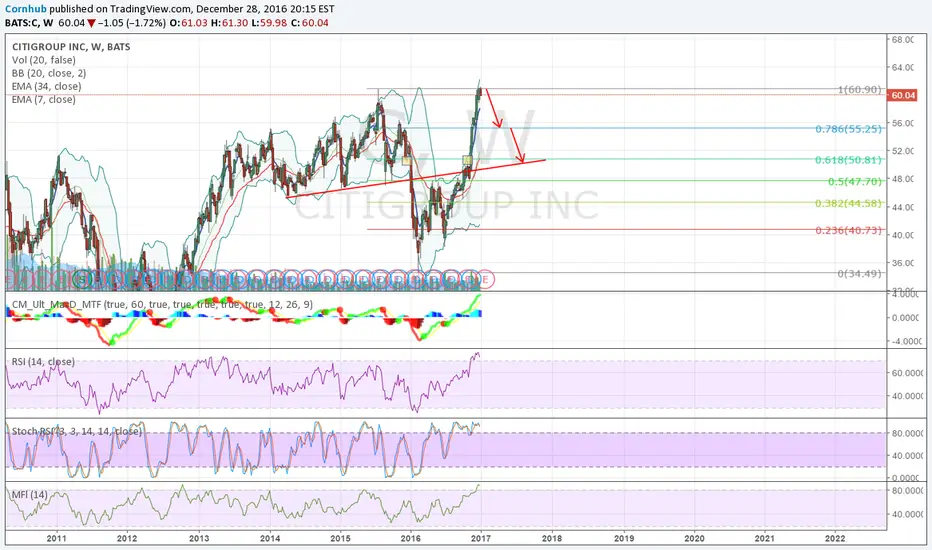
Citi---Ready to Drop (Mid-term, Weekly)Shouldn't be a hard trade for this one, I have 75% confidence on this short.
For mid-term traders, Citigroup looks like a great short opportunity. It follows the Fib Extension very well by now.
Various reasons for saying Short:
1. Weekly Chart shows the first Red candle after multiple weeks rally straight yolo swag up.
2. MACD topped, RSI oversold, Stoch RSI oversold, even my MFI breached the top(yeah baby)
3. I'm not good at Harmonics patterns, but this looks like a great Bearish pat or butterfly or whatever the animal is.
Targets shows on the chart
TP 1: 55.25...0.786 on fib
TP 2: 50.46...slightly lower than 0.618 fib, reason why is previous support line (red) is there and pervious small support and resistance(2 tiny yellow boxes) all mixed at that price.
I'll starts accumulating at tomorrow intraday high.
Trade at your own risk.
Here's your tater tots~~
Citigroup showing signs of multi-month improvementMulti-month recovery from USD34.52 February lows gaining traction as prices accelerate higher to pressure critical resistance at the USD60.95 range high of July 2015.
In much the same vein as AIG, Citigroup is slowly recovering ground lost during the 2007-2008 mortgage crisis. investor sentiment and momentum studies are slowly improving, suggesting further gains in the coming months.
Next significant resistance is at the USD75.85 year high of January 2009.
Citigroup is also showing signs of Outperformance relative to the strengthening US Financials Index.

