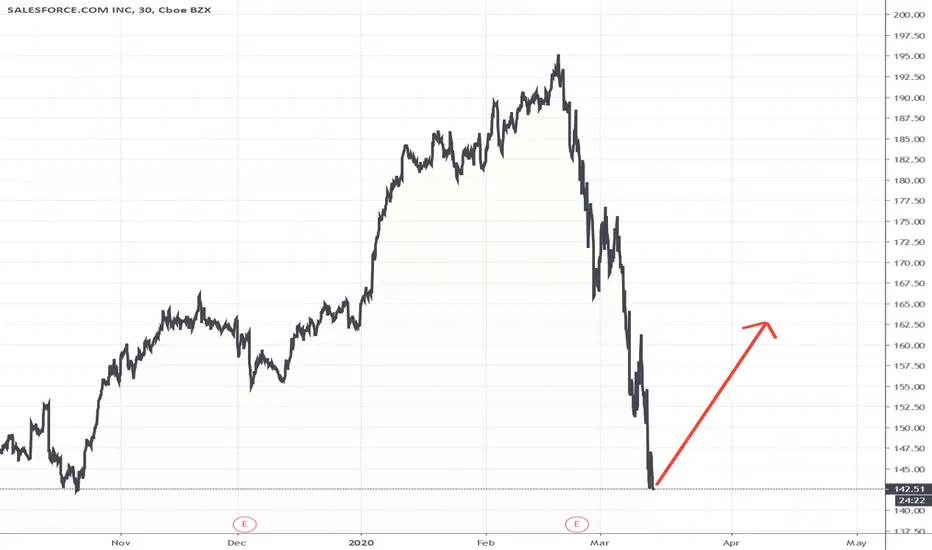
CRM has a big potential to go upSALESFORCE.COM INC is going to have a bullish trend in the next weeks.
4CRM trade ideas


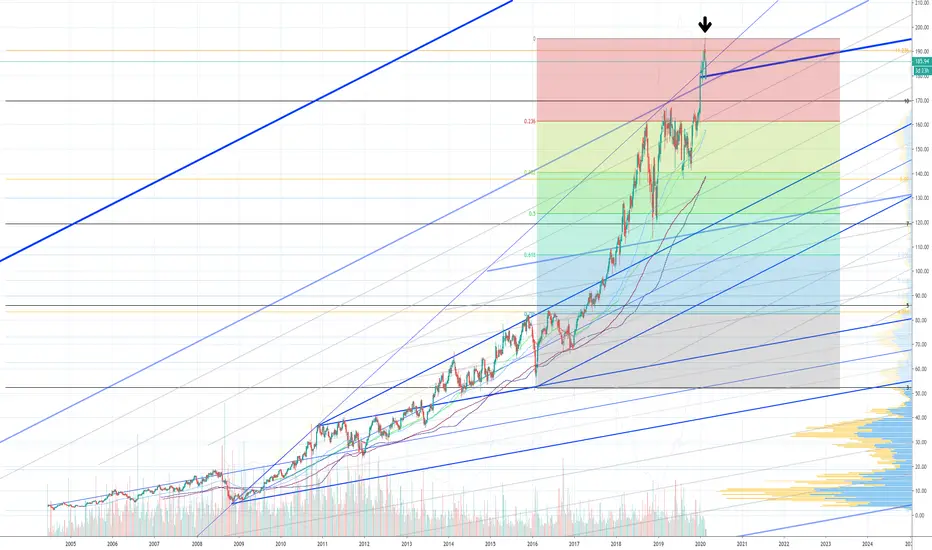
Daily trend nearing 61.8% retracement levelAs with numerous tech stocks, $crm is presently in bounce mode...at least until the 61.8% fib retracement zone is reached.


NYSE: CRM shows Daily Breakout backed by Weekly MomentumNYSE: CRM has broken out in Daily Time Frame backed by strong bullish Weekly momentum.
Entry can be at last daily close or a tick above.


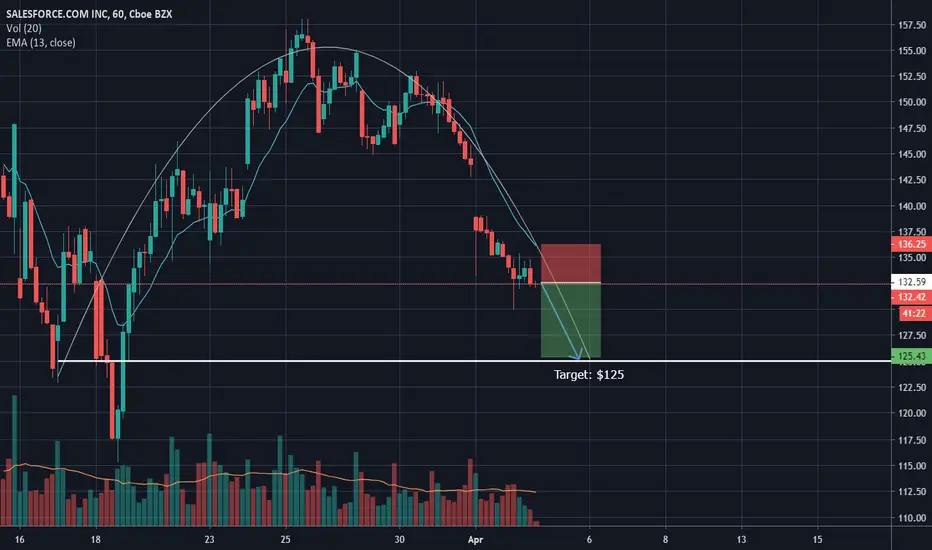
CRM Round DownCRM is about to finish its last leg of its rounding formation. Resistance is at the 125 level on the short side, which is my target. This can complete by tomorrow.

CRM Round UpCRM is rounding up towards the top of its cup at the 160 level, which also happens to be where the 30ema moving average lies on the daily chart acting as resistance. I believe it can get there within the next day, before it reverses.

Divergence on Salesforce. TP $178. SL $158Price is showing divergence from RSI 5. Long Salesforce until next resistance $178. SL at $158 if price break support $160

Back test the previous break out support , then next?LET's be patient, in order to see the most beautiful nurse, you need to be patient

Worth HoldingDue to market sentiment and quitting of co-CEO, CRM fell to EMA 200 ($163), which was previously a resistance zone before the speculation of Google acquiring it published by RBC, and immediately rebounded from that level to $170.
It might be worth accumulating when market opens as CRM remains a long term winner given the amount of companies it has, constructing an economic moat for the company. High switching cost of the company would also promise stable revenue growth for it although its revenue growth is not as organic and great as before given the law of large numbers.

CRM RetestCRM has now retested and bounced off of old support at $165. It extremely oversold as with the rest of the market, so once the market bounces this will bounce harder. I expect a bounce a run-up to its 50 day moving average at $178.

Salesforce .com Bullish reversal $crm
Strong RSI uptrend intact
Strong reversal of support in Mondays selloff
Strong Moving average support
Fibonacci expansion target $197
Fibonacci extension target $206
Difficult stock to trade into earnings as good results often results in selling.