NYSE: F (FORD) - HARMONIC GARTLEY - LIMIT BUY - ATR SLHarmonic gartley completed a few days ago and was identified today. The systems criteria is still being respected so an entry was taken at the price that would originally have hit the buy limit a few days ago using the same SL that the original harmonic setup rules call for. Lets see if it plays out
4F trade ideas

Ford to try for $14.50 breakout End of AprilI've been watching Ford since July of 21 where I made the call that it would climb to $20 by January of '22.
Looking at this chart again, and just being bullish on Ford anyway, it's set to run back up to $14.50 by the beginning of May, and may even try to spike higher.
With their advancements in EV and continually staying on top of the market, I believe that we'll see this stock climb once again.
I placed an order for a Buy to open 1 F 5/5/2023 13.00 C @ Market, Day

Will Ford selloff stall at swing lows?Ford - 30d expiry - We look to Buy at 11.21 (stop at 10.55)
Levels below 11 continue to attract buyers.
11 continues to hold back the bears.
We look to buy dips.
With signals for sentiment at oversold extremes, the dip could not be extended.
Early pessimism is likely to lead to losses although extended attempts lower are expected to fail.
Our profit targets will be 12.77 and 13.07
Resistance: 11.95 / 12.50 / 13.15
Support: 11.35 / 11.00 / 10.61
Please be advised that the information presented on TradingView is provided to Vantage (‘Vantage Global Limited’, ‘we’) by a third-party provider (‘Signal Centre’). Please be reminded that you are solely responsible for the trading decisions on your account. There is a very high degree of risk involved in trading. Any information and/or content is intended entirely for research, educational and informational purposes only and does not constitute investment or consultation advice or investment strategy. The information is not tailored to the investment needs of any specific person and therefore does not involve a consideration of any of the investment objectives, financial situation or needs of any viewer that may receive it. Kindly also note that past performance is not a reliable indicator of future results. Actual results may differ materially from those anticipated in forward-looking or past performance statements. We assume no liability as to the accuracy or completeness of any of the information and/or content provided herein and the Company cannot be held responsible for any omission, mistake nor for any loss or damage including without limitation to any loss of profit which may arise from reliance on any information supplied by Signal Centre.

Ford - Ford Vs Tesla?As we look for opportunities in the markets, sometimes we come across tried and true companies that have stood the test of time. With all the talk about Tesla, what about Ford? If Ford hold the floor again, then it will be 25% away from recent highs.

F - Ford formed the Descending TriangleOn weekly chart Ford is completing to form one of the bilateral pattern - the Descending Triangle.
I am keep watching on further trend to make a decision on entering the position. Will it broke upper line or bottom line then short or long position will open accordingly.
The upper target is around 20
The lower target is 5

Potentially bearish pattern in Ford MotorFord Motor has been conspicuously weak since the summer – despite months of the broader market attempting to rally. Now with anxiety spreading toward the economy and financial system, the automaker could be showing signs of continuing lower.
The main pattern on today’s chart is the series of lower highs since August. Each time, the stock has proceeded to hold roughly $11. The result is a descending triangle – a potentially bearish continuation pattern.
That $11 price area could be relevant because it was the level F held in April 2021, shortly before its big electric-vehicle push began.
Next, this chart includes our 2 MA Ratio custom script with the default settings of the 8- and 21-day exponential moving averages (EMAs). Notice how the relationship has remained in negative territory for most of the past month.
Finally, $11.75 could be viewed as a near-term threshold. That was the monthly low in February that F has been unable to reclaim. If prices remain below it, traders may look for a break of the longer-term support.
TradeStation has, for decades, advanced the trading industry, providing access to stocks, options, futures and cryptocurrencies. See our Overview for more.
Important Information
TradeStation Securities, Inc., TradeStation Crypto, Inc., and TradeStation Technologies, Inc. are each wholly owned subsidiaries of TradeStation Group, Inc., all operating, and providing products and services, under the TradeStation brand and trademark. TradeStation Crypto, Inc. offers to self-directed investors and traders cryptocurrency brokerage services. It is neither licensed with the SEC or the CFTC nor is it a Member of NFA. When applying for, or purchasing, accounts, subscriptions, products, and services, it is important that you know which company you will be dealing with. Please click here for further important information explaining what this means.
This content is for informational and educational purposes only. This is not a recommendation regarding any investment or investment strategy. Any opinions expressed herein are those of the author and do not represent the views or opinions of TradeStation or any of its affiliates.
Investing involves risks. Past performance, whether actual or indicated by historical tests of strategies, is no guarantee of future performance or success. There is a possibility that you may sustain a loss equal to or greater than your entire investment regardless of which asset class you trade (equities, options, futures, or digital assets); therefore, you should not invest or risk money that you cannot afford to lose. Before trading any asset class, first read the relevant risk disclosure statements on the Important Documents page, found here: www.tradestation.com .


Ford potential H&S setup?Ford could be about looks like a H&S setup could be in the making on F a break below the neckline would confirm

FORD'S DOWNFALL PT. 2Price is currently sitting on a support line struggling to hold it. I believe in the next coming weeks we could see a break of this support and see price drop lower into the $10-$8. I will be looking for a put option once price pulls back for a retest (white arrows).

Ford and what to doPre-Sales of the Lightning were stellar. Haven't seen a truck on the streets as of yet but 2022 models were sold out and delivered.
2023 Models are being sold as we speak.
Also that Ford Electric network isn't the greatest thing on Earth which compounds things
Ford is still in the downtrend towards earnings. I wouldnt anticipate it breaking out until once we get numbers on how successfully 2023 is going.
Trending 222 Bearish on the daily and I expect it to continue.
Short on Ford until a week before earnings is my non-financial advise.
F 4/28 12P

FORD GOING THROUGH WYCKOFF ACCUMULATION: PROFITABLE ENTRIES SOONIf you are new to Wyckoff accumulation or distribution, please visit school.stockcharts.com
Unless you are familiar with the different steps in the Wyckoff method, some of the terminology and price stages will not make any sense to you, so I encourage you to read up on Wyckoff theories.
A couple of points to know:
-Fed is releasing expected rates tomorrow. Some say an almost 50% chance that they will ease rate increase down. No matter which way it goes, I believe that the rate increase (at any point basis) has already been "built into the cake", so to speak. I believe most people are net short the entire market structure, which makes for a very painful lesson to the common trader when market makers find liquidity to offset retail trader sheep behavior.
-Ford itself is at least short term accumulating while the markets in general are quietly building up steam to break short sighted sellers that only equate an economy in turmoil into market selloffs.
-Think about it... If shorting the market in general at a time when market weakness and fear are at an all time high was lucrative, THE COMMON RETAIL TRADER WOULD BE A MILLIONAIRE. But you're not... So why isn't it that easy? Because if it was, everyone would literally be doing it.
-Market structure strives on one main component: the majority cannot win. And if the majority are all going one way, it better not be the right way, or their way must be altered or manipulated to be the wrong way. This is the only way to keep the powerful in power, and power structures intact.
-The only way to survive as a trader is to recognize when that altering (or better yet, manipulating) is being done.
What to understand about the chart:
-Liquidity is what drives the market. Better yet, what drives the market makers.
-To understand when there is a fundamental shift (or reversal) by a market maker, you have to understand the signals they give, to give yourself a chance to get into the market with them.
-Markets in general are directional towards either supply, or demand. THE WAY PRICE REACTS TO LIQUIDITY IS WHAT ULTIMATELY DETERMINES REVERSALS.
-In Ford's case, the market structure changed to go towards the upside of liquidity last Monday. Market makers are now reacting to that shift, and manipulating the markets to position themselves for the perfect profit opportunity.
-This is where Wyckoff's work comes into play...... Once we have established that the market made a change in behavior, the Wyckoff structure begins to form. (In this case, being an accumulation pattern since we have shifted from price falling from liquidity, to all of a sudden pushing above it).
*I WILL BE MAKING A VIDEO ABOUT THIS SHORTLY TO EXPLAIN IN DETAIL*
(NOTE: FORD IS AN OPTIONABLE STOCK, SO YOU CAN "SHORT" IT BY PURCHASING PUT OPTIONS WHEN THE TIME COMES)


F putIn a good day, $F can't even stay positive.
Bought March 17th $16.35 put for $3.3
My breakeven is $13.05, the premium is almost 0 :)
Set a close price $3.55

FordMotor, 10d+/70.03%rising cycle 70.03% more than 10 days.
==================================================================================================================================================================
This data is analyzed by robots. Analyze historical trends based on The Adam Theory of Markets (20 moving averages/60 moving averages/120 moving averages/240 moving averages) and estimate the trend in the next 10 days. The white line is the robot's expected price, and the upper and lower horizontal line stop loss and stop profit prices have no financial basis. The results are for reference only.

Fall FORD? Ford is currently sitting below a weaker support zone showing weak buying momentum back into the area of support which could possibly be indicating a retest of the support to continue its overall down trend.

FLong idea break out the resistence and pull back if its can reject the previos resistence we can look for entry

$F with a bullish outlook following its earnings #StocksThe PEAD projected a bullish outlook for $F after a positive over reaction following its earnings release placing the stock in drift B with an expected accuracy of 60%.
FORD'S DOWNFALLPrice has been forming a descending triangle over the past few months after its quick drop from $25 to $11 in the first half of 2022. On top of this information, we can spot a gravestone doji when price tried to break out of this descending triangle but failed.

Ford, might be a long!I really like this set up but I don't feel super good about overall market paired with this. The TA is here, trade at your own risk.

$FORD - Triangle BreakoutThird consecutive upward swing breaking above the 50 EMA.
Candle not yet closed, but all remain unchanged, this is an above average sized bullish candle ... which is just as well depicted in the RSI plot.
The bulls have the momentum. There are converging technical hints vouching for their case.
On the not so bright side, volume is not ideal and there are plenty of overhead obstacles just ahead of the price.
No matter what you do: manage risk, manage risk, manage risk, manage risk ....

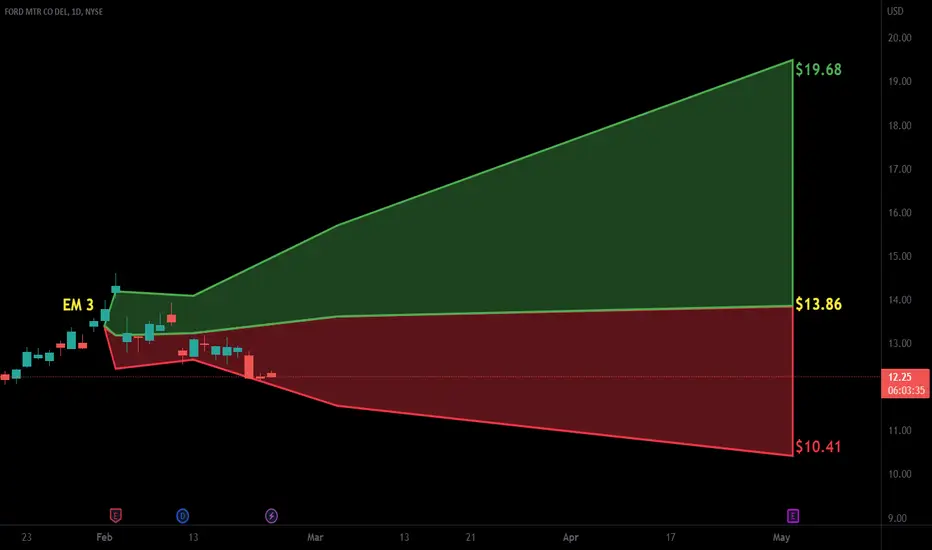
F seems to have peakedFord's cycle analysis seems to indicate a peak for the near term (Earnings is a wild card here). Its also hitting up against 78.6% short term Fib levels at $13.86. With Ford cutting its prices on Mach-E will out pressure on revenue and Ford would have to increase its sale (hopefully due to demand from reduced prices).
As cycles indicate a peaking and with ER around the corner, I am out of this position for now. ER could be the deciding factor to see if Ford still remains within the cyclic channels or if the cycles need to shift.
Disclaimer: My opinion on stocks are mine alone and not to be taken as Investment advice.

F Ford Motor Options Ahead of EarningsFord follows Tesla’s example and cuts price on Mustang Mach-E from as little as $600 to as large as $6,000. Most notable are the cuts to the Premium eAWD Standard range model, which takes it to $53,999 from $57,676.
Looking at the F Ford Motor options chain ahead of earnings , I would buy the $13.5 strike price Calls with
2023-2-3 expiration date for about
$0.21 premium.
If the options turn out to be profitable Before the earnings release, I would sell at least 50%.
Looking forward to read your opinion about it.

Ford Double topDouble top showing here. Very high chance of this falling back to 11$ in near future
The double top is the minor pattern at play here.
The major pattern is the descending triangle that will take this back to single digits
