$GOOGL $GOOG AI Signals a Volatile Expansion 🔍 Technical Overview (Daily TF)
GOOGL is currently trading at $180.19, breaking upward inside a well-defined bullish channel, hugging equilibrium levels after consolidating just below the $184 resistance zone. This setup reflects classic Smart Money reaccumulation behavior:
🟩 Current Structure: CHoCH → BOS confirmed on higher lows
📊 Equilibrium: Mid-channel value alignment; strong price efficiency with low imbalance
🟧 Premium Zone: $202.81–208 marked for liquidity sweep (target zone)
🔴 Strong Highs: Not yet swept; draw on liquidity to the upside likely
Key price levels:
Resistance zone: $184.00–208.00
Support cluster: $172.00–168.00
Discount Block (Demand): $144.00–132.00
🤖 VolanX AI Models Forecast (as of July 12)
📌 Model 1 – Smart Money AI Trading Suite
LSTM Forecast: +9.0% gain expected over next 14 days
Target: $196.34
Market Condition: Overbought (No order blocks currently)
Volatility: 26.4%
Volume Shift: -15.5% (suggesting short-term supply exhaustion)
📌 Model 2 – WaverVanir DSS Platform
Sentiment Score: 78 (bullish bias)
15-Day Prediction: $182.34 (+1.2%)
30-Day Prediction: $184.36 (+2.3%)
📈 Note: The DSS is projecting slower upside in comparison to the Smart Money AI suite. This divergence suggests that while short-term price may rise, the major move could depend on external catalysts.
🌍 Macro & Catalyst Outlook
NASDAQ Tech Momentum: Q2 earnings in July will be a key macro driver
Yields & Dollar Index: Softening DXY supports tech; watch 10Y real yield inversion
AI Sector Beta: GOOGL is lagging NVDA/MSFT but may play catch-up into August
CPI/Inflation Watch: If inflation readings cool, it may trigger flows into mega-cap tech
Fed Policy Risk: September dot-plot shift could trigger volatility (Fed pivot vs sticky inflation)
🧠 WaverVanir DSS Conclusion:
📌 Bias: Bullish-to-Neutral
📌 Trade Zone: Watching for breakout above $184 to trigger sweep toward $196–202
📌 Invalidation: Break below $168 invalidates bullish structure; targets $144 liquidity pool
📌 Strategy: Standby mode; entry requires confirmation of volume breakout above range high.
📢 WaverVanir Insight:
"Smart Money has shown its hand — compression is a prelude to expansion. We're monitoring confluence between AI signal alignment and SMC structures. $196 target remains valid unless CHoCH flips bearish with volume."
#WaverVanir #VolanX #SmartMoneyConcepts #GOOGL #AITrading #InstitutionalFlow #LSTM #VolumeProfile #TradingView #MacroAnalysis #StockForecast #Alphabet #MarketForecast
4GOOGL trade ideas

GOOGL TRADE IDEA (07/24)
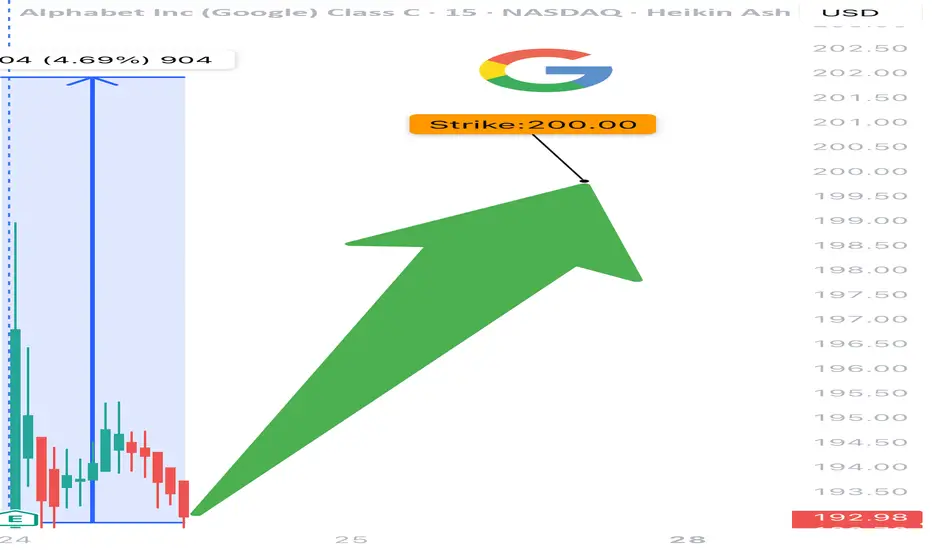
🚨 GOOGL TRADE IDEA (07/24) 🚨
💥 Big institutional flow. 1 DTE. High gamma = high reward (⚠️ high risk too)
🧠 Quick Breakdown:
• Call/Put Ratio: 2.44 → ultra bullish
• Weekly RSI climbing (67.3) 📈
• Daily RSI falling from 77.5 → 🔻 short-term pullback risk
• Reports split: trade or wait? We’re in.
💥 TRADE SETUP
🟢 Buy GOOGL $200 Call exp 7/25
💰 Entry: $2.09
🎯 Target: $3.14–$4.18 (50–100%)
🛑 Stop: $1.25
📈 Confidence: 70%
⚠️ Expiry in 1 day = tight execution needed. Gamma can cut both ways. Watch it like a hawk. 👀
#GOOGL #OptionsFlow #CallOption #GammaSqueeze #TechStocks #UnusualOptionsActivity #TradingView #StockAlerts #BigMoneyMoves #DayTrading #OptionsTrading
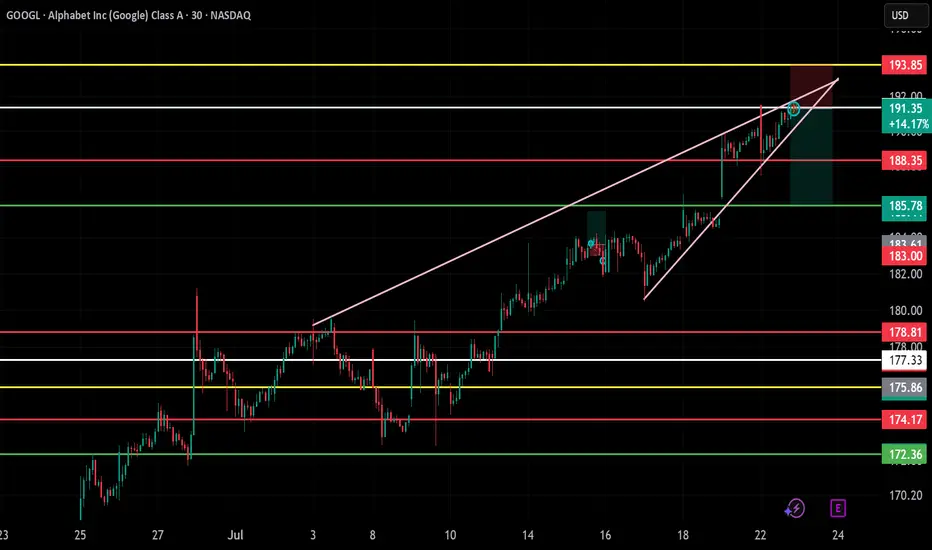
GOOGL – Short Trade!📌
Entry: 191.35
Target: 185.78
Stop-Loss: 193.85
Setup: Rising Wedge Breakdown
Bias: Bearish
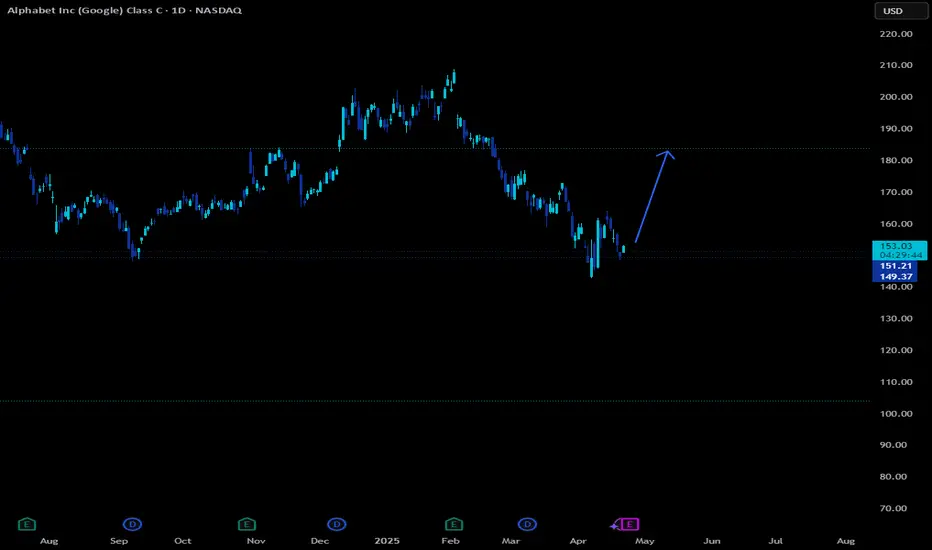
GOOG Wave B
Bullish price action from the last couple of months has been unconvincing, and this looks more like a wave B correction.
A break of the black ascending channel would be a trigger for wave C.
It would be interesting to see a reversal pattern in smaller timeframes if price touches the gray supply zone.

GOOGL Short Term Trading IdeaEntered at $173.55 on 07/08.
Expecting earnings to be reported on 07/23 and beat expectations by a huge margin.

GOOGL Looks Ready to Reclaim the Channel for July 10GOOGL Looks Ready to Reclaim the Channel – Watch These Key Zones! 📈
🧠 GEX-Based Options Sentiment Insight (20 DTE):
GOOGL shows a strong bullish options bias going into this week, with CALLs comprising 20.3% of flow and a positive Gamma Exposure (GEX) reading. Here's the breakdown:
* Gamma Wall (Resistance): $180–$182.50
* 2nd CALL Wall: $177.50 (69.5%) – key magnet
* Highest Positive NET GEX: $180 – breakout level for upside continuation
* Support Zone: $172.5 (Put Wall -31%)
* PUT Pressure Floor: $170–$167 range (3rd/4th PUT wall cluster)
🔧 Option Strategy Suggestion:
🎯 Bullish setup
* Consider 177.5c or 180c contracts (0DTE or 7/12 expiry) for quick moves if price holds above $175 and breaks $177.50.
* Scalp the range to $179–$180, trail stops near $174.80.
* Aggressive breakout players can aim for $182.50 if volume confirms.
🛑 Bearish hedge
* If price breaks $172.50 with strong volume, consider 170p or 167.5p targeting the lower PUT Wall zone.
* Keep stops tight above $174.96.
📊 1-Hour Chart – Price Action Breakdown
GOOGL recently flipped bullish with a BOS and a solid CHoCH confirmation. Price reclaimed a critical trendline and retested a fair value gap inside the green demand zone.
* Current Price: $176.45
* Key Demand Zone: $172.8–$174.9 (multiple FVG and liquidity sweep confluence)
* CHoCH + BOS combo: Indicates momentum shift
* Supply Zone (Resistance): $177.9–$179.7
* Trendline Breakout Retest Confirmed
🧭 If buyers defend above $174.9–$175, we could see a move toward $179.67 and possibly challenge the $181.96 high. A failure below $173.5 risks a full reversion to the prior range near $170.
🎯 Trading Plan Summary:
* Bullish Scenario:
* Entry: Above $177.50
* Target: $179.67 → $182
* Stop Loss: Below $174.96
* Bearish Scenario:
* Entry: Below $172.50
* Target: $170 → $167.5
* Stop Loss: Above $175.10
This analysis is for educational purposes only and does not constitute financial advice. Always do your own research and manage risk accordingly.

Google: Upcoming TopWe locate Google in turquoise wave 2 (of a downward impulse). In more detail, we see the stock developing a complex - - - pattern and expect turquoise wave 2 to conclude imminently with wave . All the while, the price should maintain a safe distance from resistance at $209.28. Looking ahead to turquoise wave 3, we anticipate sell-offs down into our magenta Target Zone between $123.92 and $98, before wave 4 likely triggers a temporary rebound up to the $138.35 level. Ultimately, the entire turquoise downward impulse should bottom out again in the magenta zone, which would also mark the completion of waves (C) in magenta and in green. Since a new larger upward phase should begin afterward, the magenta zone presents an opportunity to establish long positions. However, if Google were to break above the $209.28 resistance next, we would have to expect a new high for magenta wave alt.(B) —which would only temporarily postpone the anticipated sell-off though (probability: 24%).
📈 Over 190 precise analyses, clear entry points, and defined Target Zones - that's what we do.

Short term (GOOG) shortCaught it on the fib pull back. Very short term trade as overall market trend is bullish.

GOOGL Dips: Buy Opportunity Looms at $173.5FenzoFx—#GOOGL broke below the previous day's low at $175.68, aiming toward the $173.53 support.
This zone is backed by the anchored VWAP, which can provide a discount price to join the bull market.

GOOGL – Sitting on the Edge! What’s Next After This Break? 📊 GEX Analysis – Options Sentiment Insight:
* Call Resistance Wall: Strongest resistance at 180–182.5 area (High GEX%, Gamma Wall, 2nd & 3rd CALL Wall). A breakout above this may trigger a gamma squeeze.
* Support Zone: HVL @ 174.39 — aligned with PUT support and GEX10 (-6.92%) at 167.5, forming a key downside guardrail.
* Gamma Exposure (GEX): Green double-dot 🟢🟢 = supportive for bullish bias but nearing exhaustion.
* IVR/IVx: IVR 40, IVx avg 37.2 — Neutral to slightly bullish. Options aren't overly expensive, risk-reward still good for directional plays.
* Call Participation: 16.4% CALLS = Moderate bullish activity but not extreme greed.
🔥 Options Strategy Idea:
* Bullish case: If price holds above 174–175, consider 7/12 or 7/19 180C debit spread (e.g., Buy 175C / Sell 180C).
* Bearish case: Break below 173.5 and you can play PUT debit spread down to 170 or 167.5.
📉 1-Hour Chart Analysis (Intraday/Swing):
* Structure: Bearish CHoCH confirmed. Price has pulled back after rejecting from red OB zone (~179.5–180).
* Current Action: Price hovering below trendline and sitting above demand zone (173.5–174.4). Break and close below this could lead to continuation down toward 170.5 / 167.5.
* Bias:
* Bearish under 177.06.
* Neutral chop zone between 174–176.6.
* Bullish recovery only above 177.5–179.5 reclaim.
🎯 Scenarios & Trade Setups:
* Scalp BUY Setup:
* Entry: Hold above 175
* Target: 177 / 179.5
* Stop: Below 173.5
* Scalp SELL Setup:
* Entry: Break and retest below 173.5
* Target: 171 → 167.5
* Stop: Back above 175
📌 Thoughts & Suggestions:
* GOOGL’s options positioning suggests a potential bounce, but the bearish CHoCH and rejection at resistance urges caution.
* If bulls reclaim 177.5, we may see a push to test the heavy CALL walls at 180–182.5.
* Trade defensively inside chop zone, don’t force full directional plays unless you see clean BOS or demand failure.
Disclaimer: This analysis is for educational purposes only and does not constitute financial advice. Always do your own research and trade responsibly.

Google Long Swing Tradewant to see us hold this yearly level to test the monthly shoulder. Would get out if we start breaking down here.
GOOGLE Count changed, Bullish outlook.I have adjusted NASDAQ:GOOG NASDAQ:GOOGL Elliot wave count with a wave 1 completing a leading diagonal backed up by a deep wave 2 correction into High Volume Node support (HVN). We potentially have another 1-2 with fast drop and recovery to the S1 daily pivot which would make long term outlook extra bullish by extending target.
Wave 3 is underway with a target of the all time hime high HVN for wave 5. The next resistance HVN is $191.
Price above the daily pivot and is continuing upwards after testing as support.
Analysis is invalidated below $162 swing low.
Safe trading

GOOGLE GOLDEN CROSS INCOMINGNASDAQ:GOOGL NASDAQ:GOOG GOLDEN CROSS!
The overhead gap will be filled.
It is inevitable.
-READ THE CHARTS 7/5/25

GOOGL Breaking Out of Downtrend? July 7🔍 GEX-Based Options Insight (Chart 1)
* Current Price: $179.53
* Highest Positive Gamma Level: $180 — this is the key gamma wall. Price is magnetized toward it and may experience hesitation or consolidation here.
* Call Walls Above:
* $182.5 → 2nd Call Wall
* $185 → 3rd Call Wall (possible extended target if momentum remains bullish)
* Put Walls Below:
* $170, $165 → Both levels suggest downside is well-defended by PUT buyers
* Options Sentiment:
* IVR: 36.2 (fairly elevated)
* IVX > IVR (IV expansion potential)
* Call Bias: 22.9% Call$, GEX bullish (green circles)
* 🔋 Interpretation: Bullish GEX + elevated IV suggests strong upward pressure. Consider buying CALL options near $179–$180, targeting a breakout continuation toward $182.5–$185.
🧠 1-Hour Technical Analysis (Chart 2)
* Structure: GOOGL just broke a local CHoCH → BOS, reclaiming short-term EMA support.
* Trendline Breakout: Clean break above descending trendline + break of BOS = bullish confirmation.
* Support Zones:
* $178.85 (minor support)
* $175.70 and $173.50 (stronger demand)
* Next Resistance Levels:
* $181.61 → matches GEX wall
* $185.0 → next key area to watch if breakout sustains
* Volume: Bullish breakout accompanied by rising volume = healthy momentum
* Bias: Leaning bullish, but needs to hold $178.85 zone to stay valid.
✅ Trade Plan Suggestion
Call Entry Idea:
* 📍 Entry: $179–$180 (on pullback or breakout)
* 🎯 Target: $182.5 → $185
* ⛔️ Stop-loss: Below $178.50
* 📆 Contract: 1–2 weeks out (due to IV and potential expansion)
Note: If it fails to hold $178.50–$175.70 zone, re-evaluate for PUTs or wait for new structure confirmation.
This analysis is for educational purposes only and does not constitute financial advice. Always manage risk and trade with a plan.

This Looks So Bullish (I See A Cup And Handle. What do you see?)Pattern Identified: Cup and Handle
From the chart of Alphabet Inc. (GOOGL), the most prominent and likely bullish pattern is a Cup and Handle formation:
Cup Formation:
The price declines sharply around February–April 2025.
It then forms a rounded bottom.
Recovers back to the previous resistance near $180 in June–July.
Handle Formation:
A short pullback (forming a small downward-sloping consolidation).
Followed by a breakout around $180.55 (current price).
Price Target Calculation:
Formula:
Target Price = Breakout Level+(Cup Height)
Breakout Level: ~$180
Cup Bottom: ~$145
Cup Height: 180 - 145 = $35
Target Price = 180+35 = 215

GOOG - Momentum - Long setupGOOG - Here is another momentum trade setup. Money flow is positive. And we have Analyst rating for this is Strong Buy.

GOOG LongMarket Structure Breakdown
Initial Break of Structure (BOS) – Bearish Phase
A significant bearish BOS occurred after a liquidity sweep above the prior high. This marked the temporary dominance of sellers, driving price downward.
Change of Character (ChoCh) – Sentiment Shift
Following the bearish leg, price printed a sharp recovery and broke above internal lower highs, signaling a Change of Character. This is the first indication of buyers regaining control.
Bullish BOS – Confirmation of Uptrend
The bullish BOS validated the upward structural transition, establishing new higher highs and higher lows. This confirms that institutional order flow has shifted bullishly.
🔹 Liquidity Dynamics
The liquidity sweep at the recent low (marked with a red dot) is a critical manipulation event, removing weak longs before institutions accumulate.
The current price action is printing a re-accumulation range, where price is likely to dip into key zones to trap breakout sellers.
Multiple liquidity pockets (green shaded regions) below serve as potential inducement zones. These areas may be revisited to gather liquidity before the next leg higher.
Final target is projected near the higher time frame sell zone around the $186–188 level, where substantial resting liquidity likely exists from previous swing highs.
🔹 Risk Management Considerations
Entry Zones: Look for confirmation-based entries within the liquidity trap zones, avoiding premature positioning at highs.
Stop-Loss: Place invalidation levels below engineered sweep zones to prevent getting caught in liquidity grabs.
Scaling Strategy: A tiered entry model can be effective here — initiating partial entries at the first trap and scaling in on deeper retracements.
Targeting: Conservative traders can aim for the internal high; aggressive positioning could seek full mitigation of the higher time frame zone.

GOOGL Option Flow Suggests Opportunity Ahead 🧠 GEX Sentiment Breakdown (Options Insights):
From the GEX data:
* GEX is green with 3 bullish signals ✅
* Call flow dominance at 21.3%, showing stronger bullish participation
* IVR: 37.1 — implying slightly elevated premium conditions, which benefits directional plays
* Key Levels:
* $180 → Major Call Wall (profit-taking & resistance)
* $177.5 → 3rd Call Wall (possible stall zone)
* $175 → 2nd Call Wall, currently being tested
* $172.5 → HVL + GEX Support, critical for bulls to defend
* $170 → Next GEX flip zone
💡 Trade Bias from GEX:
→ BUY CALLS if price reclaims and holds above $175 with momentum
→ Avoid CALLS if it rejects $175 and drops under $172.5 — at that point, PUTs become viable
📉 1H Price Action (Intraday Game Plan):
Based on the second chart:
* GOOGL is consolidating just below a recent CHoCH zone (change of character), forming a tight range under a bearish breaker block at $176–$178
* Trendline from June breakout was broken and is now acting as dynamic resistance
* If $175.80–176.20 gets rejected again, we may see a move down to test $172.50 or deeper into demand zone near $170–$168
📊 Intraday Setup Ideas:
🔼 Bullish Setup (CALLS):
* Entry: Above $176.20 with strong volume
* Target: $178 → $180 (Gamma Wall & resistance)
* Stop: Below $174.80
* Best if IV stays stable and GEX remains bullish
🔽 Bearish Setup (PUTS):
* Entry: Rejection at $176 → enter short or PUTs below $174.50
* Target: $172.35 → $170
* Stop: Above $176.50
* Confirmation if GEX flips or if IV spikes and GEX green dots disappear
🎯 My Thoughts:
This is a tricky zone. GOOGL is sandwiched between resistance at $176 and support at $172.5. GEX flow supports buying CALLs on strength, but price needs to break above $176 to make that valid. Watch for any gap open or strong push with volume for confirmation. If the market stays weak, don’t chase CALLs blindly — the safer play is fading into $170.
Disclaimer:
This breakdown is for educational use only — not financial advice. Trade at your own risk, manage position sizing, and stay disciplined.

GOOGL Setup | AI-Backed Forecast + SMC Convergence🧠 Posted by: WaverVanir_International_LLC
🗓 June 30, 2025 | Model: VolanX DSS + SMC Fib Map
🔍 AI Prediction Snapshot (WaverVanir DSS):
Current Price: $178.53
Sentiment Score: 70 (Bullish Bias)
15D Forecast: $182.32 (+2.1%)
30D Forecast: $185.14 (+3.7%)
Model Inputs: LSTM + Volume + Fractals + Sentiment NLP
📐 Technical Alignment (SMC / Fibonacci Map):
Cup & Handle breakout forming after BOS above $173
Fib Levels to Watch:
1.382 = $192.71
1.618 = $200.38
2.0 = $212.78
Liquidity Zones:
Discount Pool = $162.30
Premium Target = $205.72
Bias: Bullish → Targeting premium inefficiency fills
🎯 Trade Plan
📥 Entry Zone: $176.00–$178.50
🎯 TP1: $185.14 (AI model)
🎯 TP2: $200.38 (Fib 1.618)
📉 SL: $162.30 (below structural liquidity)
⚖️ Risk-Reward: 3.1+
🧩 Optional: Re-enter on retrace if volume confirms handle retest
🧬 WaverVanir Narrative
“We don’t just trade the chart — we activate the timeline.”
VolanX DSS indicates a sentiment-backed continuation aligned with institutional price architecture. This move is supported by equilibrium reclaim, a high-probability demand sweep, and predictive convergence from both neural and smart money models.
#GOOGL #LSTM #VolanX #SMC #TradingAI #WaverVanir #Fibonacci #SmartMoneyConcepts #TechStocks #AITrading #InstitutionalFlow


GOOGL is facing resistance 181.11NASDAQ:GOOGL
Google is in uptrend . Currently it is facing the resistance 181.11.
It has slightly pull backed from the resistance.
Pattern : Ascending channel - a bullish chart pattern. To valid this pattern the price has to consistently make higher highs and higher lows. But the price is now facing the resistance 181.11 To make higher high it has to break it.
If it fails to break the resistance , sideways trend may be seen here for short period of time and bullish momentum may become weak.
Note :
If you’re interested in receiving detailed technical analysis reports on your selected stocks, feel free to reach out to me. I can provide you with customized reports covering trends, key levels, momentum, patterns, and price projections to support your trading or investment decisions.

Trade Review: Why I Ejected GOOGL Before the SlideNASDAQ:GOOGL Friday looked promising: Alphabet ( NASDAQ:GOOGL ) briefly punched above a six-month down-trend line on 1.5× average volume. But by Monday’s open the tape screamed “supply.” Here’s the quick anatomy of the cut—and why capital rotation beats hope every time.
What I Wanted
A clean break through 178 → trend-line flip into support → momentum push toward the 200-210 supply shelf.
What I Got
• Effort ≠ result: 63 M shares traded yet price closed near the session low.
• RS line refused to make new highs; mega-cap peers out-performed.
• The “line-in-sand” (21-EMA / 172.50) was threatened at Monday’s open.
Decision Rule
“Breakouts must work right away—if they don’t, sell quick.” – Mark Minervini
I pulled the ripcord at 176.18, a hair below my entry, preserving both cash and mental capital.
Result
-1.2 % paper cut, +$11K buying power released for higher-grade setups (BSX, SMCI).
Key Lesson
Great trades start with statistics, not stories. When the odds flip against you—even with an 8 : 1 theoretical R:R—the right move is to recycle ammo into the next A-setup.

Alphabet Inc. ($GOOGL) – SMC Reaccumulation or Trap?📍 Market Context
Alphabet just printed a strong impulsive bullish candle into premium territory, touching the 0.886 retracement level near $181.22 before rejecting. Price is now consolidating near the golden pocket retracement zone (~$176.48–175.39) after a high-volume breakout.
📊 Scenarios Mapped by VolanX DSS:
✅ Scenario A – Bullish Reaccumulation (65% Probability)
Price finds support near $175.39 (0.5 retrace) or equilibrium zone and absorbs supply.
Break above $178.53 reactivates bullish continuation toward:
T1: $181.22 (liquidity sweep)
T2: $184.84 (Fib extension target)
⚠️ Scenario B – Liquidity Trap & Distribution (35% Probability)
If $175.39 fails, watch for a deeper retracement into:
Equilibrium demand zones: $172.50 → $170.00
Accumulation reaction expected there, or invalidation if $168 breaks
📈 SMC Structure
CHoCH and BOS confirmed prior to impulse
Volume climax indicates potential liquidity shift
Premium zone at $180–181 may act as magnet for smart money
🎯 Execution Framework
Entry: Scalp long near $175.39–176.00 with tight stop
Invalidation: Close below $174.00 on volume
Target: $181.22 → $184.84
RRR: 2.5x–3.8x depending on confirmation at retest
💡 “Liquidity isn’t lost — it’s redirected.” – VolanX Protocol
🔐 Posted by WaverVanir International LLC under the DSS Smart Execution Model.
#GOOGL #Alphabet #SmartMoneyConcepts #VolanX #WaverVanir #BreakoutStrategy #LiquiditySweep #OptionsFlow #MarketStructure #RiskManagement #FibonacciStrategy
