GOOGL Breaking Down or Just Resting? Watching This Zone Closely 🧐Looking at the daily chart, GOOGL had a strong bounce earlier in April but seems to be pausing right at a familiar trouble spot. Price is now stalling near the March-April highs — an area where buyers have previously run out of steam. The last few candles are showing rejection wicks, suggesting that sellers are defending this zone again.
MACD has crossed bullish but isn't accelerating aggressively, and Stoch RSI is in overbought territory — hinting at some short-term exhaustion. This makes me think we might not get a clean breakout unless volume really picks up.
Now switching to the 1-hour timeframe, you can see it even more clearly — GOOGL has been stuck in a descending wedge pattern since that big earnings candle. Price keeps testing the upper wedge but fails to break through convincingly. Momentum looks weak here — MACD is flattening, and Stoch RSI is curling down. This tells me buyers are hesitant, and the bulls need a push soon or this could slip further.
Looking at the GEX and options data, there’s a big gamma wall sitting at $165, which aligns perfectly with the top of the wedge. That's going to act like a magnetic ceiling unless there's a serious catalyst. Meanwhile, downside support exists near $157.5 where the HVL (high volume level) aligns with GEX support. IV is down -9.98%, and the Options Oscillator shows heavy PUT positioning, meaning options sentiment is skewing defensively even though price hasn’t broken down yet.
🔎 My Take:
Right now, GOOGL is in a "prove-it" zone. Bulls had a great run but are hesitating at resistance. If price can reclaim and hold above $161.30–$165 (especially on volume), that would trigger momentum continuation and possibly a gamma squeeze toward $170+. Otherwise, failure to break out — especially if price dips below $157.5 — opens up room for a quick fade toward $155 or even $150 PUT walls.
✅ Trading Thoughts:
* Bullish scenario: Look for price to reclaim and hold above $161.30 with volume. A breakout through $165 could trigger a fast move toward $167–$170.
* Ideal Call setup: 165C or 167.5C (May expiry), but only above $161.30 with momentum.
* Bearish scenario: If price gets rejected again and loses $157.50, I’d look short down to $155 or even $150 PUT GEX wall.
* Ideal Put setup: 155P or 150P (May 10DTE) if $157.50 breaks.
* Neutral: It’s in a wedge with low momentum and IV compression. Don’t force trades here — let price pick a side. This is one of those "react, not predict" moments.
4GOOGL trade ideas

BULLISH TREND in The Google AnalsisA bullish trend in the google shares and can see using candlesticks making trade

TradingView Live Show: Charting Volatility with TradeStationJoin us for an insightful TradingView live stream with David Russell, Head of Global Market Strategy, as we dive into the impact of tariffs, market volatility, and key macroeconomic developments shaping today's trading environment.
Oh, and don't forget, TradeStation is sharing ideas here: www.tradingview.com
In today’s session, we’ll break down how escalating tariff tensions and unpredictable global trade policies are fueling market volatility—and how you can navigate these shifts using powerful tools on the TradingView platform.
We’re also unveiling a major update to our broker integration with TradeStation, opening the door to expanded trading opportunities. With this enhanced connection, you can now trade equity options directly on TradingView—an exciting addition to our growing suite of options tools like the strategy builder, chain sheet, and volatility analysis. These features are especially useful in today’s uncertainty-driven markets.
TradeStation, a fintech pioneer since 1982, is known for delivering institutional-grade tools, personalized service, and competitive pricing. They continue to be a trusted partner for both active traders and long-term investors looking to navigate complex markets with confidence.
This session is sponsored by TradeStation, whose mission is to deliver the ultimate online trading experience for self-directed traders and investors in equities, equity index options, futures, and futures options markets. Equities, equity options, and commodity futures services are offered by TradeStation Securities Inc., member NYSE, FINRA, CME, and SIPC.
Important disclosures:
tradestation.com/important-information/
tradestation.com/insights/etf-disclosures/

GooglLooking for a leg up to its weekly 50 sma or 174 gap close
Current pattern is A double bottom with pullback (Handle)
Strong long over 161
Stop below 158
One of the things you notice on bullish pullback is the decreasing sell volume .. that usually means a bear trap.

GOOGL eyes on $159.41-160.25: Key support that bulls MUST HoldGOOGL had a nice bounce into Resistance and retracing.
Watching well proven support zone now, at $159.41-160.25
Bulls need to Hold this zone and start going back Northward.

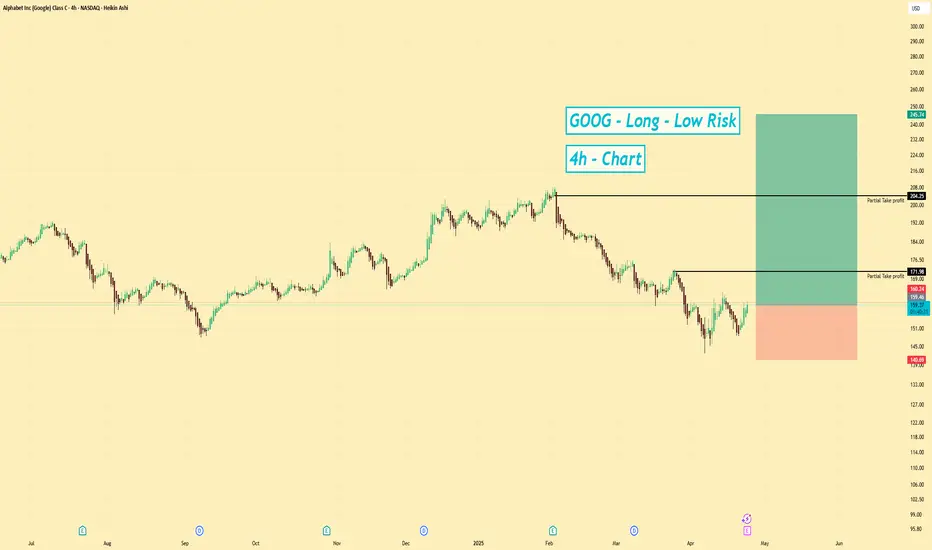
GOOG LongGOOG
Fundamentals:
- Low P/E = 18, compared to historical average 24
- Expert consensus $204
- Growing EPS and Revenue
- Shares buyback
Technicals
- Near Year ATR Low
- Near 200VWMA Extension 25%
Entry
- 163
- 125
Take:
- 200
- 225
- 250
Stop:
- 100

GOOGL Alphabet Inc (Google) Opportunity After the Breakout?The stock's recent breakout from a descending channel pattern indicates potential for continued upward momentum. Monitoring the $155 support level is crucial, as a drop below may signal a trend reversal.
📊 Technical Analysis
Current Price: $161.96
52-Week Range: $140.53 – $207.05
Recent Breakout: Surpassed descending channel resistance
Key Support: $155
🎯 Entry Points:
$158 (ideal pullback)
$155 (support confirmation)
$145-132 (aggressive long-term entry)
📈 Targets:
First target: $168
Second target: $182
Third target: $196+
Disclaimer:
This analysis is for educational and informational purposes only and should not be considered financial advice. Always do your own research before making any investment decisions.

Google stock oscillates below $170 after earnings releaseGoogle's stock managed to post a bullish gap of more than 3% in the last session, shortly after the company announced its quarterly results. Initially, it was reported that total sales for the last published quarter reached $90.23 billion, compared to the expected $89.12 billion. In addition, the company posted earnings per share of $2.81, beating expectations of $2.00. This positive outcome initially triggered a spike in investor confidence, but for now, the market sentiment has stabilized, and the stock is closing the week with a bearish candlestick on the chart.
Previous trendline break:
The recent consistent bullish movements in Google have been important in breaking a downward trendline that was previously dominant on the chart. For now, this has paved the way for a new bullish bias, and a new upward trendline could be forming, potentially becoming the most relevant technical structure for the stock in the coming sessions. However, it is important to note that this early bullish trendline still requires new price highs to confirm its strength.
ADX:
Although ADX oscillations remain above the neutral 20 level, the slope of the line has started to turn negative. This suggests that, despite the positive earnings, volatility may be beginning to decline, which could eventually lead to a sideways bias in the stock’s movements in the short term.
MACD:
The MACD histogram continues to show oscillations above the neutral 0 line, but it is becoming increasingly necessary for this to be sustained to confirm the buying strength reflected in the moving averages. If the MACD starts to decline, it could be interpreted as a bearish correction signal that may weigh on Google's price.
Key Levels:
$175: A relevant resistance aligned with the 100- and 200-period moving averages. Buying oscillations reaching this level could reactivate bullish momentum and give way to a new relevant uptrend.
$160: A nearby support zone aligned with the 23.6% Fibonacci retracement level. It could serve as a tentative barrier where potential short-term downside corrections might occur.
$143: A definitive support that coincides with the recent lows of the stock. A pullback toward this level could reactivate the previous bearish trend in this market.
Written by Julian Pineda, CFA – Market Analyst

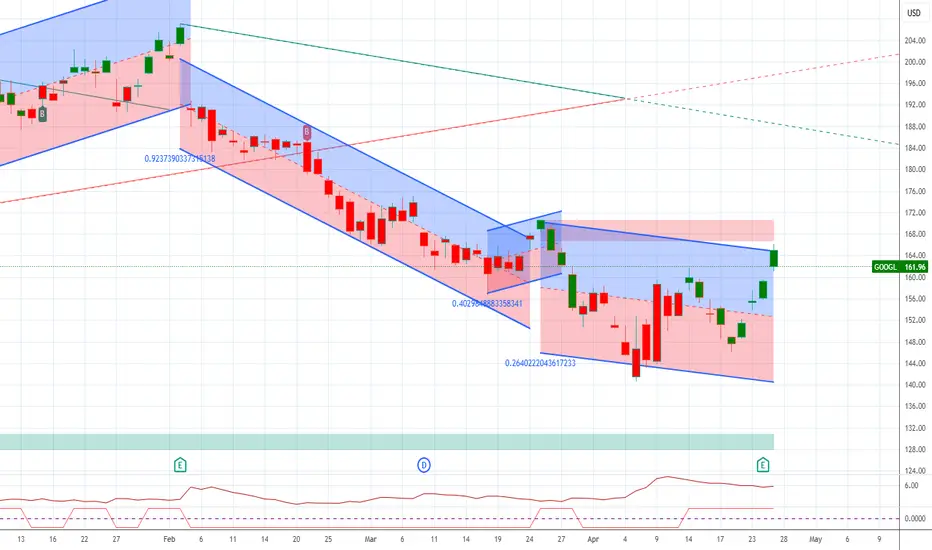
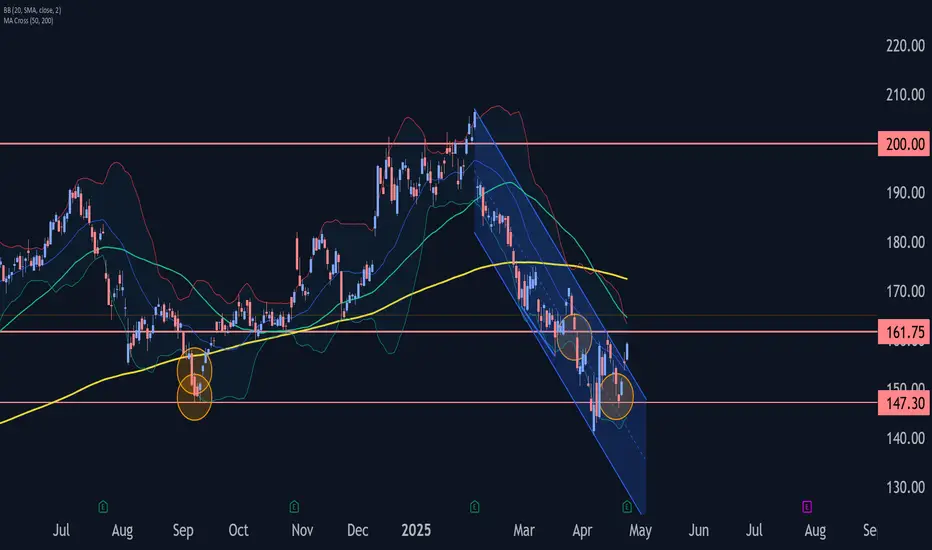
Google Wave Analysis – 25 April 2025
- Google reversed from the support zone
- Likely to rise to the resistance level 161.75
Google recently reversed sharply from the support zone between the long-term support level 147.30 (which has been reversing the price from September of 2024) and the lower daily Bollinger Band.
The price previously broke the resistance trendline of the daily down channel from February – which strengthened the bullish pressure on Google.
Google can be expected to rise toward the next resistance level 161.75 (top of wave 2 from the middle of April).
Alphabet Shares Surge 6% In Premarket Amid Earnings BeatShares of Alphabet Inc. (NASDAQ: NASDAQ:GOOG ) spike 6% in Friday's premarket session amidst earnings beat.
Google parent Alphabet (NASDAQ: NASDAQ:GOOG ) reported first-quarter revenue and profit that exceeded analysts’ expectations, sending shares higher in extended trading Thursday.
The tech giants reported revenue of $90.23 billion, up 12% year-over-year and above the analyst consensus from Visible Alpha.1 Net income of $34.54 billion, or $2.81 per share, compared to $23.66 billion, or $1.89 per share, a year earlier, also topping Wall Street’s estimates. Google Cloud revenue rose 28% to $12.3 billion, while Search & Other segment revenue grew 10% to $50.7 billion.
Alphabet also raised its quarterly dividend by 5% to 21 cents, and announced an additional $70 billion in stock buybacks. Alphabet's Class A shares rose close to 5% in after-hours trading. The stock was down about 16% for 2025 through Thursday’s close.
Alphabet Reiterates Spending Plans as AI Features Expand Reach and Engagement
CEO Sundar Pichai said Search growth was driven by "engagement we’re seeing with features like AI Overviews, which now has 1.5 billion users per month" after launching in May 2024.2
“We do see a tremendous opportunity ahead of us across the organization,” CFO Anat Ashkenazi said, adding that Alphabet ended the quarter with more Cloud demand than it had capacity.
Technical Outlook
As of the time of writing, shares of NASDAQ:GOOG are up 5% in Friday's premarket trading, bouncing off from the critical support zone of $146. NASDAQ:GOOG 's next top is the $200 resistant a move that will deliver a stunning 29% in gains. All present metrics are pointing to a bullish campaign, the asset is already trading below key moving averages giving NASDAQ:GOOG room to capitalize on this technical to make a comeback.

GOOGLE: Attention!!! Bullish force assured!!Alphabet, Google's parent company, presented its results for the first quarter of the year this Thursday, in which it obtained a profit of $34.540 billion, representing a 46% increase compared to the $23.662 billion obtained in the same period of the previous year.
The company also exceeded expectations with its revenue figure, which stood at $90.234 billion, after registering a year-on-year increase of 12%, while the consensus expected it to be $89.120 billion. For its part, operating profit grew to $30.606 billion, with a margin of 34%.
In summary: VERY GOOD RESULTS, and if we add to this the favorable moment we are experiencing due to the TARIFF issue... it WILL go up, no doubt!
---> What is the technical aspect?
If we observe the H1 timeframe chart and its summary table, its trend was clearly bearish, but showing THE FIRST BULLISH SIGNALS. On Wednesday, the bullish force (Bull) signal appeared on the H1 chart, and yesterday, Thursday, it appeared on the H4 chart. Although its trend is still bearish, since its FORCE is now bullish, we can start thinking that its trend could change to BULLISH in the coming days if there are NO NEWS that get in the way.
---> Where do we make the entry?
As the results were published at the close of the American market, today it is most likely to open with a bullish GAP. Here we can do 2 things:
1) If the gap is small, enter at the opening.
2) If the gap is VERY LARGE, wait for a pullback during the day to enter at a better price.
--------------------------------------
Strategy to follow:
ENTRY: We will open 2 long positions in the current zone or taking advantage of a pullback in price (depending on the market gap).
POSITION 1 (TP1): We close the first position in the 183 zone (+12%)
--> Stop Loss at 148 (-8%).
POSITION 2 (TP2): We open a Trailing Stop type position.
--> Initial dynamic Stop Loss at (-8%) (coinciding with 148 of position 1).
--> We modify the dynamic Stop Loss to (-1%) when the price reaches TP1 (183).
-------------------------------------------
CLARIFICATIONS OF THE SETUP
*** How to know which 2 long positions to open? Let's take an example: If we want to invest 2,000 euros in the stock, what we do is divide that amount by 2, and instead of opening 1 position of 2,000, we will open 2 positions of 1,000 each.
*** What is Trailing Stop? A Trailing Stop allows a trade to continue gaining value when the market price moves in a favorable direction, but automatically closes the trade if the market price suddenly moves in an unfavorable direction by 1 a certain distance. That certain distance is the dynamic Stop Loss.
-->Example: If the dynamic Stop Loss is at -1%, it means that if the price makes a downward movement of -1%, the position will be closed. If the price goes up, the Stop Loss also goes up to maintain that -1% on the rises, therefore, the risk is increasingly lower until the position enters profits. In this way, very solid and stable trends in the price can be exploited, maximizing profits.

$GOOG Possible Demand Zone 155-143 Targeting 178 By earning!One of worst weekly candles and 3 bearish soldiers pattern made it extremely bearish but now entered the demand zone between 155 to 143 expecting accumulation into this range then possible bottom by mid of April then moving higher after earning targeting upper gap but we keep the target more secure by targeting 178 as closing trade. 161-164 is strong resistance . so the idea bye with weakness and accumulate during coming days with stop loss below 140 approx. Earning estimate 1.6 which is a drop from 2.4 last quarter by 30% - P/E at 19.98 EPS at 8.12 - Average analyst rating at 215 (+60$) from last close at 156. these fundamental make this idea is much likely to succeed. Good luck - please like and share . thanks

GOOGL | Long | Strong Fundamentals | (April 2025)GOOGL | Long | Strong Fundamentals + Technical Support | (April 2025)
1️⃣ Insight Summary:
Google (GOOGL) is showing strong fundamental performance with healthy earnings, a growing outlook, and a technically supportive zone. It’s currently sitting at $159, and based on both macro trends and chart structure, there’s potential for a move higher.
2️⃣ Trade Parameters:
Bias: Long
Entry: Around $159
Stop Loss: $140
TP1: $160 ✅ (light partial)
TP2: $200 ✅ (major target)
Ultimate Target: $250 🏁
Partial Exits: 25% at each target level to manage risk and lock in gains.
3️⃣ Key Notes:
🔹 Fundamentals are solid: Google has a net income of $100B and EPS around $8, with a growing outlook.
🔹 Dividend yield is modest at 0.51%, but it's backed by $28B in debt and strong cash flow.
🔹 Technically, GOOGL is trading in a supportive zone and could revisit previous highs around $200+.
🔹 Market cap sits at $2T, showing investor confidence.
🔹 Watch the broader market (e.g., SPX, NQ) for sentiment shifts that could impact tech stocks.
4️⃣ Follow-up:
Will review this trade setup and update if price approaches $200 or reacts at key levels.
Please LIKE 👍, FOLLOW ✅, SHARE 🙌 and COMMENT ✍ if you enjoy this idea! Also share your ideas and charts in the comments section below! This is best way to keep it relevant, support us, keep the content here free and allow the idea to reach as many people as possible.
Disclaimer: This is not a financial advise. Always conduct your own research. This content may include enhancements made using AI.
$GOOGL primed for a BIG MOVE!NASDAQ:GOOGL primed for a BIG MOVE! 🚀
Heading into earnings, this stock’s valuation has been overlooked—but strong results could flip the narrative fast! 💨
✅ Bounced off 2021 highs
✅ RSI at its lowest since COVID
✅ Major indicators curling upward
✅ Volume shelf launch incoming
✅ Wr% pendulum swinging
Momentum is building—are you ready? 👀
Not financial advice

Google - Last earnings call before tariffs affect revenue?Hi guys please find below the analysis we did for Google (ALPHABET)
Alphabet Inc. (NASDAQ: GOOG) is poised to deliver a robust Q1 2025 earnings report, with analysts projecting revenue of $89.22 billion—an 11% year-over-year increase—and net income of $24.71 billion ($2.01 per share), up from $23.66 billion ($1.89 per share) a year ago . This anticipated growth is largely driven by Alphabet's strategic investments in artificial intelligence (AI) and cloud computing, which have bolstered its core businesses, including Google Search and YouTube .
Resilience Amid Tariff Concerns
While recent U.S. tariffs have disrupted global supply chains, particularly affecting hardware-dependent sectors, Alphabet's business model is predominantly digital and service-oriented. Its primary revenue streams—digital advertising, cloud services, and AI-driven platforms—are less susceptible to such trade tensions. Analysts from Citi and Morgan Stanley have expressed confidence in Alphabet's ability to navigate macroeconomic challenges, citing the company's AI-driven innovations as key growth drivers.
General analyst Confidence and Stock Performance
Despite a 20% decline in Alphabet's stock value earlier in 2025, the company's strong fundamentals have led to bullish sentiments among analysts. Price targets have been set as high as $195, suggesting a potential upside of up to 29% from recent levels . The company's continued focus on AI and cloud services positions it well for sustained growth, even amidst global economic uncertainties. In summary, Alphabet's upcoming earnings call is expected to highlight the company's robust performance and resilience, underscoring its ability to thrive despite external economic pressures.
📌 Trade Plan
📈 Entry: 155.41
✅ Target: 181.30
❌ SL: 121
We are looking for +-20% increase in the upcoming days/weeks!

GOOGL Daily Tarde SetupIn this update we review the recent price action and earnings expectations for Alphabet and identify the next high-probability trading opportunities and price objectives to target. To review today's video analysis, click here!

GOOGL: A Resilient Bounce Sets Up the Next WaveGOOGL DAILY TECHNICAL ANALYSIS 📊
OVERALL TREND
📈 UPTREND — Price has rebounded off the April low with increasing bullish pressure, now holding above key short-term moving averages. A potential trend reversal is underway if momentum sustains above 155.
📉RESISTANCE ZONE
🔴 207.05 — PIVOT HIGH | SELL STOPLOSS
🔴 203.76 — SELL ORDER II
🔴 197.10 — SELL ORDER I
🎯ENTRIES & TARGETS
🟢 193.74 — EXIT BUY & TP 4
🟢 181.64 — BUY ORDER & TP 3
🟢 173.79 — BUY ORDER & TP 2
🟢 140.53 — BUY ORDER & TP 1
📈SUPPORT ZONES
🟢 150.92 — BUY ORDER 1
🟢 143.85 — BUY ORDER 2
🟢 207.05 — BUY STOPLOSS | PIVOT LOW
📈MOVING AVERAGE SUMMARY
✅ Short-Term MAs (10–50) — Bullish crossover confirmed, supporting upside
⚠️ Mid-Term MAs (100) — Still bearish, price must sustain above 156.70
🔴 Long-Term MAs (200) — Bearish, still weighing on broader structure
✍️STRUCTURAL NOTES
Price recently flipped bullish across 10–50 SMA/EMA clusters
Volume confirming strength, but needs follow-through above 162.48
Stochastic RSI (95.93) is overheated — expect short-term pullback or consolidation
MACD, Momentum, and AO all signal increasing buy-side control
Ichimoku Base Line (153.25) being tested — reclaiming it is bullish confirmation
TRADE OUTLOOK 🔎
📈 Bullish bias holds above 150.92 and especially above 155.63
🎯 Upside targets: 162.48 → 173.79 → 181.64
📉 Short-term rejection possible near TP1 — RSI and StochRSI nearing exhaustion
👀 Watch for a decisive break above 162.48 with volume for continuation
🧪STRATEGY RECOMMENDATION
CONSERVATIVE (Trend-Following):
— Buy Entry: 155.63
— TP Levels: 162.48 / 173.79 / 181.64
— SL: Below 150.92
HIGH-RISK SCALP (Momentum Pullback):
— Buy Dip: 150.92 or 143.85
— TP: 155.63 / 162.48
— SL: Below 140.35
“Discipline | Consistency | PAY-tience”

GOOGL - Melt up & Crash series [5 - Final]Not financial advice.
I believe this is it.
Not financial advice

Alphabet (GOOGL) Shares Hover Near Psychological LevelAlphabet (GOOGL) Shares Hover Near Psychological Level Ahead of Earnings Report
On 31 March, we noted that bearish sentiment could push Alphabet’s (GOOGL) share price towards the psychological level of $150. As the current price chart suggests, GOOGL is now trading close to that very level.
Moreover, the price is approximately equidistant from the recent highs and lows (marked A and B), which may be interpreted as a sign of balanced supply and demand — and a wait-and-see stance from market participants ahead of Alphabet’s Q1 earnings release (scheduled for tomorrow, 24 April).
Awaiting the GOOGL Earnings Report
With the Nasdaq 100 index (US Tech 100 mini on FXOpen) having fallen by around 13.5% since the beginning of the year, investors are approaching tech earnings with caution. According to Barron’s, three key themes are expected to dominate the narrative:
→ management forecasts amid continued uncertainty around the White House’s tariff policy;
→ plans for major capital investment in AI-related infrastructure;
→ signs of softening consumer demand.
Given the current climate of uncertainty, Alphabet’s earnings report could prove particularly influential — serving as a benchmark for shaping market expectations ahead of other major tech company reports.
Technical Analysis of Alphabet (GOOGL)
The $150 level has served as key support throughout 2024, and over the coming days it may act as a springboard for a new price movement, potentially driven by the earnings results.
From a bearish perspective, the market remains in a downward trend (indicated in red) following a breakout below the lower boundary of a previously active rising channel (marked in purple) that had held since last autumn. However, if Alphabet’s management maintains an upbeat outlook for 2025, this could give the bulls the confidence to challenge the upper limit of the red channel.
This article represents the opinion of the Companies operating under the FXOpen brand only. It is not to be construed as an offer, solicitation, or recommendation with respect to products and services provided by the Companies operating under the FXOpen brand, nor is it to be considered financial advice.

GOOGL Coiling for a Breakout? Gamma Walls Say 160+ in Sight 🔍 GEX & Options Flow Insights
GOOGL is setting up for a potential gamma squeeze. The current price is inching just below a critical gamma transition zone between 155–160, where we see:
* High GEX levels stacked at 159.5 and 162.5 (73% and 70% respectively)
* Call Wall alignment across 159–165 levels — dealers may be forced to buy to hedge if we break 155
* HVL (High Volume Level) sits at 148 — marking key put support and invalidation
IVR is 60.5, which shows there’s still premium left to be sold — but it’s not overpriced. That’s a great environment for directional call spreads with gamma flow support.
💡 My Options Strategy Idea (Bullish Bias):
* Play: Bull Call Spread – Buy 155c / Sell 160c
* Rationale:
1. Risk is capped and affordable
2. Profit range aligns perfectly with GEX targets
3. The spread benefits if dealers fuel a move toward gamma wall pressure zones
The GEX landscape suggests upward dealer flows, not resistance, as long as we stay above 152.5–155.
📊 Smart Money Technical View
From a price action perspective, GOOGL has flipped bullish after reclaiming the CHoCH zone. We’re hovering just beneath the key breakout level.
* Trend Bias: Strong Bullish on 30m and 1h
* Volume Note: Very thin (0.04x) — price is rising, but it needs conviction candles soon
* Structure: Bullish CHoCH formed → BOS confirmed → Setup forming
* Target 1: 159.54 (aligned with GEX #1 wall)
* Target 2: 164.31 (near GEX #2 zone)
* Stop: 150 (under structure + below HVL)
🎯 What I’m Watching for Trade Confirmation:
* Hold above 152.5 = bullish continuation
* Break and close above 155 with volume = BOS confirmed → RUNNER potential
* Fade or stall below 151 = caution — wait for re-entry
🧠 My Thoughts & Why This Setup Matters
This is one of those setups where both the options market and smart money price structure are talking the same language — bullish, but not impulsive yet.
What makes it powerful is the layered confluence:
* Dealer gamma exposure creates a pull toward 159.5–162.5
* The technicals show a textbook CHoCH and BOS pattern
* The entry risk is defined, the structure is clean, and volume is the only missing ingredient
If we get confirmation through volume and momentum, GOOGL could become a high R/R long into the end of the week, especially if the market holds up.
📌 Final Summary:
* Direction: Bullish Bias
* Options Strategy: 155c/160c Call Spread targeting 159.5–162.5
* Entry Trigger: BOS above 155 with volume
* Risk Zone: Below 151–150 (HVL + SL)
Let price and flow confirm. This one could rip with the right spark.
⚠️ Disclaimer
This analysis is for educational purposes only and not financial advice. Always do your own due diligence. Manage risk and never trade based solely on external suggestions.

GOOG Alphabet Options Ahead of EarningsIf you haven`t bought GOOG before the previous rally:
Now analyzing the options chain and the chart patterns of GOOG Alphabet prior to the earnings report this week,
I would consider purchasing the 170usd strike price Calls with
an expiration date of 2025-7-18,
for a premium of approximately $4.35.
If these options prove to be profitable prior to the earnings release, I would sell at least half of them.

GOOGL 1H Swing Long Conservative Trend TradeConservative Trend Trade
+ long impulse
+ 1H / 1D level coincide
+ T2 level
+ support level
+ biggest volume 2Sp-
Calculated stop limit
1 to 2 R/R take profit
Daily Trend
"+ long impulse
+ JOC test / T2 level
+ support level
+ 1/2 correction"
Monthly Trend
"+ long impulse
+ T2 level
+ support level
- before 1/2 correction"
Yearly Trend
"+ long impulse
- T1 level
- resistance level"
