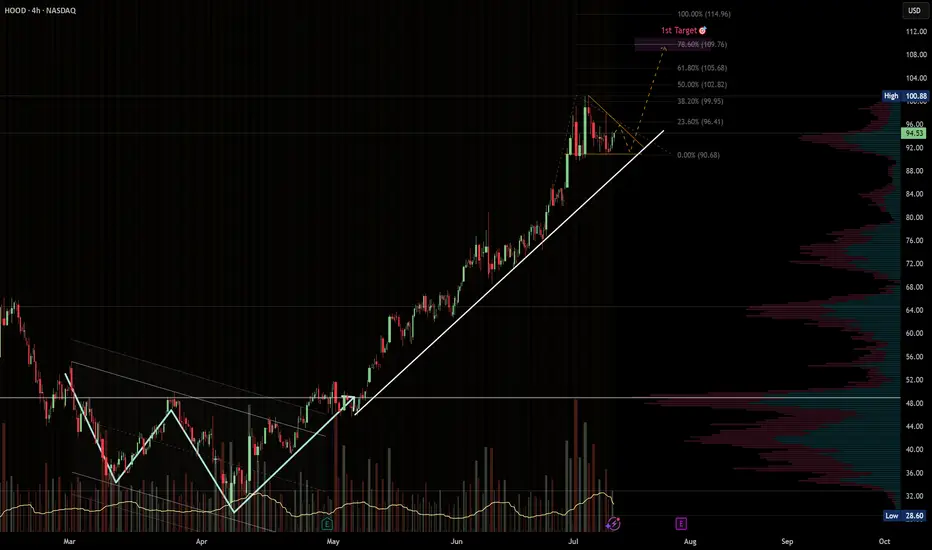
HOOD · 4H — Bullish Continuation Setup Targeting $109 → $115Pattern Overview
HOOD has been riding a strong ascending trendline since early May, respecting higher highs and higher lows all the way up.
After the most recent parabolic move from ~$90 to ~$101, price is now consolidating in a bullish pennant, just above key fib levels.
The setup looks primed for continuation if we see a breakout above $101 with confirming volume.
---
🎯 Target Zones
🎯 Target Level Why It Matters
Target 1 $109.76 78.6% Fibonacci extension from the previous leg. Common spot for intermediate take-profit. Also matches a soft VPVR resistance area.
Target 2 $114.96 100% measured-move projection of the prior rally. If momentum accelerates, this becomes a realistic stretch zone.
---
🛠️ Trade Plan (Example)
Component Level
Trigger Break and hold above $101 with volume ≥ 20-SMA.
Add-on Opportunity Pullback into $96–97 that respects the rising trendline.
Stop-loss Close < $92.5 invalidates trendline.
TP-1 $109–110 — take partials, move stop to breakeven.
TP-2 $114–115 — full exit or runner trail zone.
---
⚠️ Risk Notes
Watch for false breakouts — confirmation needs volume and price stability above $101.
Earnings or macro news could override technicals. Use tighter stops ahead of event dates.
If trendline fails, next key support sits at $89–90 (previous consolidation base).
---
✅ Trade Checklist
Bullish trendline intact
Continuation pennant forming
Fib & measured move confluence at $109–115
Volume profile supports clean move above $101
Clear invalidation under $92
> Disclaimer: This is not financial advice. Always trade your own plan and manage risk appropriately.
4HOOD trade ideas
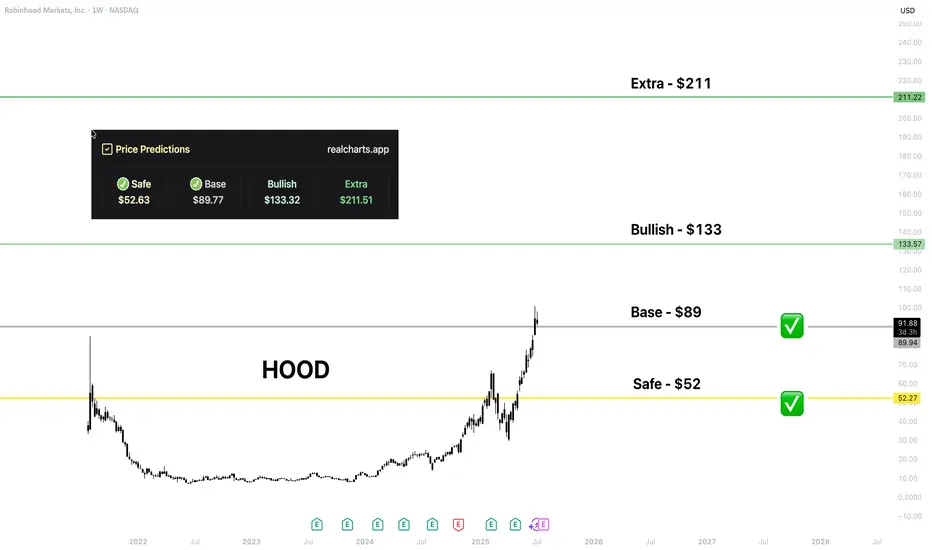
HOOD | Price PredictionI love that NASDAQ:HOOD has made a huge step in crypto integration.
That level is from my platform. I hope HOOD holders would be happy to get every level; time will show!
$BULL from $HOOD charting for maximum gains. 50$ reclaim this is a great risk to take here and i beleive can benefit alot of beginner traders to increase there first bag!
bag dad

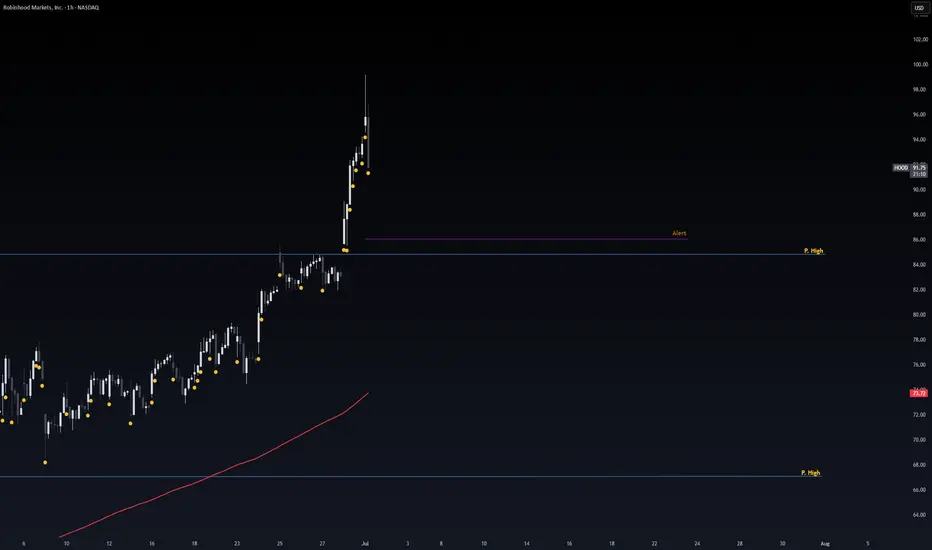
Safe Entry Zone HOODP.High (Previous High) Act as good support level.
Waiting for Buying Power to Stepin at P.High Line.
Note: 1- Potentional of Strong Buying Zone:
We have two scenarios must happen at The Mentioned Zone:
Scenarios One: strong buying volume with reversal Candle.
Scenarios Two: Fake Break-Out of The Buying Zone.
Both indicate buyers stepping in strongly. NEVER Join in unless one showed up.
2- How to Buy Stock:
On 1H TF when Marubozu/PinBar Candle show up which indicate strong buyers stepping-in.
Buy on 0.5 Fibo Level of the Marubozu Candle, because price will always and always re-test the imbalance.
Short Trade Idea: HOOD (Robinhood Markets, Inc.)🧠
📅 Timeframe: 30-Minute
💼 Type: Short Position
📉 Setup: Triangle breakdown + Resistance rejection
📍 Trade Details:
Entry: $92.33 (bearish rejection candle at resistance + lower trendline break)
Stop Loss: $95.33 (above local high & upper trendline)
Target 1: $89.47 (previous support level)
Target 2: $86.64 (mid-support zone)
Target 3: $83.89 (key horizontal support)
Extended Target: $81.66 (major support from breakout zone)
🔎 Technical Breakdown:
Price formed a rising wedge/triangle and broke the lower trendline
After rejecting $95+ zone, it failed to hold above yellow resistance line
Bearish engulfing + retest of broken support confirms downside pressure
Momentum fading after a strong uptrend – ideal for a reversal trade
🎯 Risk/Reward Outlook:
RR Ratio: Favorable (min 2:1+ depending on targets)
Good structure for tight risk and wide target zone

VLAD impaling WALL ST!I believe Robinhood will achieve over One Trillion dollars in assets in very short order.
Giant Cup and Handle is your technical setup.
(I have covered hood at the low)

HOOD Got away #2I swear man, I said anything under 10 and I was loading up..... I did start but then I went all in on NASDAQ:TSLA and here she is another 10 bagger has come and gone. Lesson is Diversify, well sorta. If there's not catalyst for other stonks making big moves then put some here and there. I'm going to buy into this again in the future it's growing like a mofo.

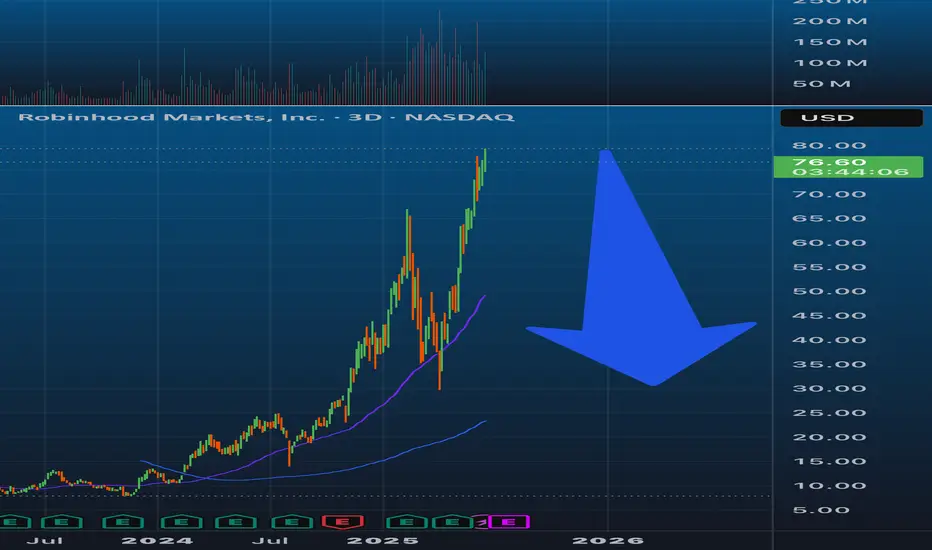
ROBINHOOD: from meme stock to margin call. ROBINHOOD: from meme stock to margin call. Parabolic moves end the same way — vertical down. Retail about to learn what “liquidity event” really means. Enjoy the round trip 📉
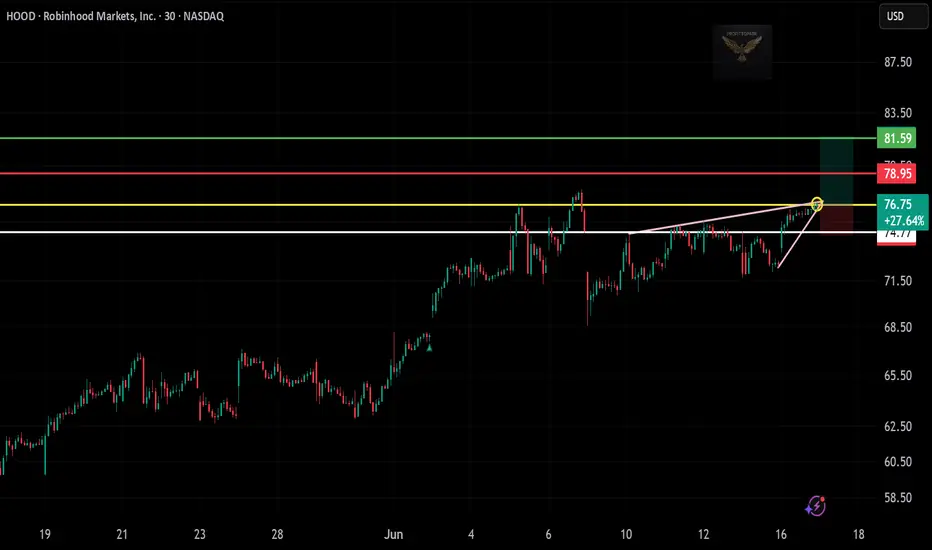
HOOD – Long Trade Setup!📈
🔍 Pattern: Ascending triangle breakout
📍 Entry: $76.75 (breakout candle confirmation)
🎯 Target: $81.59 (green resistance zone)
🛑 Stop-loss: $74.77 (below support trendline)
✅ Why this setup?
Clean breakout from multi-week consolidation
High volume push through resistance zone
Tight risk with large upside target
Strong bullish trend continuation
📊 Timeframe: 30-min chart
📈 Bias: Long / Momentum breakout
Time to take profits on Robinhood, it's extremely overboughtit's just about time for profit taking with summer here. Aiming for around $45-50 prior resistance turns to support, to buy back in at the 0.618 golden fib level as well.

Trump’s $1,000 baby accounts: what it means for markets President Trump’s “Trump Accounts” proposal would give every American newborn a $1,000 investment account placed in a stock market index fund, managed by the child’s guardians. The plan is part of the Big Beautiful Bill and has support from CEOs including Nvidia’s Jensen Huang, who called it “a seed fund for America’s next generation.”
If passed, the plan could drive consistent inflows into U.S. equity markets and benefit platforms like Robinhood, Vanguard, and BlackRock. Robinhood’s CEO will attend the White House event announcing the plan.
Robinhood shares are trading near multi-year highs, boosted by strong earnings and the acquisition of crypto exchange Bitstamp.
Shares also rallied recently on hopes the company would be added to the S&P 500, an inclusion that typically attracts passive fund inflows. While it wasn’t selected in the latest rebalancing, continued growth keeps it on watch for future inclusion.

HOOD (Robinhood) - Price Above Bollinger Band and Shooting StarsHOOD (Robinhood) stock price has been in an uptrend since May 2025.
Recent fundamentals such as corporate earnings, EPS, Revenue, Acquisitions have been good in Q2 2025.
However currently, HOOD price has printed 2 shooting stars above the upper bollinger band and linear regression lines (blue arrow).
Potential selling and profit-taking could occur, especially if there is a significant bearish catalyst or news in the stock market.
A -4% or -8% move selloff could occur over time if the price gaps up to an overextended level too fast, such as $80 to $85.
Both the weekly and daily charts are starting to show bearish divergence so I am watching both the technicals and fundamentals this month.

Doji on top of the hillDoji on top of the hill — on the daily chart, we observe a doji candle printed at the top of a strong uptrend, situated in a heavily overbought zone, as confirmed by both RSI and Stochastic RSI. This suggests potential for a pullback. If price moves below $73.21 with strong volume and conviction, the decline may extend to $72.07 (structural CHoCH) and possibly to the $68 support area. On the other hand, if price breaks above $78 with strong bullish momentum, we could see continuation toward the $84 resistance zone. Traders should remain cautious and watch for fakeouts, especially within this tight range and at key breakout levels."

HOOD Swing Trade Plan – 2025-06-06🚀 HOOD Swing Trade Plan – 2025-06-06
Bias: Bullish (High Momentum + Catalyst)
Timeframe: 5–10 days
Catalyst: S&P 500 inclusion speculation, crypto rally, retail momentum
Trade Type: High-conviction naked call option
🧠 Model Summary Table
Model Direction Strike Entry Price Target(s) Stop Confidence
Grok Strongly Bullish $80 $3.90 +100% -50% 85%
Claude Moderately Bullish $78 $4.67 +50–150% -40% 75%
Llama Moderately Bullish $80 ~$3.85 $5.00+ < $75 or -50% 80%
Gemini Strongly Bullish $80 ~$3.88 $5.00 / $7.00+ < $75 or -50% 70%
DeepSeek Moderately Bearish $70 PUT $1.70 $2.50 / $3.40 > $79.17 or -50% 75%
✅ Consensus: Strong bullish trend supported by technicals and macro catalysts
⚠️ Bearish Divergence: DeepSeek warns of exhaustion risk
📈 Technical & Sentiment Summary
Price Action: Trading above all EMAs; price extended above upper Bollinger Bands
RSI: Extreme overbought across daily timeframes (RSI > 80)
MACD: Strongly positive on all models (15m, daily, weekly)
Sentiment: Positive S&P 500 inclusion buzz, retail FOMO, and crypto tailwinds
VIX: Falling → favorable for long calls
Max Pain: $66 (could cause pull later in expiry week)
✅ Final Trade Setup
Parameter Value
Instrument HOOD
Direction CALL (LONG)
Strike $80.00
Expiry 2025-06-20
Entry Price $3.90
Profit Target $5.85 (50% gain)
Stop Loss $1.95 (50% loss) or HOOD < $75
Size 1 contract
Entry Timing At market open
Confidence 75%
💡 Rationale: Aligns with dominant trend and event-driven momentum. Best R/R with defined risk on extreme FOMO move.
⚠️ Risks & Trade Watchouts
RSI overbought → any market pullback could hit stop quickly
S&P inclusion may trigger “sell the news” reaction
Theta decay risk intensifies late next week
Max pain at $66 could drag prices if momentum fades mid-week
RobinHood - Urgent News - Afterhours SelloffOn June 6, 2025, S&P Dow Jones Indices announced no changes to the S&P 500 index in its quarterly rebalance, marking the first such instance since March 2022. This decision notably excluded Robinhood Markets Inc., despite speculation that it might be included due to its market capitalization exceeding $20.5 billion and recent strong performance. Following the announcement, Robinhood's stock declined over 5% in after-hours trading
The next S&P500 quarterly rebalancing is set for September 2025....perhaps the next leg higher needs to wait until them
As of June 6, market close, Robinhood's stock is trading at $74.88, with a market capitalization of approximately $36.85 billion. The company has experienced significant growth, with a 365% increase in stock price over the past 12 months and a 50% surge to start 2025. Analysts project continued revenue and earnings growth, with an average one-year price target of $51.19 per share
We issued put option alerts to our members and shorted this live stream on Friday afternoon.

Why is ROBINHOOD dropping in afterhours? Robinhood's stock (HOOD) is dropping in after-hours trading due to several factors:
1. Regulatory Scrutiny: The company is facing increased attention from regulators, particularly regarding its expansion into unconventional financial offerings like sports betting-related features.
2. Analyst Downgrade: Wolfe Research recently downgraded Robinhood's stock from "Buy" to "Hold," citing valuation concerns and suggesting that the stock's upside potential has already been priced in.
3. Competitive Pressure: Traditional banks and fintech startups are ramping up their offerings, making it harder for Robinhood to maintain its market dominance.
4 Investor Uncertainty: Some investors are skeptical about Robinhood's new ventures, such as its push into banking services and prediction markets, which blur the lines between trading and gambling.
5. Technical Resistance: A clear parallel channel is bringing Hood back to planet earth. This stock has had a 160% run with minimal pullback, profit taking is highly likely.

Why is HOOD still 1/3rd of SCHW? Wealth management remains the last bastion of success for Charles Schwab. Long-term cash, mutual fund, and retirement accounts create an enormous balance sheet, which accures value and reduces fees across the board. I'm hard pressed to see however how NASDAQ:HOOD will not inherit that class of customers as baby boomers pass on their generational wealth to the millenial generation. Do we begin to see a transition of assets from megacaps like NYSE:SCHW in the next 24 - 36 months? I'd say most likely.

$hood is challenging AH!If hood manages to break previous ATH, it will gap up to the 1.272. I seea big target of the next golden ratio at 1.618.

HOOD watch $75: Golden Genesis + Local fib zone may cause a DipHOOD has been flying from various company news.
Just hit a Golden Genesis zone at $74.65-75.09
Look for a Dip-to-Fib or Break-n-Retest for entries.
.
See "Related Publications" for previous EXACT plots ------------->>>>
.

HOOD Weekly Options Outlook — June 3, 2025📈 HOOD Weekly Options Outlook — June 3, 2025
🚨 AI Model Consensus: Moderately Bullish Into June 6 Expiry
🧠 Model Summary
🔹 Grok (xAI)
Bias: Moderately Bullish
Setup: Near 10 EMA, RSI oversold (34.7), strong 5-min EMA alignment.
Trade: Buy $72C @ $0.78 → PT +50%, SL −20%
🔹 Claude (Anthropic)
Bias: Moderately Bearish
Setup: Price below M5 10 EMA, high sell volume; RSI overbought daily.
Trade: Buy $69P @ $2.63 → PT +50%, SL −30%
🔹 Llama (Meta)
Bias: Moderately Bullish
Setup: RSI oversold (5-min), MACD mixed; Daily RSI high.
Trade: Buy $73C @ $0.60 → PT $0.90, SL $0.30
🔹 Gemini (Google)
Bias: Moderately Bullish
Setup: RSI oversold intraday; resistance near $73.15
Trade: Buy $74C @ $0.44 → PT $0.80–0.88, SL $0.22 or below $71
🔹 DeepSeek
Bias: Moderately Bullish
Setup: Oversold bounce potential in strong trend
Trade: Buy $73C @ $0.60 → PT $0.90–1.20, SL $0.30
✅ Consensus Summary
📈 Daily uptrend remains strong across all models
📉 Short-term RSI is oversold → bounce setup likely
📰 Bullish news + falling VIX = supportive backdrop
🧲 Max Pain @ $65 = caution for Friday pin
4 out of 5 models favor bullish call plays
🎯 Recommended Trade Setup
💡 Strategy: Bullish Naked Weekly Call
🔘 Ticker: HOOD
📈 Direction: CALL
🎯 Strike: $73
💵 Entry: $0.60 (limit order suggested)
🎯 Profit Target: $0.90 (+50%)
🛑 Stop Loss: $0.30 (−50%)
📏 Size: 1 contract
📅 Expiry: 2025-06-06
⏰ Entry Timing: Market Open
📈 Confidence: 70%
⚠️ Risk Factors to Watch
📉 Daily RSI >79 = potential for broader pullback
🔄 Max Pain @ $65 could act as drag near expiration
📉 Break below $71.10 invalidates bullish thesis
⌛ Theta decay accelerates after Wednesday

HOOD updateBeautiful weekly cup and handle breakout on $HOOD. With the potential inclusion into the S&P 500 on Friday, we could see price hit IPO high and possibly make new highs before it pulls back. PT $85

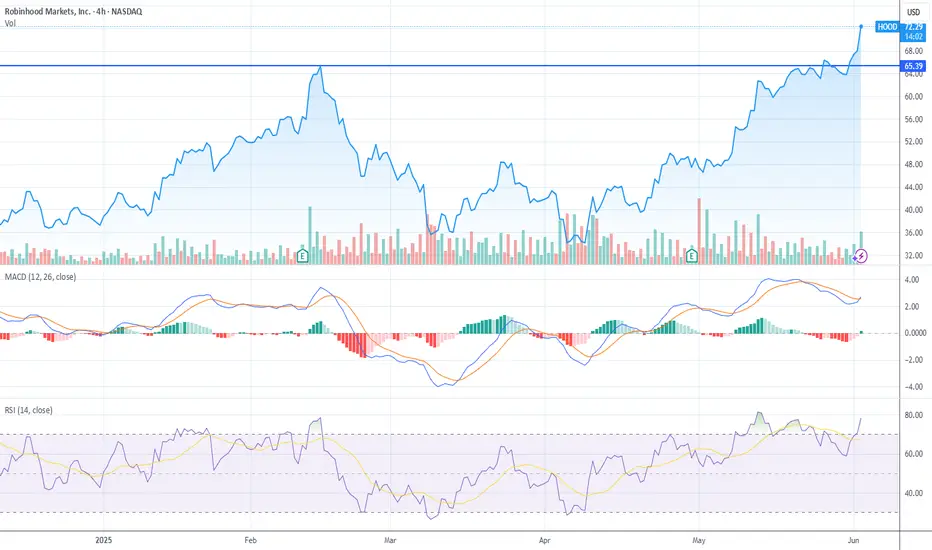
HOOD Breaks Out: Eyes on $84–95 as Momentum Surges Above $70If HOOD holds above $70, momentum can carry it to $84–85 in the short term, and as high as $95 if the rally becomes euphoric — but any breakdown below $70 likely resets the move.
1. Price Action – Clean Breakout
Price surged above a major resistance level around $65.39, which had previously capped price in late March. The breakout candle is strong, impulsive, and supported by volume, suggesting institutional follow-through.
2. RSI – Overbought Territory
RSI is 78.06, a red flag for short-term exhaustion. While strong trends can keep RSI over 70 for extended periods, moves like this often lead to:
Sideways digestion
Quick shakeouts
Potential for bearish divergence if price pushes higher but RSI rolls over
3. MACD – Elevated and Peaking
MACD lines are still bullishly stacked, but the histogram is flattening. We may be nearing a momentum apex — any softness in price could trigger a MACD rollover, especially on this lower timeframe.
4. Volume – Legitimate Strength
Volume on this breakout is clearly elevated, which confirms this is not a false move — at least not yet. Buyers are showing up, and that raises the bar for sellers to reclaim control.
Summary: Breakout Confirmed, But Cooling Risk Rising
HOOD has launched through resistance with conviction, but both RSI and MACD suggest this leg may be nearing exhaustion — watch for follow-through or failure in the next two sessions.
Where can this go?
Fibonacci Extension (From March Low to May High)
Using:
Swing low (March): ~$35
Swing high (May): ~$65.39
Pullback low (May 23rd): ~$60
Fib Extensions from this leg:
1.0x = $65.39 (already cleared)
1.618 = ~$84.27
2.0 = ~$95.39
That gives us a confluence zone at:
$84–85 (1.618 Fib + Measured Move)
$95–96 (2.0 Fib — extended run)
Bullish on this one
Robinhood, Breakout
Uptrend
A strong resistance level at approximately 67, which also called an all-time high, has now been broken after about 12 days by a good bullish candle. While some traders are initiating long positions immediately, others are waiting for further confirmation above this level. More conservative traders might prefer to wait for a pullback to broken level before entering. Overall, I anticipate a mid-term target of around 80-82. It's crucial to emphasize the importance of setting a firm stop-loss for your position; I recommend approximately $62.
Good luck.
