IBM -ready to make another move towards all time highsIBM - Stock another strong move on the weekly time frame towards all time highs. looking for calls above $255 for a move towards $260 and higher. Stock is decent on the indicators. if $260 breaks looking for $275 and $290
4IBM trade ideas

3 Reasons Why This Stock Is A Good BuyWhen you look at this stock you will
notice the rocket booster strategy.
So you may be thinking what is the rocket
booster strategy?
The rocket booster strategy has 3 steps
and their as follows:
The price should be above the 50 Day Moving Average
The price should be above the 200 Day Moving Average
The price should Gap up
This is what you see happening on this chart NYSE:IBM
right now.
Remember to be careful and ideally
dont use margin.
Rocket boost this content to learn more
Disclaimer: Trading is risky please use risk management
and profit taking strategies to protect your capital.
Also feel free to use a simulation trading account before you use
real money.

IBM leads the investment push in the USABy Ion Jauregui – Analyst at ActivTrades
IBM (NYSE: IBM) has announced an ambitious investment of $150 billion in the United States over the next five years, aiming to strengthen its position in the development of quantum computers, mainframes, and critical infrastructure technologies. This strategic decision comes at a key moment when the U.S. technology sector is repositioning itself as a global innovation engine.
This announcement adds to the recent commitment by giants such as Nvidia (NASDAQ: NVDA) and Apple (NASDAQ: AAPL), which have jointly pledged over $500 billion in investments, consolidating an unprecedented wave of technological spending. The move not only reflects confidence in the sector's potential but also responds to the current geopolitical context, which is driving the relocation of strategic capabilities to U.S. soil.
Recent Financial Results of IBM
In the first quarter of 2025, IBM reported revenues of $14.54 billion, exceeding analysts’ expectations. The company posted adjusted earnings per share of $1.60, although this represented a 5% decrease compared to the previous year. The software division showed 7% growth, reaching $6.34 billion, while the consulting and infrastructure units experienced revenue declines.
Despite macroeconomic challenges and reductions in government contracts, IBM maintains its revenue growth forecast of at least 5% for 2025 and expects to generate free cash flow of approximately $13.5 billion.
IBM Analysis
At market close on April 29, 2025, IBM shares were trading at $246.95, representing a 2.38% decrease from the previous day. However, over the past year, shares have shown a positive trend, rising by 22%, reflecting investors' confidence in the company’s long-term strategy. Since May 2023, the stock has been trending upward in a sequence closely aligned with its quarterly earnings releases.
In the most recent cycle since March, combined with the U.S. tariff situation—which has significantly affected IBM—the share price dropped to $214.50, after which a strong support zone was established at that level. Currently, moving average crossovers indicate an intersection between the 50-day and 100-day moving averages, suggesting the price could return toward $222.49, slightly below the 38.20% level ($234.34), with the mid-zone around $240.48. This level coincides with previous resistances, now acting as support.
Currently, the Point of Control (POC) is located around $185, well below the current trading zone and the last impulse area. The RSI is at 49.91%, slightly oversold, which could lead to an upward price movement if quarterly results prove positive—as seen on previous occasions.
Impact on the S&P 500 and Outlook
The market reaction has been swift. The S&P 500 index, where IBM is a historic component, could benefit indirectly from this renewed investment momentum. Although IBM has not had the market spotlight of its more modern peers, its focus on high-value technologies such as quantum computing could lead to a progressive revaluation of its shares and support diversification within the index.
In an environment driven by artificial intelligence, semiconductors, and technological autonomy, IBM wants to make it clear that it remains in the game. Its bold move not only reinforces its role in the digital ecosystem but also underscores the renewed dynamism of the technology sector within the S&P 500.
*******************************************************************************************
The information provided does not constitute investment research. The material has not been prepared in accordance with the legal requirements designed to promote the independence of investment research and such should be considered a marketing communication.
All information has been prepared by ActivTrades ("AT"). The information does not contain a record of AT's prices, or an offer of or solicitation for a transaction in any financial instrument. No representation or warranty is given as to the accuracy or completeness of this information.
Any material provided does not have regard to the specific investment objective and financial situation of any person who may receive it. Past performance is not reliable indicator of future performance. AT provides an execution-only service. Consequently, any person acting on the information provided does so at their own risk.

Breaking: International Business Machine (NYSE: $IBM) Tanks 6% International Business Machine Corporation, (NYSE: NYSE:IBM ) together with its subsidiaries, provides integrated solutions and services in the United States, Europe, the Middle East, Africa, Asia Pacific, and internationally Plummets 6% in early premarket trading on Thursday albeit reporting better-than-expected earnings and revenue for the first quarter on Wednesday.
Earnings Overview
a. Earnings per share: $1.60 adjusted vs. $1.40 expected
b. Revenue: $14.54 billion vs. $14.4 billion expected
Revenue increased 0.6% in the quarter from $14.5 billion a year earlier, according to a statement. Net income slid to $1.06 billion, or $1.12 per share, from $1.61 billion, or $1.72 per share, in the same quarter a year ago.
For 2025, IBM reiterated its expectation for $13.5 billion in free cash flow and at least 5% revenue growth at constant currency. At current exchange rates, currency will provide 150 basis points of benefit for 2025 growth, down from the company’s forecast of 200 basis points in January.
IBM has been an outperformer this year as the broader market has sold off due largely to concerns around President Donald Trump’s tariffs and their potential impact on the economy. As of Wednesday’s close, IBM shares were up 11%, while the Nasdaq was down almost 14%.
The stock slipped 6% in extended trading on Wednesday, extending the loss to Thursday's premarket session. NYSE:IBM shares need to break pass the $266 resistant to negate any bearish barriers. Failure to break pass this level could resort to consolidatory move to the $216 support point.
IBM Share Price Falls Following Earnings ReportIBM Share Price Falls Following Earnings Report
Yesterday, after the close of the main trading session, International Business Machines (IBM) released its Q1 earnings report, exceeding Wall Street analysts’ expectations in several key areas. According to FactSet:
→ Earnings per share came in at $1.60 (forecast = $1.42), although this was below last year’s figure of $1.68.
→ Quarterly revenue reached $14.54 billion (forecast = $14.39 billion), marking a 1% increase year-on-year.
Initially, IBM shares rose on the news, but then dropped by approximately 6% during after-hours trading, according to Google Finance.
This suggests that today’s trading session may see IBM shares open below the $230 mark.
Market participants may have been disappointed by the following:
→ IBM’s mainframe business (large-scale computing systems designed for high-volume data processing) continued its decline, falling by 6% year-on-year.
→ Revenue from software and consulting divisions increased, but only by 3% compared to the same period last year.
→ The revenue forecast for Q2 stands at $6.6 billion – a 3% decline relative to the same quarter in 2024.
Technical Analysis of IBM Share Price
The chart shows signs of seller activity above the psychological level of $250. As indicated by the arrows, the price attempted several rallies above this level with varying momentum, but each time retreated back.
At the same time, price fluctuations formed a downward channel, which was extended to the downside in early April amid news regarding new tariffs in international trade.
Price stabilisation observed between 15–17 April suggests that supply and demand were temporarily balanced ahead of the earnings release. However, the negative market reaction to the report may shift sentiment and act as a catalyst for further price movement towards the lower boundary of the channel, around the key support level of $215.
This article represents the opinion of the Companies operating under the FXOpen brand only. It is not to be construed as an offer, solicitation, or recommendation with respect to products and services provided by the Companies operating under the FXOpen brand, nor is it to be considered financial advice.

IBM Earnings PlayTechnical Analysis NYSE:IBM
On the 4-hour chart, IBM’s stock price is currently trading at approximately $260.50. Applying Bollinger Bands, the price is hovering near the 20-period moving average, with the bands moderately contracted, indicating relatively low volatility. The stock has shown resilience above the lower Bollinger Band, suggesting potential for an upward move if bullish momentum builds post-earnings. A recent green candle indicates buying interest, but the stock remains below the upper band, which sits near $270.00, signaling room for upside if catalysts align.
Target
Wait for bullish confirmation post-earnings.
Entry LONG : Around $262.00, Targeting $270.00.
Secondary Target: $275.00.
Resistance Levels: $265.00, $270.00, $275.00.
Support Levels: $255.00, $250.00, $245.00.
The price is testing the 20-period moving average, and a strong earnings report—particularly with positive AI or cloud revenue updates—could push the stock toward the upper Bollinger Band at $270.00 or higher. Conversely, a disappointing earnings report or weak guidance could see the price drop toward $255.00 or lower, especially if broader market conditions weaken.
QuantSignals
Best AI news analysis and signals

IBM - Move Up to Trend LineTrend Line in green shows a place where price likes to move along
Right now price is under this line, and looking to move back up towards the line for another test
The smaller structure to the left is very similar to the one we are experiencing now hence why I have made this comparison with the bars pattern tool
Bullish up towards the Green solid line on this Weekly timeframe

$IBM $250 retestNYSE:IBM Looking for a resistance zone tap of a retest. Earnings is a week and a half away as well which could score you some premium; wouldn't hold into earnings (craps shoot). Want to see a strong test on $240 then could see a boost to $248-$250 before earnings.
WSL.

IBM eyes on $230: key support to hold for Tariff Relief bounce IBM got a cautious bounce from the Trump pivot.
Looks like a successful retest of first support zone.
Now looking for continuation of the recovery process.
$ 230.71 - 231.24 is the exact support zone to hold.

The 3 Steps System Called "The Rocket Booster Strategy"Yesterday I took a long walk and i thought about you.
Because I want to help you learn how to trade.
Look at this chart in order to find this chart I used the rocket booster strategy.
What is the rocket booster strategy?
Yesterday I took a long walk and i thought about you.
Because I want to help you learn how to trade.
Look at this chart in order to find this chart I used the rocket booster strategy.
What is the rocket booster strategy?
It has 3 Steps:
#1-Price has to be above the 50 EMA
#2-Price has to be above the 200 EMA
#3-Price has to Gap up
These shows you a strong uptrend on the week and on the day ratings.
Also considering the oscillator
Should give you a sell signal on your *New* TradingView screener.
But this has to be on a daily chart.
But one last step.
The MACD signal line (blue) Should be below the MACD level line (orange).
This gives you a red bar below the zero line.
If you don't understand this don't worry I will make video for you next time.
For now understanding the technical terms
Including the Rocket Booster Strategy is the key.
Learn more rocket boost this content
Disclaimer ⚠️ Trading is risky please learn Risk Management And Profit Taking Strategies. Also feel free to use a simulation trading account before you use real money.

What makes a good moving average?Four Core Qualities of Superior Moving Average
Accuracy (preserving large-scale structure):
Moving average should maintain the important underlying structure of price movements (like major trends and cycles) while filtering out all smaller fluctuations; it should faithfully represent the true price trajectory over longer timeframes.
Timeliness (minimal lag):
Most moving averages lag behind price action - they indicate changes way after they've already happened. A good moving average minimizes this lag, responding quickly to genuine price movements without sacrificing other qualities, providing more actionable signals and earlier entries/exits.
Minimal overshoot:
Overshoot occurs when a highly reactive moving average extends beyond the actual price extremes, creating false impressions of price levels never reached. TEMA, DEMA and HMA are examples of overshooting moving averages; good moving average should avoid this distortion, particularly during price reversals, preventing false triggers when used with threshold-based systems.
Smoothness (reduced noise):
A quality moving average filters out random price fluctuations (noise) that don't represent meaningful market activity, especially in steady non-volatile periods. This creates a clean, smooth line that clearly shows the underlying price direction without the jagged, erratic movements that could trigger false signals.
The Dynamic Adaptive Moving Average
Picture shows a study of Dynamic Adaptive Moving Average that employs a complex approach to price smoothing that continuously adjusts its behavior based on real-time market conditions. At its core, this indicator uses the ratio between short-term True Range and longer-term ATR to measure relative volatility changes in the market. This volatility assessment drives the automatic adjustment of critical smoothing parameters through calibrated sigmoid functions, allowing the indicator to become more responsive during volatile periods and more stable during consolidation.
Smoothing is achieved with three-stage filtering process: the first stage applies preliminary smoothing using self-adjusted adaptive exponential moving average. The second stage implements a Kalman filter that provides further smoothing while maintaining responsiveness to price spikes. The final stage applies another adaptive filter that balances smoothness and lag reduction.
The study shows comparison between HMA indicator and a working model of Dynamic Adaptive Moving Average.

IBM Wave Analysis – 20 March 2025
- IBM reversed from support zone
- Likely to rise to resistance level 253.00
IBM recently reversed up from the support zone between the pivotal support level 240.00 (former multi-month high from December), lower daily Bollinger Band and the 38.2% Fibonacci correction of the upward impulse from November.
The upward reversal from this support zone will likely form the daily Japanese candlesticks reversal pattern Long-legged Doji – strong buy signal for IBM.
Given the clear daily uptrend, IBM can be expected to rise to the next resistance level 253.00 (which reversed the price twice earlier this month).

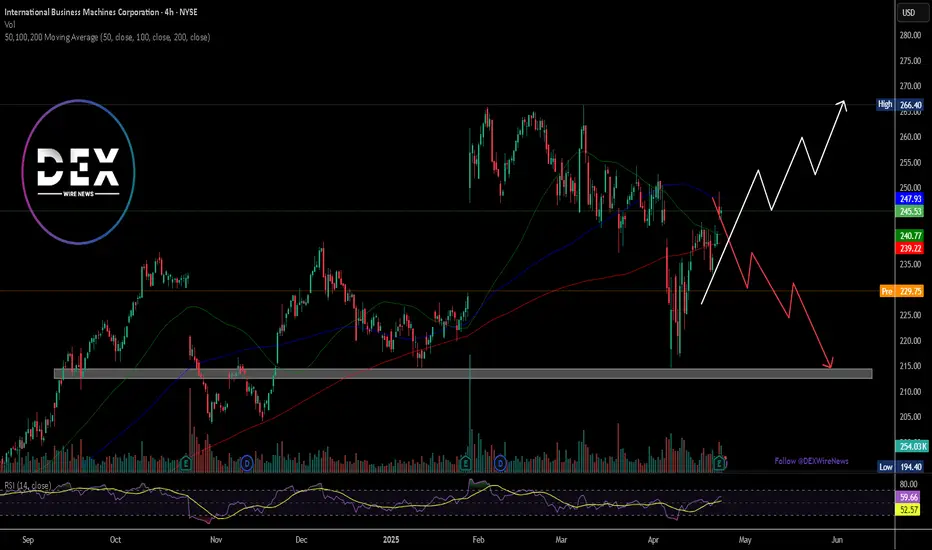
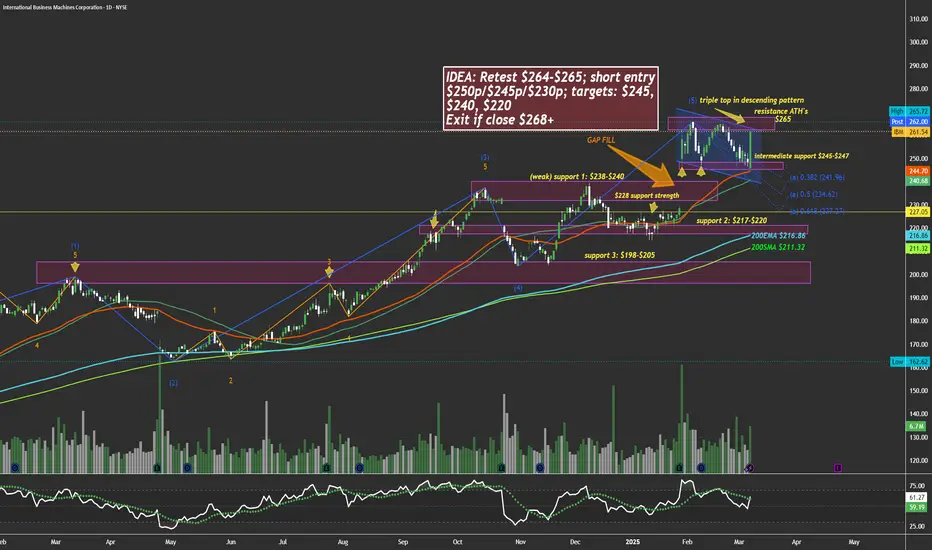
$IBM too hot, due for a chillHi, constructed a chart here showing many levels. I personally think NYSE:IBM will face some downside weeks to come. My trade plan is written in the idea box. The two lines that aren't labeled are 50ema and 50sma.
WSL

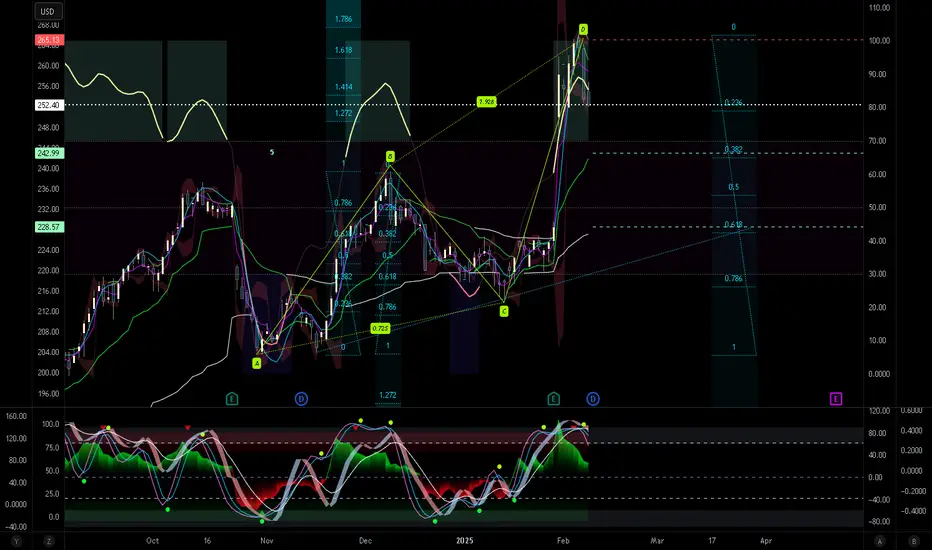
IBM Wave Analysis – 7 March 2025
- IBM reversed from the support zone
- Likely to rise to the resistance level 264.40
IBM recently reversed from the support area between the support level 247.25 (which stopped the previous minor correction a), lower daily Bollinger Band and the 38.2% Fibonacci correction of the upward impulse from January.
The upward reversal from this support zone continues the active upward impulse wave 3 of the extended upward impulse sequence (5) from last year.
Given the clear daily uptrend, IBM can be expected to rise further to the next resistance level 264.40 (top of the previous waves i and b).
IBM 3d Chart, Q1 2025Looking at NYSE:IBM and expecting this chart to revert some of its recent price advancements. With the general sentiment of the market and the massive post-earnings gap-up, I am expecting this to fill the gap to the down side and possibly more. This all depends on how the rest of the technology sector behaves, but the recent price action does not make me hopeful that IBM can sustain the price action of the last few months.

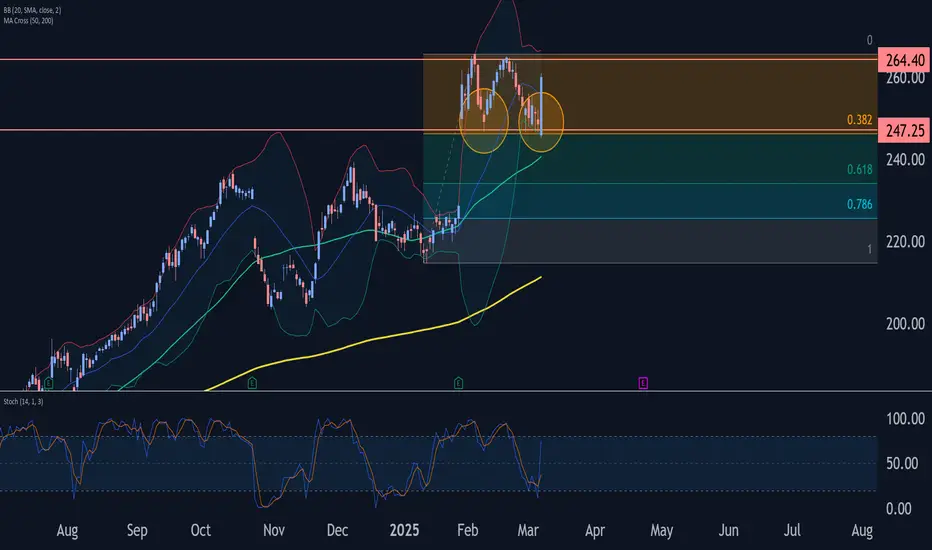
IBM Wave Analysis – 25 February 2025
- IBM reversed from resistance level 264.40
- Likely to fall to support level 247.25
IBM recently reversed down exactly from the strong resistance level 264.40 (top of the previous impulse wave iii from the start of February).
The downward reversal from the resistance level 264.40 started the active short-term correction ii, which belongs to wave 3 from the start of January.
Given the strength of the resistance level 264.40 and the overbought daily Stochastic, IBM can be expected to fall to the next support level 247.25 (low of the previous correction iv).

IBM Stock Analysis & GEX Options Insights – Feb. 18Technical Analysis (TA) for IBM
* Current Price Action: IBM is in a strong uptrend, forming an ascending wedge pattern on the 1-hour timeframe. The price is currently testing a key resistance zone.
* Support & Resistance Levels:
* Immediate Resistance: $265 – A breakout here could trigger more upside.
* Next Resistance: $280 – Aligns with the 3rd Call Wall from GEX data.
* Major Resistance: $285 – A strong rejection zone if price reaches this level.
* First Support: $257 – If IBM pulls back, this is the first demand zone.
* Major Support: $250 – A break below this could shift momentum bearish.
* Critical Breakdown Level: $235 – Losing this level would likely lead to a bigger sell-off.
* Indicators:
* MACD: Slight bullish momentum, but showing signs of exhaustion.
* Stochastic RSI: Mid-range, suggesting IBM could still move higher but may need a pullback first.
Options Flow & GEX Analysis
* GEX (Gamma Exposure):
* Highest Positive NetGEX / Call Resistance: $250 – IBM is trading above this level, suggesting support.
* 78.04% Call Wall: $265 – A key level IBM is testing now.
* 62.76% Call Wall: $280 – A major resistance area where price may slow down.
* Put Wall Support: $235 – The strongest downside support from options positioning.
* 3rd Put Wall: $215 – If IBM drops significantly, this could be the last support zone.
* IV & Sentiment:
* IV Rank (IVR): 23.4 → Moderate implied volatility, meaning options are fairly priced.
* IVx Avg: 28.1 → A slightly elevated volatility level.
* Options Sentiment: Calls = 10.7% → Slightly bullish options positioning.
Trade Setups
📈 Bullish Scenario (Breakout Play):
* Entry: Above $265 with strong volume.
* Target: $280 (Gamma Squeeze Potential).
* Stop Loss: Below $257.
📉 Bearish Scenario (Breakdown Play):
* Entry: Below $257.
* Target: $250 or $235 (Put Support).
* Stop Loss: Above $265.
Final Thoughts
* IBM remains bullish but is near key resistance at $265.
* A breakout above $265 could lead to a strong rally toward $280.
* A failure to hold $257 might trigger a pullback to $250 or lower.
* Best Trade Approach: Monitor price action at $265 for a breakout confirmation or $257 for breakdown confirmation before entering a trade.
🚨 This analysis is for educational purposes only. Trade responsibly and manage risk! 🚨

IBM, Long, 15m✅ IBM is oversold and is expected to move upward toward the key resistance at 251.80.
LONG 🚀
✅ Like and subscribe to never miss a new analysis! ✅

IBM Pivoting downward. IBMA nicely proportional AB=CD pattern here, with RSX divergence (momentum) present. This is significant. Crosses and confluence on VZO and Stoch RSI, BB %RCT downgoing. Fibonacci offer some static goals. A word on goals - we discourage use of anything static in the markets. The nature of markets is such that the system is far too dynamic for any rigid rules to be profitable. We thus use a dynamic system, such as an indicator based algorithm for exits.
IBM Wave Analysis 30 January 2025
- IBM opened with a sharp upward gap
- Likely to rise to the resistance level 260.00
IBM today opened with the sharp upward gap which broke the resistance zone between the resistance level 239.00 (top of wave 3 from December) and the resistance trendline of the two up channels from November of 2024 and May of 2023.
The breakout of this resistance zone continues the active minor impulse wave 5 of the higher impulse wave (5) from last May.
IBM can be expected to rise further to the next resistance level 260.00 (the target price for the completion of the active impulse wave (5)).

IBM International Business Machines Options Ahead of EarningsIf you haven`t bought IBM before the previous earnings:
Now analyzing the options chain and the chart patterns of IBM International Business Machines prior to the earnings report this week,
I would consider purchasing the 230usd strike price Calls with
an expiration date of 2025-1-31,
for a premium of approximately $5.40.
If these options prove to be profitable prior to the earnings release, I would sell at least half of them.

IBM: Attention! First signs of the end of the retracement!International Business Machines, abbreviated IBM and nicknamed "Blue Green", the large multinational computer technology and consulting corporation based in Armonk, New York, has a CLEARLY BULLISH technical aspect in its main time frames.
During 2024 it accumulated a rise of almost 50% when it reached the 239 area on December 9. Since then the price took a break and began a retracement phase that took it to the 215 area (61.8% Fibonacci).
--> What situation is it in now?
If we look at the chart, last Friday the price showed us the first 2 bullish warnings (Bull), indicating that the END of the retracement could be very close!!
--> What areas do we have to watch?
An upward break of the 227 area would indicate the END OF THE REVERSE and therefore, a new attack on its historical highs. But if the price loses the 214, it could easily take it towards the 204 area.
--> Is there any risk nearby?
Yes. Wednesday 29th presents results and if there are negative surprises, the price could fall strongly towards the 204 area, putting its medium-long term bullish trend at risk.
If our profile is CONSERVATIVE I would stay out of the value until the results are published, but if we have an AGGRESSIVE profile, we could follow the following strategy.
--------------------------------------
Strategy to follow:
ENTRY: We will open 2 long positions if the H4 candle closes above 227
POSITION 1 (TP1): We close the first position in the 238 area (+4.8%)
--> Stop Loss at 214 (-5.7%).
POSITION 2 (TP2): We open a Trailing Stop type position.
--> Initial dynamic Stop Loss at (-5.7%) (coinciding with the 214 of position 1).
---We modify the dynamic Stop Loss to (-1%) when the price reaches TP1 (238).
-------------------------------------------
SET UP EXPLANATIONS
*** How do we know which 2 long positions to open? Let's take an example: If we want to invest 2,000 euros in the stock, what we do is divide that amount by 2, and instead of opening 1 position of 2,000, we will open 2 positions of 1,000 each.
*** What is a Trailing Stop? A Trailing Stop allows a trade to continue gaining value when the market price moves in a favorable direction, but automatically closes the trade if the market price suddenly moves in an unfavorable direction by a certain distance. That certain distance is the dynamic Stop Loss.
-->Example: If the dynamic Stop Loss is at -1%, it means that if the price drops by -1%, the position will be closed. If the price rises, the Stop Loss also rises to maintain that -1% in the rises, therefore, the risk is increasingly lower until the position becomes profitable. In this way, very solid and stable price trends can be taken advantage of, maximizing profits.
