Buy Intel after a pull back We will be long on Intel after a pull back on the support line (swing trading)
4INTC trade ideas

INTC - Bullish play based on pattern of last earningsThere is a gap to be filled below 53.85 - 56.9. 200 DMA is also around the same area. Go long around 52.5 - 54 area. Incoming CEO's decision to not outsource is the best path forward. Folks will realize this sooner or later

INTC - EW analysis - ABC zigzag down INTC - It dropped sharply as wave A and expected to correct in B wave soon. So if B wave is sideways three wave bounce then it will be good shorting opprtunity for C wave down as zigzag correction. The move up was double zigzag correction.
Give thumbs up if you really like the trade idea.

INTCINTC Weekly Chart Close lower than the previous week. long tail red body Shooting star sign of the downtrend.


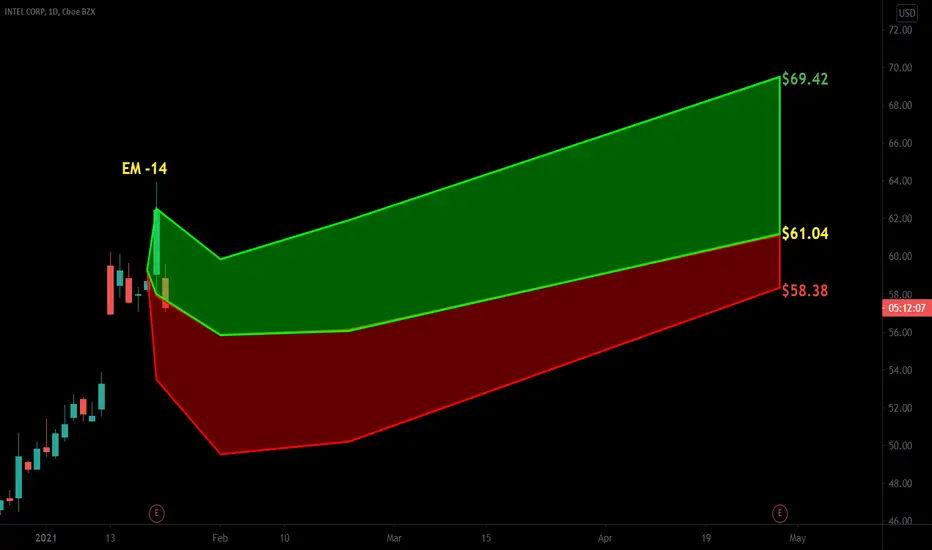
$INTC with a neutral outlook following its earning releaseThe PEAD projected a neutral outlook for $INTC following a positive over reaction following its earnings release placing the stock in Drift B
If you would like to see the Drift for another stock please message us. Also click on the Like Button if this was useful and follow us or join us.

Faith and Passion: INTCHave you ever been at a party and talked to a very intelligent person about their specific field of expertise? Those conversation can get very long and hard to follow...
Last night I had such an opportunity to speak with a software developer that knew a lot about Intel's chip architecture. He was incredibly passionate about NASDAQ:INTC and its future product releases. I asked him if he thought they would reclaim their crown as the top chip manufacturer and after a lengthy explanation of all the different ultraviolet laser chip making methods the answer was "Yes!" Independent of the recent bullish news of the CEO leaving I started a stake in the company.

Intel earnings today at 4pmIntel earnings 1/21 at 4pm
4th Quarter December 2020
Consensus:
eps: $1.10
revenue: $17.44 Billion
p/e: 11.3
Do your own due diligence, your risk is 100% your responsibility. You win some or you learn some. Consider being charitable with some of your profit to help humankind. Small incremental steps work : If you double a penny a day for a month it = $5,368,709. Good luck and happy trading friends...
*3x lucky 7s of trading*
7pt Trading compass:
Price action, entry/exit
Volume average/direction
Trend, patterns, momentum
Newsworthy current events
Revenue
Earnings
Balance sheet
7 Common mistakes:
+5% portfolio trades, risk management
Beware of analysts motives
Emotions & Opinions
FOMO : bad timing
Lack of planning & discipline
Forgetting restraint
Obdurate repetitive errors, no adaptation
7 Important tools:
Trading View app!, Brokerage UI
Accurate indicators & settings
Wide screen monitor/s
Trading log (pencil & graph paper)
Big organized desk
Reading books, playing chess
Sorted watch-list
Checkout my indicators:
Fibonacci VIP - volume
Fibonacci MA7 - price
pi RSI - trend momentum
TTC - trend channel
www.tradingview.com

INTEC will drop around 52/55 after E1 in premark!Hystory repeat?I think its very posible for intel to drop in next few days, maybe after E1! History repeat all time after E1 he drop

$INTC$INTC - Catalyst ER 1/21/21 - Are we going to see a golden crossover as the 50 MA gets closer to 100 MA? The chart forms a cup and handle, measuring the bottom of the cup, there was a price increase of $8.82. Taking this amount to predict the next move, we see that the price already made the $8.82 jump to $60. Also, at $60 is where the lower and upper trendline meets and the previous resistance. The upper trendline also rejected the price four times. Bollinger band is extended and looks like it's pulling back inside the middle. The supports are derived using FIBs. I think the stock already made a move, and a golden crossover will unlikely to occur. BEAR
My first video TA :)

$INTC obvious bull trap???I have my doubts on long $INTC given the 2020 performances, but with the recent leadership change, I'm a bit more optimistic. Chart showing really interesting trend. I guess i'll cover my short call tomorrow morning...

Inverse Head and Shoulders Earnings 1-21Earnings Thursday AMC
Now a gaps below price so possible pull back for a gap fill..just hard to know but the gaps provides support as well as the neckline now that price is abover the neckline..
This stock has seen some bad moves down after earnings recently..
Head is at 43.62 RS 45.24 LS 46.95
This pattern is usually reliable but you just never know especially at earnings so be sure to do your research..
Also known as a head and shoulders bottom..is a 3 valley pattern..have noted pattern does a bit better when right shoulder (RS) is a bit higher than LS. On this chart the RS is a bit lower than the LS.
Calculating targets is often done by subtracting Head (A) from neckline (B) and add it to long entry level. .
Sometimes the neckline slopes down and that is considered okay by most..sometimes this leads to better results.
By no means a recommendation..

INTC - Should I stay or should I go?Eyes are on INTC today after the price pop following the announced change in management.
Personally I believe INTC (and other semi-conductor companies) have a justified place in any diversified portfolio. The business model in an increasingly digital world definitely has future growth potential but also incredible high barriers of entry. thus existing players should continue to excel. However the competition between existing players is high and thus puts pressure on margins and ultimately company results.
Over the past 3 trading days INTC has closed not only the gap lower of the October 2020 earnings, but also attempted to close the bigger gap of July the same year.
To me this raises the question; Does INTC have the potential to challenge its Feb 2020 highs or are we dropping back to more recent levels?
Current analyst consensus price is in the $51 area and would suggest that the stock overshot by about 10%. However, the newly announced management change plus hints towards stronger than expected earnings might give the stock more room to run. Thus I will not focus on the fundamentals until after earnings and look at the technical aspects for now.
What I like;
+ Closed October 2020 gap and aiming for July 2020 gap closure
+ Historical support in the $56/57 area which at the time of writing holds true
+ Series of consecutive "higher-highs" since December 22, peaking in two gaps higher in the past two days
+ Bullish breakout from a wedge that started forming since June 2020, however I do not believe that the height of the wedge is an indication for upside potential
What I don't like;
- Historically huge vol. at earnings with large jumps/gaps which makes risk control difficult
- The closing of the July 2020 faces strong resistance from profit taking or traders liquidating formerly loss making positions that were engaged prior to the gap lower
- RSI and MACD now in overbought territory
What I watch/expect;
Stock likely to consolidate at current levels, trading sideways pre-earnings
Clearance of July 2020 will provide further upside, failure will likely see a fallback into the $52 range
Earnings to trigger fundamentals update
Note; I have started to build OTC call positions (JAN-15) after the gap lower late last year with an average price of $52.50. My tendency is to exercise said options and own the stock rather then rolling the position with new strike/maturity. For now I will not operate any take-profit order but implement a fail safe Stop Loss at cost level.
***Everything above is my personal view and not to be considered investment advise. Risk management is key, never trade what you can't afford to loose***

INTC - PUTS OptionsOptions Bearishness for NASDAQ. Attention goes to tech sector. Intel had a good run last week. Unexpected climb almost a full $10.00 bull move. Should retrace to re-balance and fill pending orders that got stuck in the gap up.

