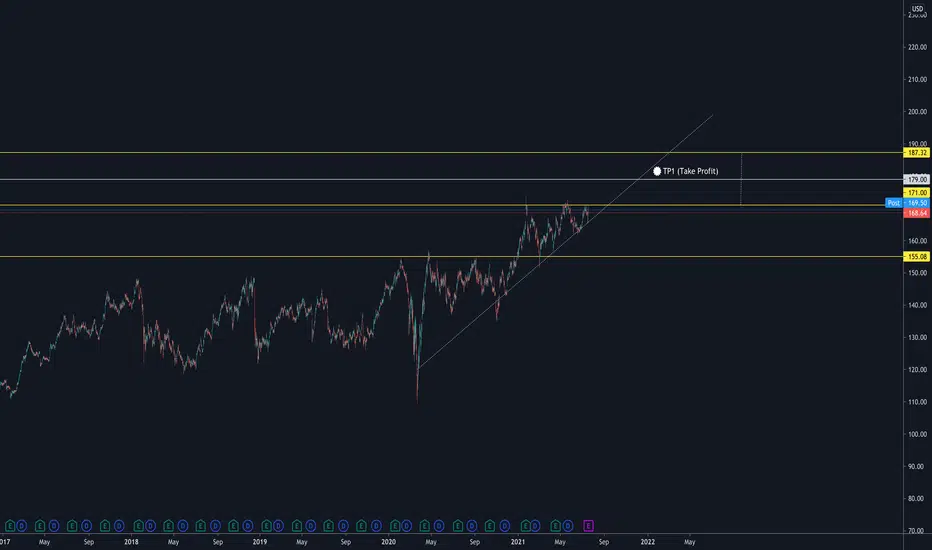
JNJ - 4H :: Trendline + Support and Resistance Due to people's concern with possible variants, it is likely that there is an appreciation of the biotech market.
The take profit can be possible at $179
4JNJ trade ideas
Market Alpha Long Term Analysis JNJSymbol: NYSE:JNJ
Indicators
Laguerre RSI
2 x Multi-Time Frame EMA
Comments: Looks like an ascending wedge here which typically breaks bearish. The Pattern had been pretty strong until a major violation took place. I expect further downside pressure.
We also just had mention of a new bankruptcy filing in attempt to avoid responsibility of over 30,000 cancer cases.

$JNJ | Model Prints New All Time High'sThe targets on this chart are produced by a proprietary model. Data is fed into the model, the output is the targets you see on the chart. The support zone is also defined by the model.

JNJ Will the $200 stop a protracted and non-corrective rally?Johnson & Johnson is a major manufacturer of cosmetic and sanitary products, as well as medical equipment and medicines. The company was founded in 1886.
In general, the history of the company is mega-successful. The corporation expanded through the purchases of competitors and gained more and more market share in its areas.
The company's progress is confirmed by the capitalization, which exceeds $430bn , as well as the graph of the JNJ share price, which is growing parabolic.
For 10 years, from 2002 to 2012, smart and patient investors recruited long positions in JNJ shares. During this period, the price traded in a broad consolidation of $46-71, growing volumes talked all - patience and everything will be)
From 2012 to the present, the value of JNJ shares has grown practically without correction.
Even during the Covid market plunge in February-March 2020, JNJ shares fell by only -29%. For example, then the S&P500 fell by -35%, the DJI index -38%, and the shares of the hype TSLA by as much as -60%.
The investors in this company knew and believed and they did not lose, because during the COVID-19 pandemic, a subsidiary of Johnson & Johnson, Janssen Pharmaceutica, developed a vaccine against this virus, which is certified for use in the USA and the EU, and the value of JNJ shares has renewed its absolute maximum.
Since the beginning of the year, JNJ's share price has been pushed towards the important $171 level . After the price fixes above this level, another upward impulse will take place.
We assume that it may be final before the start of a prolonged downward correction.
In the region of $195-200, it is better to fix the longs and look around, because the correction can be deep enough, and enough people who want to buy JNJ shares again may be in the $ 84-96 zone.

JNJits just idea... breakout or breakdown 👀 possible rising wedge, ascending triangle or still sideways...

JNJ - Ascending Triangle + Bad NewsI absolutely hate this company.
- Moving averages suggest bullish trend.
- 3rd attempt at major resistance.
- Doji Candle formed = change in trend/momentum.
- "Inside Day" pattern formed = Suggesting a continuation of the current trend. In this situation, it should continue the uptrend for a short period of time until a new pattern/confluence forms.
- However, JNJ can't catch a break regarding its vaccine. Issue after issue...
- Earnings Report - 7/21
This is a patience play. If you like to jump the gun, you could get burned...but with proper risk management, it may be worth the risk.
If you trade options:
Aggressive --> Play the Doji this week. 2 week expiration.
Moderate --> Wait for a few candles to form after today's doji. 1-2 month expiration.
Conservative --> Wait until after earnings. October expiration.


JNJ TO $156 or lowerHead and shoulders pattern, closed below neckline, highly recommend entering this trade tomorrow

$JNJ - Head & Shoulder watch 156 possible$JNJ has formed head and shoulder.
If the neckline 161 breaks, we could see 156 before attempt for a reversal.
good case - reverse from 161
bad case - 156
worst case - 150
———————————————————
How to read my charts?
- Matching color trend lines shows the pattern. Sometimes a chart can have multiple patterns. Each pattern will have matching color trend lines.
- The yellow horizontal lines shows support and resistance areas.
- Fib lines also shows support and resistance areas.
- The dotted white lines shows price projection for breakout or breakdown target.
Disclaimer: Do your own DD. Not an investment advice.


Long JNJ on the EMA bounceon an uptrend , seems to be trying to retest the highs again after bouncing off the 50EMA on daily

JNJ going for ATH retestJNJ is in an ascending triangle pattern. Uptrend has been challenged a couple times and has held its ground every time including its most recent test this past week. This will keep climbing until it retest ATH later this month.


Johnson and Johnson Struggling Below a Historic Resistance The share price appears unable to break out above the historic resistance level at 170.00, which represents a very strong bearish signal.
Moreover, the price action has recently established a broad 1-5 impulse wave pattern, as postulated by the Elliott Wave Theory, as well as having developed an Ascending Wedge. Both of these developments confirm the bearish expectations.
Finally, yesterday's trading session resulted in the creation of a Shooting Star candle, which could be a precursor to an imminent reversal.
Overall, there seems to be a very strong confluence of bearish indications at present.
The 23.6 and 38.2 per cent Fibonacci retracement levels represent the most likely targets for such a dropdown.

Long | JNJNYSE:JNJ \
Possible Scenario: LONG
Evidence: Price Action
TP: 175$
Call options, Strike 175$, 06/18/21
* This is my idea and could be wrong 100%.


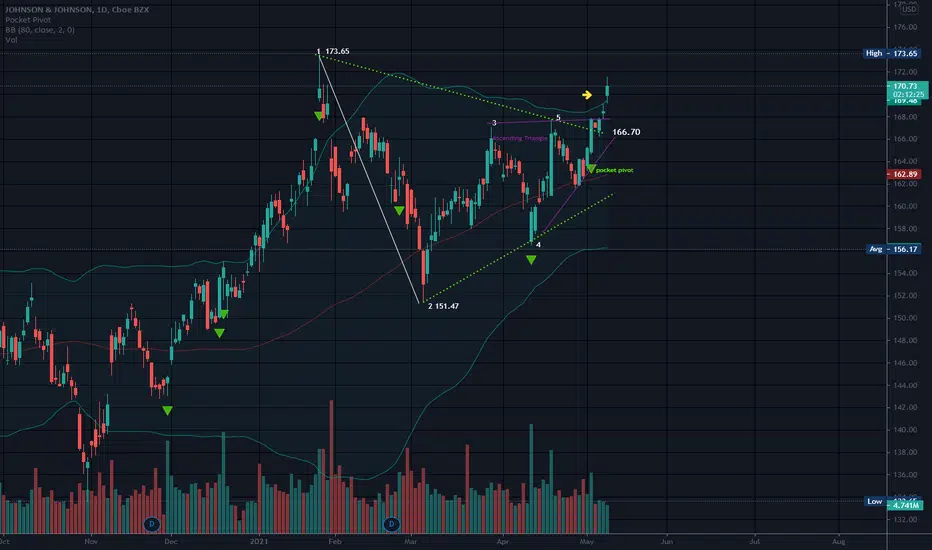
Symmetrical Triangle Ascending Triangle173.65 is the long term high.
JNJ has broken free of both triangles, as well as the bollinger bands.
Bollinger bands are set on this chart using an eighty day moving average verses the norm of 20. Price is above the top band today which is bullish, but it is likely that price will return to the inside of the bands.
No recommendation