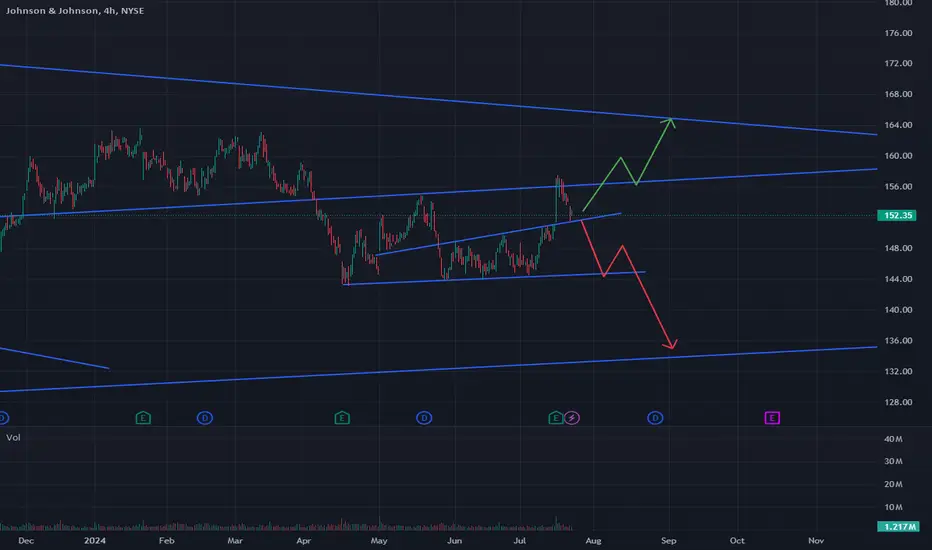
JOHNSON & JOHNSON Excellent confirmed sell signalJohnson & Johnson (JNJ) gave us the most optimal buy entry on our last call (April 17, see chart below) and easily hit our 157.50 Target:
Having been rejected early in September exactly at the top (Lower Highs trend-line) of the 2-year Channel Down and now establishing price action below its 1D MA50 (blue trend-line), this is a confirmed sell signal and the start of the Channel's 5th Bearish Leg. The RSI Lower Highs are common on all previous Channel tops.
Our Target is 141.00, which is on the Internal Lower Lows trend-line (formed by the last 2 Lower Lows) and still above the 1.236 Fibonacci extension.
-------------------------------------------------------------------------------
** Please LIKE 👍, FOLLOW ✅, SHARE 🙌 and COMMENT ✍ if you enjoy this idea! Also share your ideas and charts in the comments section below! This is best way to keep it relevant, support us, keep the content here free and allow the idea to reach as many people as possible. **
-------------------------------------------------------------------------------
💸💸💸💸💸💸
👇 👇 👇 👇 👇 👇
4JNJ trade ideas

Bear for Johnson & Johnson confluence & fundamental
bear for the sell; technical analysis and fundamental is very important, when doing top down analysis and your confluences add up you pretty much knows what the chart going to do.

NEW RELEASE:The 3 Step Rocket Booster StrategyYes its been a while since you saw me talking about
my #1 favourite strategy of all time.
This strategy is very simple and easy to follow
-
And in this article am going to teach it to you.
Because it only has 3 steps, according to this
stock NYSE:JNJ
-
-The price has to be above the 50 EMA
-The price has to be above the 200 EMA
-The price has to gap up above the 50 EMA
-
Once you notice these 3 steps then you
are in a buying territory.
-
Do me a favour
rocket boost this content to learn more
-
Disclaimer: Trading is risky you will lose money whether you like it or not
please learn risk management and profit taking strategies.

JNJ-SELL strategy 3-Daily chart Heikin AshiI feel this share is coming under pressure, its overbought and turning negative.
Strategy SELL @ $ 163-165 and take profit near $ 150.00. SL based on personal risk parameters.

JNJ LongDemand Zone
Long 152.40
Stop 145
Target 162, 173
Risk management is much more important than a good entry point.
I am not a PRO trader.
In my trading plan, the Max Risk of each short term trade should be less than 1% of an account.

JNJ Short Swing OpportunityHere's my thoughts on a JNJ short opportunity that set up this week based on the following:
1) Parallel Channel Failed Breakout
2) Weekly Shooting Star Candlestick
3) Daily Evening Star Candlestick Pattern
4) Daily RSI Divergence
5) Completion of Wave 5 Elliott Pattern
Weekly Chart
On the weekly chart, there is a failed breakout of parallel channel with a shooting star formed at the end of the week inside the channel. Looking below at the daily chart, the top of the channel is now acting as resistance.
Daily Chart
On the daily chart, an evening star pattern was completed on Thursday, signaling a reversal in trend. There is also a divergence in RSI.
Elliott Wave
Still learning Elliott Wave but for the sake of sharing as I learn, it looks to be a completion of Wave 5 at the recent top. Will continue to watch to see the corrective wave pattern setup.
Additional Considerations
The the talc baby powder lawsuit will affect the stock price once the uncertainty is removed and the settlement is reached.
Earnings on 15 Oct.
Not financial advice.
Do your own research.

JNJ completing correction wave C
NYSE:JNJ
JNJ is in multi decade uptrend peaked at 187 – presumably end of major wave 5 and turned into Elliott ABC correction, where major wave (A) length is about 37. Per fibo relation major wave (C) should most probably end at 139.5, while intermediate wave ‘c’ – a unit of the major wave (C) might break the pattern bringing the end of correction to 133 and beyond until possible exhaustion of the major correction at higher fibo multiples.
At the same time the stock is trading in a downward channel with a lower bound standing now at 141, as well as built-in triangle pattern identifies target as of 137.5 (not very reliable)
Week chart: EMA 50 & 200 confirming death cross – it’s late coz in JNJ case SMA 50/200 confirmed it earlier at around 160 – i.e. the stock is already about to be bottomed. RSI in week chart is not yet oversold, while in day chart RSI is heavily oversold.
I would consider weekly and daily RSI to align getting both in oversold territory and open long at somewhere 139-141 with a price target being upper boundary of the current downward channel


Price on long time supportPrice reached 145$ an touched the long time support trend line
It can be a good entry point to get a new wave up

JNJ Swing Long Conservative Trend Trade 14Conservative Trend Trade 14
+ long impulse
+ support level
+ 1/2 correction
+ T2 level
+ biggest volume 2Sp
+ test
Calculated affordable stop loss
1 to 2 R/R take profit
Daily chart context
+ long impulse
+ 1/2 correction
Monthly chart context
- short impulse
+ biggest volume Sp
+ test
+ 1/2 correction

JNJ Short IdeaThe Dow looks pretty weak right now to me and as we've seen the mag 7 rally relentlessly. I've been avoiding shorts on tech and semis because they are driving the majority of this rally and shorts have not worked. The Dow has been fairly strong, it is near ATH with everything else.
However, there have been a lot of bearish stocks in the Dow such as NKE and DIS, which is where I have focused my shorts recently. I think it may be time for tech to weaken, but it looks like the Dow will as well. NKE and DIS are a bit too low for me to want to short, but I think there's still some good opportunities on stocks like JNJ.
This is a shorter term time frame, but if you zoom out you can see that the ascending trendline shown above, goes back to a major uptrend from 2016. It recently rejected off that trendline and the descending one above. I'd say it's quite bearish to see a break below and rejection of a 10 year trend. I expect downside to continue here for a good while, unless the Dow can hold up and remain strong.

Johnson & Johnson (JNJ) - Approaching the Reversal ZoneIn April, we anticipated a pullback for JNJ, and since then, the stock has dropped approximately 7%, aligning with our expectations. The current trend suggests further downward movement, reinforcing our previous analysis.
We are focusing on the support zone ranging from $134 to $116, with a potential lower bound at $109, the Corona-Low. The ongoing pullback could represent the completion of Wave (4) within this target zone, aligning with multiple levels.
We are going to be monitoring this for signs of a reversal within this zone. This zone will be crucial to confirm the next possible upward movement.

Return of Impulse wave?JNJ has saw strong bullish pressure at the bottom of the downside channel and it is likely to complete a larger degree (ABC) wave. As such, we are ver bullish on NYSE:JNJ
Stochastic OScillator has completed an oversold crossover and longer-term MACD is close to complete an oversold crossover.


Ichimoku Watch: Johnson & Johnson Eyeing Possible Breakout Upcoming Earnings:
Johnson & Johnson (ticker: JNJ) is scheduled to report earnings before the market opens today. The consensus Earnings Per Share (EPS) estimate for the fiscal quarter ending June 2024 is $2.71. The reported EPS for the same quarter last year was $2.80.
Breakout Above Cloud?
The daily chart of Johnson & Johnson shows that this stock has been working with a downtrend since forging an all-time high of $186.69. However, price has struggled to get through $145.00 support since October 2023 and we have recently seen price drive into the upper boundary of the Ichimoku Cloud, made up of the Leading Span B (light orange at $149.30) and the Leading Span A (light green at $147.60). A price break above the upper limit of the Ichimoku Cloud would be considered a bullish signal.
Adding weight to a possible move higher is the Conversion Line (blue at $147.80) crossing above the Base Line (red at $147.50) on 11 July, and price movement trading below its Lagging Span (green at $151.01).
Price Direction?
With the Ichimoku Indicator suggesting a possible breakout higher beyond the Ichimoku Cloud, this could trigger a wave of follow-through buying towards the May top of $154.86.

Johnson & Johnson Downtrend Line Breakout at $148.9 17.07.2024- Johnson & Johnson chart shows a downtrendline breakout at $148.95
- If breakout holds, price could rally to $152.00; if $152.00 is breached, target $154.40.
- If breakout fails, price may drop to $145.06; if $145.06 is breached, target $140.12.
Apply risk management
Risk Warning: Trading in CFDs is highly speculative and carries a high level of risk. It is possible to lose all of your invested capital. These products may not be suitable for everyone, and you should ensure that you fully understand the risks taking into consideration your investment objectives, level of experience, personal circumstances as well as personal resources. Speculate only with funds that you can afford to lose. Seek independent advice if necessary. Please refer to our Risk Disclosure.
BDSwiss is a trading name of BDS Markets and BDS Ltd.
BDS Markets is a company incorporated under the laws of the Republic of Mauritius and is authorized and regulated by the Financial Services Commission of Mauritius ( FSC ) under license number C116016172, address: 6th Floor, Tower 1, Nexteracom Building 72201 Ebene.
BDS Ltd is authorized and regulated by the Financial Services Authority Seychelles (FSA) under license number SD047, address: Suite 3, Global Village, Jivan’s Complex, Mont Fleuri, Mahe, Seychelles. Payment transactions are managed by BDS Markets (Registration number: 143350)
Disclaimer

Johnson & Johnson - JNJ - Buy it! - longDear traders,
Id like to share this idea in order to take long positions, basically the price looking for a support level around 150$ (psicological level).
140- 150$ is is a good price range to look for buying opportunities.
General trend is still uptrend althouth it has been in a retracement for the last months which is good for capturing buying opportunities
best,

JNJ breaking out on dailyNYSE:JNJ is breaking out of a downtrend, strong support underneath at $143, first target is $154 and then $163.

JNJ impending shortThe chart illustrates the possibility of a correction down to a major trend line. This would mean millions of dollars lost in market cap within the next several months or years. If the movement is drastic we may see the company attempt perform countermeasures to provide shareholders a soft landing. One of these countermeasures could be (which I think will be more than likely) layoffs, or termination of complete organizations within the company. As technology advances and consumers of JNJ products increase in cost, the company may pivot to less expensive methods of operations. Attrition is a key variable that I foresee in the near future which could help the company regain some stability in the market. Many people will lose their jobs, but shareholder interest is at the forefront of any good company. Skills are easy to obtain nowadays but public moral is probably at an all time low or leveled with 1950s Vietnam era. If people are unmotivated to learn, they will contribute to the overall downturn of the economy.

JNJ will be ready for short breakdown happen Disclaimer for every one in market learn first and invest later on ur risk ok

Short Johnson & JohnsonI am bit late on J&J but clear setup in progress, taking a short now to target first liquidity level at 108.

J&J Entangled in Talc-Related Lawsuits and Bankruptcy AllegationCore Issues:
* J&J faces numerous lawsuits alleging its talc products contain asbestos and cause cancer.
* The company's utilization of a "Texas two-step" bankruptcy strategy to shield assets from litigation has drawn accusations of fraud.
Recent Developments:
* Cancer victims filed a class action lawsuit on May 22nd, 2024, alleging J&J's fraudulent use of bankruptcy and asset transfers to avoid compensation.
* J&J maintains the safety of its talc and claims the lawsuit disrupts their proposed settlement plan.
Broader Implications:
* This legal battle raises concerns about potential abuses of bankruptcy laws by corporations seeking to evade product liability.
* The case has significant financial ramifications for J&J, with analysts citing negative impacts on stock valuation.
Conclusion:
* The outcome of these lawsuits will determine compensation for victims, J&J's future financial liabilities, and potentially set precedents for corporate responses to mass tort claims.
* Upcoming developments, such as the claimant's vote on the settlement and the court's response to the latest bankruptcy filing, will be crucial in resolving this protracted dispute.
