$JPMtresaruy yields as push need break level for me enter like break then test for support then continue
4JPM trade ideas

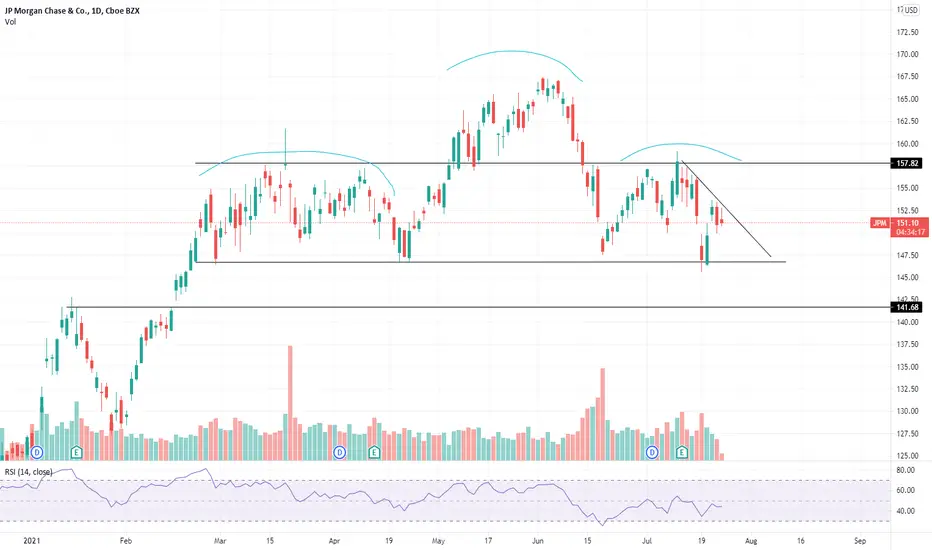
JPM ShortSeeing a beautiful Rounded Top / Head and Shoulders pattern on JP Morgan right now... Loving a short idea at these levels.
*Opinion only, not financial advice*


Hedging with short JPMWhen the market reached a (new) All Time High earlier today I wanted to get some short Delta in my positions. I learned my lesson during the 'recent unpleasantness' bottom of 7/19 that being all net long puts one at risk of volatility in a portfolio... even if the positions themselves individually remain strong and profitable.
This morning's volatility setup a good short entry on NYSE:JPM that by looking at futures this evening should hedge against tomorrow's potential downside.
JPMorgan to $80 by October 2022NYSE:JPM
Jamie Dimon and his army of minion traders at $JPM are printing the classic bear pattern of a H&S top (green). Measuring that formation, that should put us at a local bottom sometime in October.
From there I would expect the Santa Rally to be our retest of the neckline, before creating the base of the much larger H&S pattern in yellow. Measuring that pattern out gives me my price target of $80 when it is all said and done by October 2022.
And yes that is a price gap at $110 (purple box) that I expect to be filled in these moves.
- Penny


JPM | Looking for a sell-off to the 200-dayJPM might be forming a H&S pattern as detailed in the chart.
Strong support around 146$ could be tested by EOW, which will tell us whether we will have the luck of picking up more shares around 141$
Very bullish still on this name.
Good luck to all!
(*This is not financial advice, for sake of discussion and illustrative purposes only*)


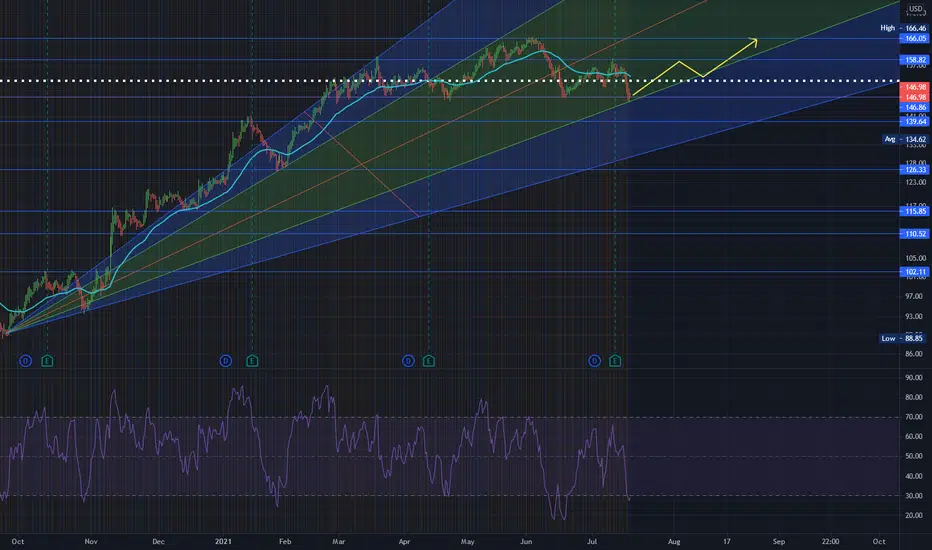
JPM Great Entry Yesterday I briefed on JPM, stating that it was a potential buy depending on if it holds its support. It is holding it fairly well while also indicating some other buy signals. This leads me to conclude that I believe it is in a buy zone and has a price target of 160(upper Bollinger Band).
Bullish Signals
-Weekly Reduction in selling momentum
-Resting Around Fibonacci Support
-B% Is on the lower scale
Worst Case Scenario
If this does end up being a false buy signal then I'd recommend watching this stock for it to hit 140.

JPM Breaks All Time High, And Resistance LvL From Feb. 2020If you look at the chart, this level hasn't been tested since Feb. of 2020. Then if you go further back, you'll see that JPM has never really come up to this level before. I see this area, (around the 150ish level) becoming the new support. Good for a long position or perhaps an Option play if you like to trade futures, and know what you're doing. A safe bet is to just take a long position, I'd buy in as soon as possible.

WATCH JP Morgan(critical Point)JPM is in a critical state as seen by it resting at its Fibonacci support. It can either break to the downside, allowing for a entry at 140 or it may reverse. In order to conclude the direction that this stock is going, watch the daily and weekly for a turnaround via the MACD. A reduction of bearish momentum within the weekly and bullish momentum within the daily suggest a reversal.
-Bullish Price Target 160
-Bearish Price Target 140

JPM on supportJPM suffers as well the last days due the bloodbath we had. but we are sitting on a strong support now. I assume it will bounce back and slightly increase again.
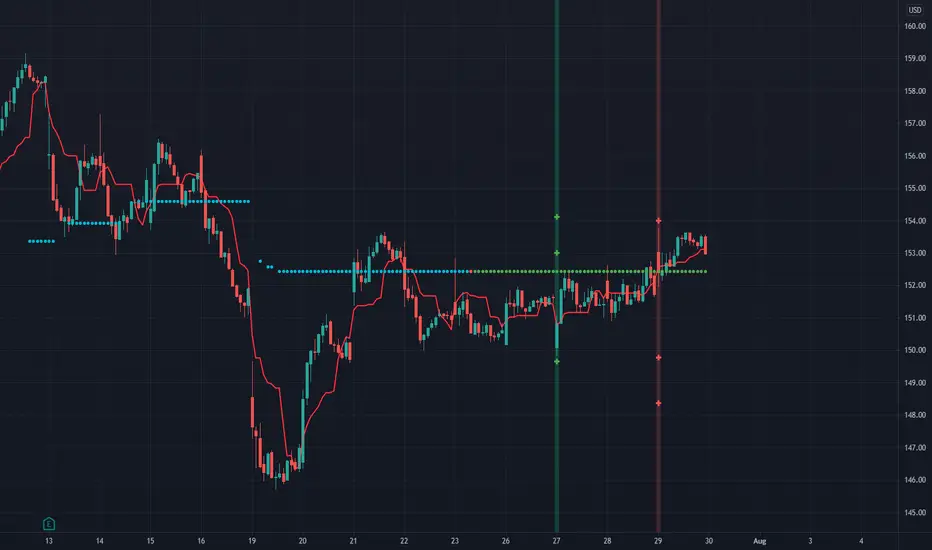
WATCHING $JPM for ENTRY TARGET @ 141.20WATCHING $JPM for ENTRY TARGET @ 141.20
————
I will repost when it get’s closer (or if I take a position)if it goes that way and if it makes higher highs I’ll repost with new entry.
Look to the right. ENTRY target in grey. Sell target in green. Double position target in red. That’s it. I’m starting to also add in a few support levels to add as well.
I’m also thinking about doing the Entry targets on YouTube instead, maybe twice a week… I think the 10 daily charts should be for new positions, targets hit, and adds… thinkin’ about it.


JPM support line, target price It seems that it will show support at 61.80% and break through all high points if it crosses the purple downward line. The effectiveness of jpm was actually a surprise. I don't think it's reflected in the stock price yet. I think a good buying opportunity is coming soon. If the golden cross of 100ma and 200ma appears on the 15-minute chart, it is recommended to enter.

$JPM - Daily. Earnings PM 07/13$JPM into a smaller area of resistance. Interesting to see how it responds tomorrow morning.


JPM shortJPM short potential is around from 7 to 14%
First price target 140
Second target 135
Third target 130 (unlikely)

JPM Bias: UpOverall price is in ranging formation in potential head and shoulder pattern due to volume, we are expecting some short term bullish movement. Make sure to apply set loss and take profit level to all your trade.
