Covered Calls For BeginnersI’m Markus Heitkoetter and I’ve been an active trader for over 20 years.
I often see people who start trading and expect their accounts to explode, based on promises and hype they see in ads and e-mails.
They start trading and realize it doesn’t work this way.
The purpose of these articles is to show you the trading strategies and tools that I personally use to trade my own account so that you can grow your own account systematically. Real money…real trades.
Covered Call For Beginners
For good reason, the covered call strategy is one of the first option strategies that new traders start trading.
This is an effective strategy that options traders often use to provide income on stocks they already own.
Questions to be considered in this article:
- What Is A Covered Call?
- Should You Trade It?
- Specific Example
Can You Do It In A Retirement Account, EG, IRA?
What Is A Covered Call?
A covered call is an options strategy used traders to produce income on stocks on long stocks held in their portfolio.
This strategy is used by traders who believe that stock prices are unlikely to rise in the short term.
A covered call strategy is defined as holding a long position in stock while simultaneously selling a call option on that same asset.
This strategy can provide income to a trader who is long term bullish on stocks but doesn’t believe there will be a significant increase in price immediately.
A covered call will limit a trader’s potential upside profit if there is a significant move in the price of the stock upwards.
This strategy provides little to no protection if the asset price moves downwards.
Covered Call Example
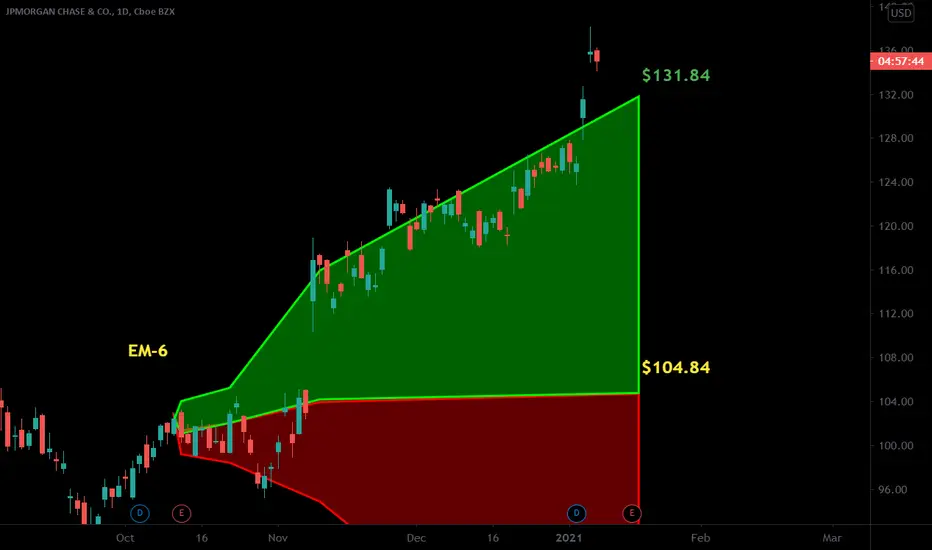
For the specific example that we’re going to cover today, we’ll take a look at JP Morgan JPM .
The price information reflects the price of JPM back in July at the original time of writing for this guide but is just being used as an example
If you were holding JPM stock in your portfolio before the pandemic, chances are that you are currently underwater.
DISCLAIMER
***For the purpose of full transparency, I do not own or hold any JPM stocks*** I typically only hold stocks between 5 and 25 days.
Stock Price Movement Recap
For this example, we’re going to assume that I own 100 shares of JPM . If I were to purchase 100 shares for $96 it would mean that the capital requirement for this position is $9600.
You’re probably familiar with the way profits move in relation to stock prices… but just to be safe:
- If the stock increased to $106, or $10, I would earn $1000.
- If the stock increased to $116, or $20, I would earn $2000.
- If the stock decreased to $86, or -$10, I would lose $-1000.
How Does A Covered Call Work?
Sell one call option contract for every 100 shares of the underlying stock in your portfolio.
The contract selected would ideally have a short expiration date of 7 days.
You would choose an “out of the money” call at a higher strike than the current price of the stock.
When choosing this strike price, you would typically choose a price at least one standard deviation away from the current strike price. In other words, choosing a strike price that you do not believe the current strike price will exceed before the date of expiration.
If you’d like to learn more about this options strategy, or options in general, I have an awesome Options 101 Course.
What’s the benefit of having a Covered Call for the stocks in my portfolio?
It’s simple really.
When you sell a call option contract, you will receive a premium.
This strategy generates income when you don’t expect to profit from the movement of the underlying stock price.
In this example with JPM , I received a premium of $55 for selling a call option contract at the price of $116.
Provided that the underlying strike price does not move above $116, the contract will expire worthlessly and I will keep the premium I collected by selling the options contract.
Let’s take a look at how a covered call will affect your portfolio with the same stock movements.
- If the stock increased to $106, or moves $10, I would earn $1000 plus the $55
- If the stock increased to $116, or moves $20, I would earn $2000 plus the 55
- If the stock decreased to $86, or moves -$10, I would lose $-1000 but keep the $55 for a total loss of -$945
Why does this work?
If you take the entire amount of premium you received and divide it by the number of days between no and contract expiration, you come up with a number like this:
$55 dollars in 7 = $8(ish) per day.
This covered call contract is paying us $8 dollars per day.
If you take the $8 dollars, divide that by your total capital investment of $9,600 it equals 0.08%.
This may not sound too incredible, but… If we do some basic arithmetic and take 0.08% and multiply that by 360 trading days per year, you end up with a return of over 30%.
This is in addition to what you earned from the growth of the stock.
On some stocks, it’s possible to earn upwards of $20 per day.
This could increase annual returns in excess of 40% to 50%
Does this sound a little more exciting? YES!
Should you trade it? ABSOLUTELY!
BUT…. There is a risk associated with this strategy.
If there is a large movement of the underlying stock price that surpasses the strike price of your call option contract, you will be forced to sell your shares at this price.
This would limit your upside potential to the difference between the current stock price and the price of the call option contract.
Example: If the price of the stock went up to $117 (past the $116 call option) and the options contract expires, your stocks will be sold $117.
This means you would earn $1,100 + $55, or $1,155.
In other words, you would lose $100 for every $1 the strike priced moved above your call option contract.
The silver lining is that you can probably buy your stock back the next day if you wanted to hold them long term.
This type of trade can be taken inside of your retirement account such as an IRA, which provides you with another way to grow your account conservatively.
4JPM trade ideas

The fall may continueOn the 1 hour timeframe, the flag trend continuation model is formed. If the lower border of the pattern and the resistance level is 85-87$ are broken, I expect a fall. Conservatively, you can enter the short from breaking the lower border of the flag.

$JPM with a bullish outlook following earning release $JPM is projected with a bullish outlook after a positive under reaction following its earning release with the PEAD placing the stock in Drift A
If you would like to see the Drift for another stock please message us. Also click on the Like Button if this was useful and follow us or join us.


Potential short set up for JPMThis is a potential set up and not yet actionable unless you want to take an aggressive starting position. JPM has finally up to pre COVID price level. The run up recently has been too fast too sharp in my opinion. RSI is extreme over bought reading. Any marginal high will extend the PPO divergent high. Be careful trading this since the earning is coming up on this Friday before the bell. I can see rejection here or making a marginal new high and fade. That would be a bull trap and down move may be pretty swift. Down side target for me is the yellow trend line from COVID March low or the top of the gap at $112.55.

$JPM : JP Morgan Profit Surges On LowerJPMorgan profit surges on lower loss serves , investment banking strength
JPMorgan's net income rose 42% to $12.1 billion or $3.79 per share , in the quarter ended Dec . 31 from $8.5 Billion or $2.57 per share , a year earlier.
So from techinc analysis we can see more wave bullish and Moving Average of Price read the price up when market open down today.

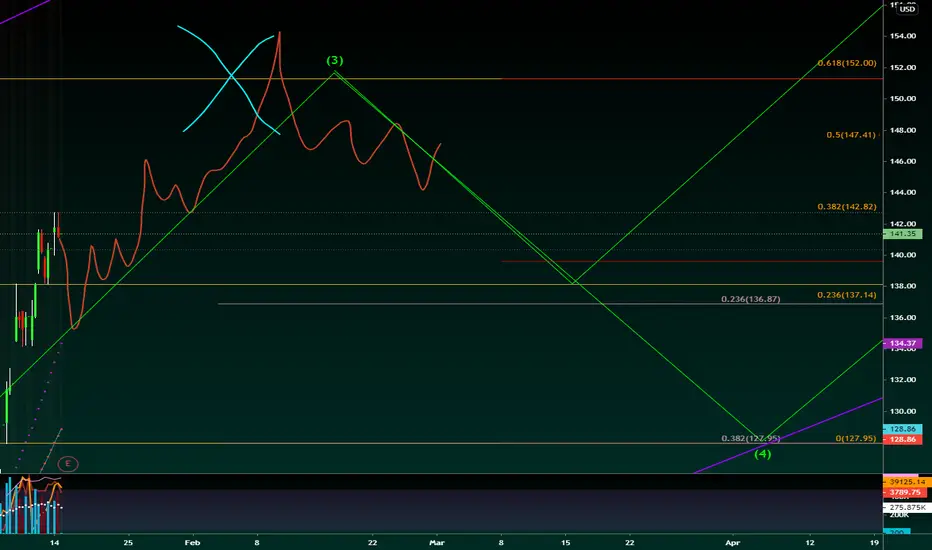
JPM Short Term Idea (Jan 15th through April 2021)JP Morgan & Chase (JPM) (January 15th 2021 through April 2021)
Low: $128 - $137
High: $151
In the spirit of expected positive Q4 earnings for JPM in 2020, I've taken a bit of time to create an analysis for use in my Cindicator forecasting.
This is just a shorter term idea, part of a larger expectation attached in related ideas below:
Please see the attached idea for my full write up on my current JPM outlook.
Thanks for tuning in :) Disclaimer, anyone in the trade needs to do their own due diligence and decide what is right for YOU. My charts can be wrong at any time and it's very important that you have your own strategies and plans in place. I run this channel for my own educational purposes of learning to trade, and I will never be 100% right, so please do not let me confirm any bias for you! (Dangerous to do so, stay safe and remember the basics & rules of risk assessment.) Expect the unexpected and happy trading!
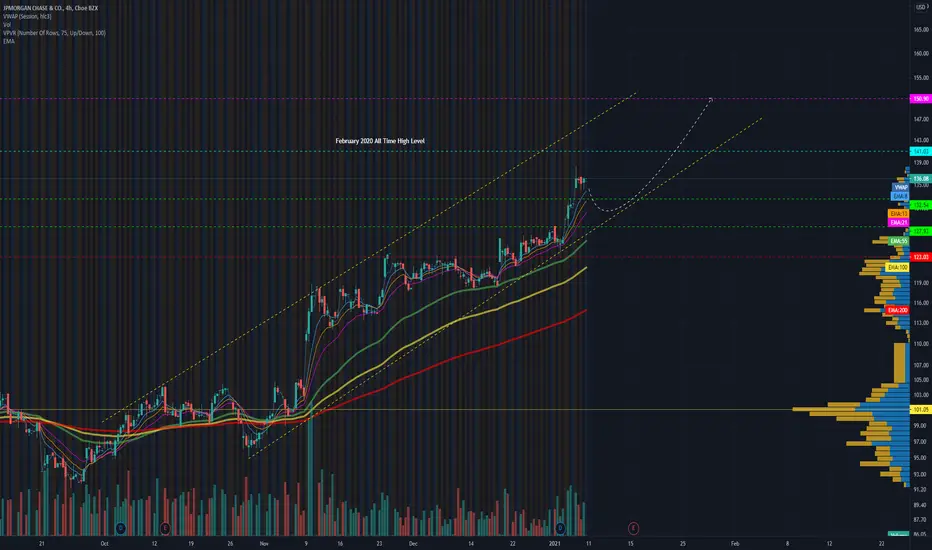
JPM Long Term (Jan 2021 through May 2022)JP Morgan & Chase (JPM) (January 15th 2021 through May 2022)
Bullish range estimates:
Low: $113 - $128
High: $189 - $214
Bearish range:
Low: $86 - $123
High: $189 - $214
So with earnings being announced in a few hours, I thought I would take a look at JPM for Cindicator forecasting.
It should be noted that this chart could be extremely inaccurate as I have based this off what I think I'm seeing in the potential for impulse motive Elliott waves. I understand its decently rare to be able to properly identify and use Elliott wave theory but I see some interesting things in the current structure since the March 2020 crash.
I have mapped 2 potential paths for JPM to validate itself as EWT.
My reasoning for believing in the potential for the current structure to be a clean EWT is as follows:
-The March 2020 crash was unexpected, and a lot of markets were affected all at the same time from approximately mid-February 2020 to March 9-18th 2020. For many markets, the trading volume exploded while many market movers dumped. It was such a violent and volatile move that the VIX S&P 500/VXD DJI volatility indices registered levels reminiscent of previous devastating crashes. The candles that were printed in a lot of markets including JPM show me signs of volume exhaustion and reason to believe that something has fundamentally changed in the crowd's mindset about the asset, becoming a true trend reversal for larger moves upward. This does not confirm much for me other than the potential for at least 1 bullish bounce, but as we see in January 2021, these moves have matured a bit further than that.
-March, June, and September 2020 look like the beginning of a 1st and 2nd wave to me. After the June peak, it never retraces below a 61.8% level, which is a very common proportion in the 2nd wave retracement as far as my findings go.
-From September 2020 to now, January 2021, the trend stays on a pretty steady path upwards, has some points of resistance but it has not retraced below the $115 top of my suspected June 2020 1st wave, giving just a little more validation to my theory that the current trend could be in a 3rd wave.
-Because price surpassed levels around $113-$128, this wave could be extended to at least 161.8% OR 261.8% the length of the 1st wave. If it weren't extended, there should have been a major price correction around 61.8%:$113 or 100%:$128 wave 1 lengths.
-I'm not giving much credence to the idea that this suspected 3rd wave trend could be extended to 423.6%/425% as its much less likely than 161.8% and 261.8%.
-If the 3rd wave is extended to 425% then this chart may be invalidated soon after the $189 target is surpassed with a move to $250, and recalculation for 4th and 5th waves would be needed.
Potential 3rd Wave Extension Targets:
161.8%: $151
261.8%: $189
423.6%: $250
Potential 3rd Wave Timing:
161.8%: February 17th 2021
261.8%: June 11th 2021
423.6%: ???
If all is well, good, and expected by this time, the 4th wave could take 2 different paths because of my inability to verify if the suspected 3rd wave will be extended to 161.8% or 261.8%.
If suspected 3rd wave is a 161.8% extension, the 4th wave could retrace from $151 down to 23.6%:$137, 38.2%:$128, 50%:$121, or 61.8%:$113-$115. If it goes lower than 61.8%:$113 at this time, then all of the chart is invalidated as the wave 4 retrace cannot go lower than the top of of wave 1 which is $115. However, if this is a true Elliott wave, there is a lower probability that the 4th wave will retrace 61.8% of the 3rd wave. 38.2% and 50% retrace levels are more common here.
If suspected 3rd wave is a 261.8% extension, price could reach the $151 target around February 17th 2021, correct to $138 shortly after, and be back on an upward trend to $189 by June 11th 2021. Then, the 4th wave could retrace from $189 down to $166, $151, $140, or $128.
Now that I have set some ground rules for what waves 1-4 could look like as whole, I could have 8 different potential 5th wave paths depending on where the retrace for wave 4 ends.
If suspected 3rd wave is a 161.8% extension, my statistical guess is that wave 4 will most likely retrace to 38.2% of wave 3 around $128.
Because the suspected 3rd wave surpassed $128 and did not retrace lower, it is extended at least 161.8% of wave 1, which also means wave 5 should be at the very least, 100% the same size as wave 1. Wave 5 length COULD be equal to 100%, 161.8%, or 262.8% of 1st wave's length.
________________________________
If wave 3 is a 161.8% extension of wave 1:
& If wave 5 starts at $137:
Wave 5 100% Target: $176
Wave 5 161.8% Target: $200
Wave 5 261.8% Target: $239
& If wave 5 starts at $127.95:
Wave 5 100% Target: $166.87
Wave 5 161.8% Target: $190.92
Wave 5 261.8% Target: $229.84
& If wave 5 starts at $121:
Wave 5 100% Target: $160
Wave 5 161.8% Target: $184
Wave 5 261.8% Target: $223
& If wave 5 starts at $113:
Wave 5 100% Target: $152
Wave 5 161.8% Target: $176
Wave 5 261.8% Target: $215
________________________________
If wave 3 is a 261.8% extension of wave 1:
& If wave 5 starts at $140:
Wave 5 100% Target: $179
Wave 5 161.8% Target: $203
Wave 5 261.8% Target: $242
& If wave 5 starts at $127.95:
Wave 5 100% Target: $166.87
Wave 5 161.8% Target: $190.92
Wave 5 261.8% Target: $229.84
& If wave 5 starts at $151:
Wave 5 100% Target: $190
Wave 5 161.8% Target: $214
Wave 5 261.8% Target: $253
& If wave 5 starts at $166:
Wave 5 100% Target: $205
Wave 5 161.8% Target: $229
Wave 5 261.8% Target: $268
________________________________
Wave 1 price gain: $38.79
Wave 1 price gain x 1.618: $62.76
Wave 1 price gain x 2.618: $101.55
(Wherever wave 4 ends, these numbers can be added to that level for potential 5th wave targets.)
If we ever get to a true wave 5, we may be able to use a channeling technique to further map its path.
Of course, this could all be incorrect and invalidated at any time but I wanted to document these findings in the event I have actually come across a real Elliott wave, and it may prove good for my own research in the future.
In a few hours, the 2020 4th quarter earnings will be announced for JPM. With how good this chart looks, I can believe that the earnings may outperform the current analyst expectations of $2.62. Wall street reports a potential earnings range of $2.00-$3.00.
www.investopedia.com
www.wsj.com
Thanks for tuning in :) Disclaimer, anyone in the trade needs to do their own due diligence and decide what is right for YOU. My charts can be wrong at any time and it's very important that you have your own strategies and plans in place. I run this channel for my own educational purposes of learning to trade, and I will never be 100% right, so please do not let me confirm any bias for you! (Dangerous to do so, stay safe and remember the basics & rules of risk assessment.) Expect the unexpected and happy trading!

Top Stock Picks - Trade Idea JPMShort-Selling Idea for JP Morgan after tomorrow's earnings report.
Please don't forget to FOLLOW, LIKE, and COMMENT ...
If you like my analysis:)
Trade Safe - Trade Well
Regards,
Michael Harding 😎 Chief Technical Strategist @ LEFTURN Inc.
RISK DISCLAIMER
Information and opinions contained with this post are for educational purposes and do not constitute trading recommendations. Trading Forex on margin carries a high level of risk and may not be suitable for all investors. Before deciding to invest in Forex you should consider your knowledge, investment objectives, and your risk appetite. Only trade/invest with funds you can afford to lose.

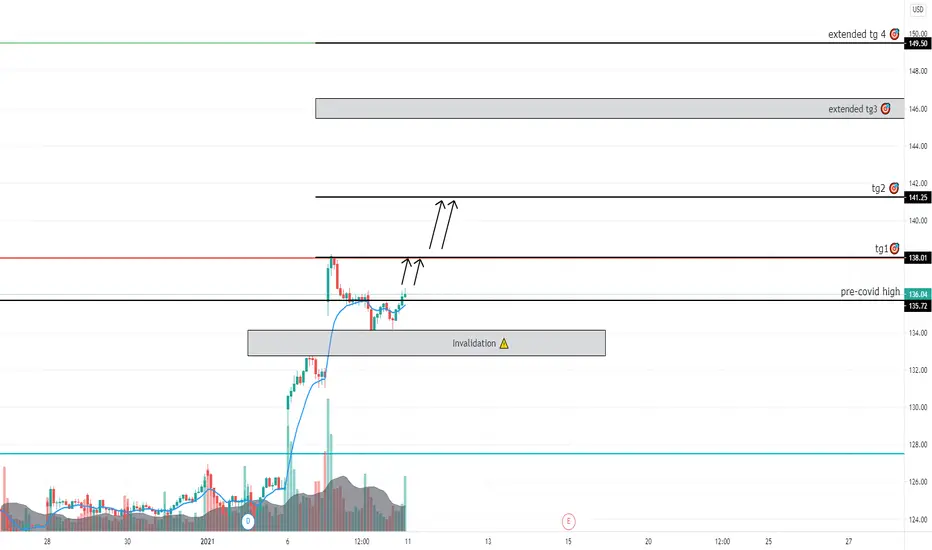
UPS Swing and JPM Swing RecapUPS looks prime to rip higher with a strong bullish close and break of mid day pennant upwards

$JPM - Bullish extension beyond ATHA push beyond $138 opens some extended targets into ATH:
TG1 🎯 - $138
TG2 🎯 - $141.25
extened TG3 🎯 - $146
extended TG4 🎯 - $149.50
Invalidated below $132.75 ⚠️
We are in $140 calls for 1/22
Please like & follow if you enjoy my work! ❤️
JPM - January 10, 2021JPM along with other bank stocks and XLF got a nice push last week on the news of Democrats winning the Senate. It is believed that a blue government will result in more stimulus and loan packages for the economy. This will inherently increase interest rates as demand for loans increase, benefiting banks. On the other hand, the FED is committed to suppressing interest rates for the foreseeable future which is why banks have lagged in the recovery process relative to the S&P 500. The topic is complex and continuously developing, but banks have momentum and money flowing into the sector as it continues to play catchup to the broader market. We could see a continuation push higher in the coming weeks, however will have to closely monitor the FED's actions and the Democratic agenda.
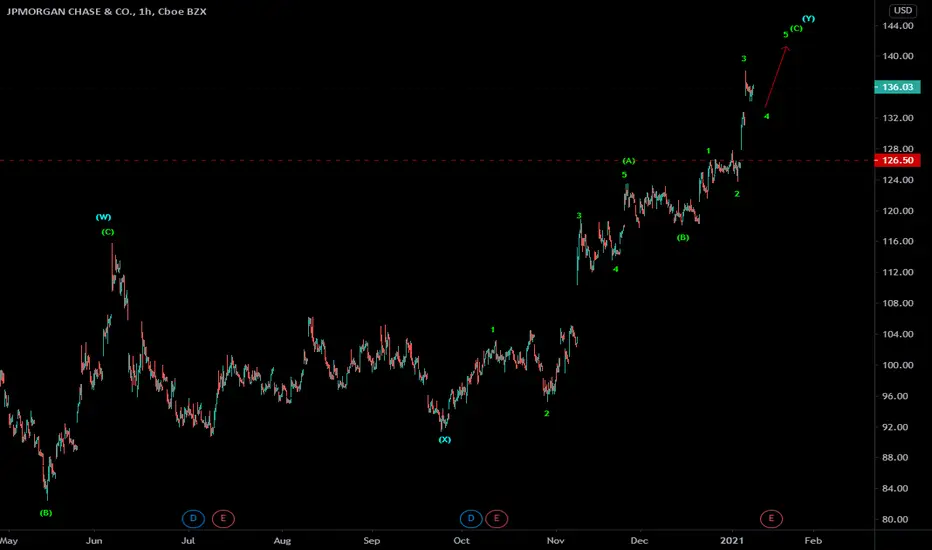
JPM - EW analysis - 5th of C wave upJPM - It is in double zigzag up from major low. It is forming 4th wave correction of C of Y wave up. Buy little lower for 5th wave up for target above 140. It can extend further also, as the trend was gapped up twice.
Give thumbs up if you really like the trade idea.
$JPM following through the PEAD model projection ConeAfter a positive over reaction back in August 2020 after $JPM's earnings, The price followed its PEAD projection, trading well within the Projected PEAD cone.
If you would like to see the Drift for another stock please message us. Also click on the Like Button if this was useful and follow us or join us.


JPM trade ideaI like JPM or XLF as a whole. I think this can break its ascending triangle and move higher especially with stimulus hitting no later than Jan 4th. First target $130 then $140. Im holding 2/19/21 230c


JPMORGAN ready to give a 15% bullish movementToday we will share a bullish analysis of JPM, explaining the major zones and the potential movements we can expect
Relevant items:
-The key area to pay attention to is the Resistance zone. We can see in the past what happened after the price broke it. We had an 18% bullish movement
-It's important to pay attention to the corrective structure formed on the edge of the resistance zone. Now we have the same situation at the same level
-The target we are choosing is a Double top pattern with the All-time high zone.
-We will define the RISK-FREE level at 130.5. This means that if the price reaches that zone, you should have your stop loss moved at the entry-level.
-Based on past behavior, this movement can take around 70 days.

Possible bearish Gartley pattern on BATS:JPMBearish Gartley pattern, price is still bouncing from the last high point. With a tight stop-loss, it might be a good short occasion (I use a 5% error margin from the "ideal formation").
If the price crosses the stop-loss line, the formation is negated.

JPM LongJPM gapped up over the 115.77$ area then retested as support, it held nicely and is now forming a nice wedge pattern back up to 123.50$ resistance area. If it breaks 125$ and holds above 123.5$ as support it has room to run to 140$. I do not expect the government to allow JPM to fail anytime soon and I believe it will get back to pre-pandemic highs.

JPM Sell PossibilityHello Traders!
I see a couple reversal signals for JPM, a stock which has been on a bullish run.
Signs of continued Reversal :
#1 Hidden divergence signaling the recent downtrend may continue.
#2 Price action falling below both the VWAP and 50EMa
#3 Broke a key level moving downwards. I'd like to see it retest the recently broken key level before deciding to enter.
There are a couple of reasons as to why I like this trade. My first target would be 114 with the next one being 110 after a break below another key level. There is a gap to fill which could possibly make this trade have an insane RR. Let me know what you think!
Disclaimer: I am not a financial advisor and am not offering financial advice. All charts posted are for educational purposes only.

