Buy JP Morgan ChaseShort Term Trading Advice by Naranj Capital
Buy JP Morgan Chase
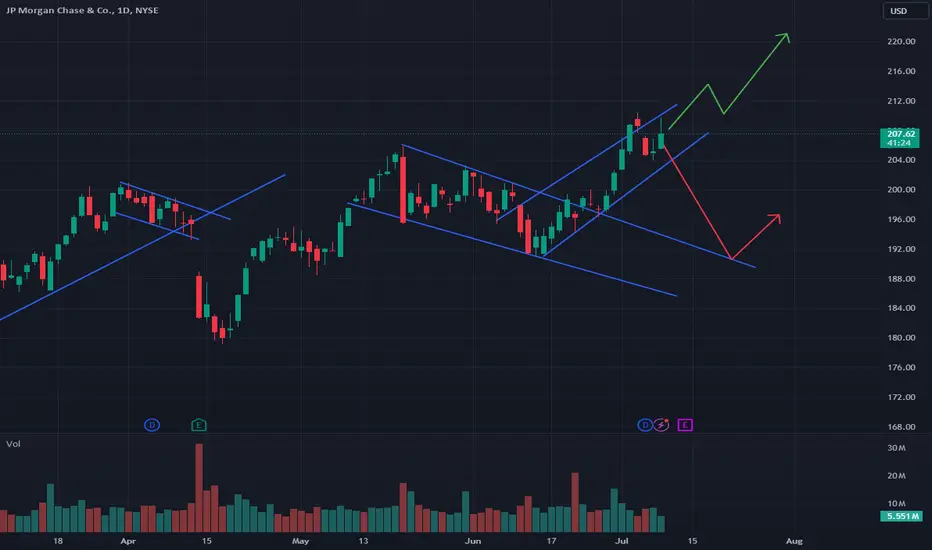
● Buy Range- 209 - 212
● Target- 222 - 225
● StopLoss- 205
● Potential Return- 5-6%
● Duration- 14-15 Trading Days
4JPM trade ideas

JPMorgan Chase & CO.JPM needs to violate 199 to the upside, to trigger a rebound near 200.94 - 203.30 - 205.88. As 205.88 is considered the last major peak that needs to be violated, to confirm the major uptrend, with potential targets at 210 - 215- 217.35.
The stop-loss lies below 195.35, as a break below it, will cancel the mentioned positive scenario.
The information and publications are not intended to be or constitute any financial, investment, commercial, or other types of advice or recommendations provided.

JP Morgan Surprises Investors with Strong EarningsOn Friday, JP Morgan surprised investors with a robust earnings release, posting an impressive +4.01% increase and a revenue surge of 20.78% above estimates. This positive news has ignited investor confidence and set the stage for a potential bullish trend.
Historically, JP Morgan's stock has shown a seasonal pattern of growth during this period. Over the past 15 years, the company's stock price has typically increased during the summer months. This historical trend, combined with the recent strong earnings report, suggests a favorable outlook for JP Morgan's stock in the near term.
The pre-market indicators are already showing gains, reflecting investor optimism. Given these positive signals, we are looking to open a long position at the start of the New York session today.
✅ Please share your thoughts about JPM in the comments section below and HIT LIKE if you appreciate my analysis. Don't forget to FOLLOW ME; you will help us a lot with this small contribution.

JPM Time to Bank your profits ?JPM has has had a great run, tacking on 17% since the April low.
They report Friday of this week. Last Quarter they surprised to the upside.
Using a 4H Wolfe Wave analysis we appear to have peaked and could pause or head lower.
The fly in this ointment is that the 15 minute chart has a bullish Wolfe Wave.
So I am waiting in the weeds until the recent gap is filled at around 127.85.
Also need my momentum indicator to roll over.
Note: Powell speaks and other Banks report this week; so possible volatility .
Not investment advice... do your own due diligence.
S.

JPMorgan Potential Resistance Breakout At $210.60 11.07.2024- Technical Setup: A potential breakout above resistance at $210.60 within a 4-hour ascending triangle pattern.
- Upside Potential: If the breakout sustains, there is a significant probability for the price to advance towards $231.16. Further breach of $231.16 could lead to an extended move towards $257.30.
- Downside Risk: Conversely, if the breakout fails, there is a high likelihood of a decline towards $194.43. A breakdown below $194.43 could potentially push the price down to $181.74.
Apply risk management
Risk Warning: Trading in CFDs is highly speculative and carries a high level of risk. It is possible to lose all of your invested capital. These products may not be suitable for everyone, and you should ensure that you fully understand the risks taking into consideration your investment objectives, level of experience, personal circumstances as well as personal resources. Speculate only with funds that you can afford to lose. Seek independent advice if necessary. Please refer to our Risk Disclosure.
BDSwiss is a trading name of BDS Markets and BDS Ltd.
BDS Markets is a company incorporated under the laws of the Republic of Mauritius and is authorized and regulated by the Financial Services Commission of Mauritius ( FSC ) under license number C116016172, address: 6th Floor, Tower 1, Nexteracom Building 72201 Ebene.
BDS Ltd is authorized and regulated by the Financial Services Authority Seychelles (FSA) under license number SD047, address: Suite 3, Global Village, Jivan’s Complex, Mont Fleuri, Mahe, Seychelles. Payment transactions are managed by BDS Markets (Registration number: 143350)
Disclaimer

JPM Paths Before EarningsA new earnings season is kicking off this week with a lot of banks reporting Friday. I doubt I'll trade any banks, but I think it's important to monitor. JPM looks bearish to me despite the recent breakout. It had a fakeout above its ascending wedge and is now threatening to break below which could send it back down for a retest of the previous bull flag breakout.
#202427 - priceactiontds - weekly update - JPMGood Day and I hope you are well.
JP Morgan / NYSE:JPM
comment: Clear bull wedge, which means buyers at new highs taking profits and since it's the third push up, the probability of a two legged correction breaking below the wedge is decent. Market touched the weekly 20ema 2 times over the past 3 months and the third time will probably happen soon. We also have a decent rejection at 210, which gives you even better odds for a short. I do think longer term shorts can work well, if you can hold 4-6 months until price reaches 185ish. Quicker short for 195, which is the most recent breakout price, is the safer play obviously. Once market hits the C target, I expect a lower high and then some stronger down move to below 190 over the next 6-12 months.
current market cycle: Bull trend which transitions into a trading range.
key levels: 190 - 210
bull case: Bulls see this recent bull trend inside the wedge as strong enough for a third leg. A measured move from W3 would lead to 220. For that to happen they want to stay inside the tight bull channel and turn the market around here quickly. I do think if it drops below 200, that bull trend is over and the high is in or at least a double top would not exceed it by more than 1-3$.
Bull Invalidation is below 200.
bear case: Bears want to keep the upper wedge line as resistance and test back down to the lower one around 196ish. They sold the previous highs for a 10% and a 7% drop. 10% down would bring us to 190, which is suprisingly around the weekly 20ema. Coincidences or math? You decide for yourself.
Bear Invalidation is above 215.
short term: bearish - Two legged correction to at least 200 over the next weeks.
medium-long term: bearish - Trading range 180-200, since we are at the highs, longer term shorts are reasonable.
current swing trade: Short 205, sl 215, tp 200ish or the lower bull wedge line/weekly 20ema
Have a good rest of your weekend and talk to you soon.
If you enjoy my writings, please leave a boost or follow.
Thank you and I wish your trading to be profitable.

JPMorgan Chase Stock Dip: An Opportunity Amidst the NumbersIn the wake of last week's unexpected setback for JPMorgan Chase's stock, investors are presented with a perplexing narrative. Contrary to expectations, the banking giant refrained from revising its 2024 revenue guidance, leading to a notable 6% drop in share price. Yet, beneath this seemingly negative surface lies a compelling investment opportunity, driven by robust performance metrics and strategic positioning within the financial sector.
Despite the initial market reaction, JPMorgan Chase's first-quarter results surpassed expectations, with impressive revenue and per-share profit figures. While the lack of upward revision to net interest income guidance caused temporary turbulence, a deeper analysis reveals several positive indicators supporting a bullish outlook.
Notably, JPMorgan Chase has outperformed its competitors in key areas, including loan losses, interest income growth, and revenue diversification. The bank's proactive measures to optimize its balance sheet and enhance fiscal flexibility further underscore its resilience in the face of market challenges.
Moreover, the company's solid financial foundation, highlighted by robust return on equity metrics, distinguishes it as a top performer within the industry. Compared to peers, JPMorgan Chase's profitability remains unmatched, reflecting its ability to deliver consistent shareholder value over the long term.
While market dynamics and external factors may influence short-term stock movements, the intrinsic strength of JPMorgan Chase as a company remains steadfast. As such, the recent dip in share price presents an attractive entry point for investors seeking exposure to a leading player in the financial sector.
In conclusion, JPMorgan Chase stands as a beacon of stability and profitability in an ever-evolving market landscape. The recent downturn in stock price offers investors an opportunity to capitalize on the company's enduring strength and potential for future growth. As always, prudent investors should conduct thorough due diligence and consider their investment objectives before making any decisions.


Would you bet on financial stocks?From a valuation perspective, JPMorgan Chase & Co. is currently exchanging hands at a Forward P/E ratio of 12.2. For comparison, its industry has an average Forward P/E of 11.05, which means JPMorgan Chase & Co. is trading at a premium to the group.
The company's earnings report is set to go public on July 12, 2024. The company's upcoming EPS is projected at $4.17, signifying a 4.58% drop compared to the same quarter of the previous year.

Downtrend Channel BreakoutJPM has a downward channel and I plan to buy the breakout. If the price becomes greater than 198, I will play for a large breakout move on the channel.
If this bounces down tomorrow, then I will have to move the entry price lower or invalidate this setup.
Buy to open = $198
1st Profit Target = $205
Stop Loss = $194

Watch This 3 Step System And Technical AnalysisInside this video i dive deep into technical analysis
mixing advanced lessons and beginner lessons
to give you a taste of advanced technical analysis and beginner-level analysis
You will need to buckle up and sit tight as we ride through the forex market, banking market, and stock market
This video is packed with tones of value and it's a thank you for rocketing this content
to learn more rocket boost this content
Disclaimer: Trading is risky you will lose money whether you like it or not please learn risk management

Revisiting March 2021 low for JPMIt is highly likely beside closing the gap as shown in the chart, if the overall market did not show any bullish signs, then we can expect this stock, JPM to to revisit the March 2021 low once more. From there, it will consolidate for a while before we see any rebound.

JPM looking spicyJPM has excellent greater market confluence to support its forecast, which in our opinion, puts the odds in your favor. That said, catching tops and bottoms can be risky, while selling covered calls for stock holders may be the safer way to get exposure.

JP Morgan: Possible Correction Between 205.5 - 216JP Morgan: Possible Correction Between 205.5 - 216
The price already completed a Bearish BAT Pattern.
JP Morgan is still strong but the current potential reversal zone of the Harmonic Pattern is showing that we can be near to a bearish correction.
However, the price is required to develop more before it moves down at this moment considering
the bullish trend.
Immediate support will be found near the target areas 180; 165 and 140
You may find more details in the chart!
Thank you and Good Luck!
❤️PS: Please support with a like or comment if you find this analysis useful for your trading day❤️

JPM short term top comingOnce 210 zone is reached, we should look for a meaningful pullback toward the 177 zone, followed by a run to new highs.

JPM eyes on $193.50: major support going into EarningsJPM is sitting on a Golden Genesis fib.
Earnings to be reported today afterhours.
Launch pad here? or fail and mark the top?
$ 193.50 - 194.69 is the immediate support.
$ 176.07 - 176.37 is first good support below.
$ 206.20 - 207.37 first resistance just above.
========================================

Buybacks vs. Rotation: JPM and AAPLMany companies are flush with cash right now, so buybacks are going to increase. Buybacks can create plenty of swing trading opportunities.
Buybacks are used by the Board of Directors to drive price upward, or at least maintain price at a certain level. They also remove outstanding shares from public exchanges. The Percentage of Shares Held by Institutions (PSHI) is based on outstanding shares. So with fewer shares outstanding, it can help PSHI hold at a certain level. The Buy Side has been lowering inventory this year. See red arrows on the JPM chart.
In 2018, Buybacks boosted the index components and kept the market from continuing a bear market, which was already underway--a minor bear not a major one. Then in 2019, buybacks surged as the government cut corporate taxes massively. The cash on hand was enormous for most companies so they did mega buybacks, leading the move upward for index components that year. Then, in 2020 the pandemic stock market collapse completed that very odd delayed bear market.
Buyback candles are frequently solid white without wicks or tails. Buybacks often initiate strong swing-style runs, such as they have in $NYSE:JPM. See the blue arrows.
NASDAQ:AAPL also announced a huge buyback program in early May. This gives the Buy Side Institutions the opportunity to lower inventories of AAPL too, without disturbing price much, if at all. AAPL is in a sideways trading range, which is a tough pattern to trade since there is no consensus about what the company is doing to fuel future growth.

JPMorgan Chase Faces Potential ReversalJPMorgan Chase hit a record high on Monday morning but failed to hold. Now some traders may worry about a potentially bearish reversal.
The first pattern on today’s chart is the high-volume drop on May 20, which erased the previous seven sessions of gains. That could be interpreted as a false breakout. (Bearish outside candles also appeared on both the daily and weekly charts.)
JPM next tried to rebound but stalled near $201. That matches April’s monthly peak and the 50 percent retracement of the drop. Those points may confirm price action is getting less positive.
Third is the rising trendline along the lows of April and early May. If this line fails, will traders next brace for a potential retest of last month’s support?
Finally, the drop occurred amid the megabank’s 2024 Investor Day. The event had some potential negatives, like CEO Jamie Dimon saying the company will wait for lower prices before buying back stock. CFO Jeremy Barnum also suggested profitability could weaken later this year.
TradeStation has, for decades, advanced the trading industry, providing access to stocks, options and futures. See our Overview for more.
Past performance, whether actual or indicated by historical tests of strategies, is no guarantee of future performance or success. There is a possibility that you may sustain a loss equal to or greater than your entire investment regardless of which asset class you trade (equities, options or futures); therefore, you should not invest or risk money that you cannot afford to lose. Online trading is not suitable for all investors. View the document titled Characteristics and Risks of Standardized Options at www.TradeStation.com . Before trading any asset class, customers must read the relevant risk disclosure statements on www.TradeStation.com . System access and trade placement and execution may be delayed or fail due to market volatility and volume, quote delays, system and software errors, Internet traffic, outages and other factors.
Securities and futures trading is offered to self-directed customers by TradeStation Securities, Inc., a broker-dealer registered with the Securities and Exchange Commission and a futures commission merchant licensed with the Commodity Futures Trading Commission). TradeStation Securities is a member of the Financial Industry Regulatory Authority, the National Futures Association, and a number of exchanges.
TradeStation Securities, Inc. and TradeStation Technologies, Inc. are each wholly owned subsidiaries of TradeStation Group, Inc., both operating, and providing products and services, under the TradeStation brand and trademark. When applying for, or purchasing, accounts, subscriptions, products and services, it is important that you know which company you will be dealing with. Visit www.TradeStation.com for further important information explaining what this means.

JP Morgan : Possible Correction Between 205.5 - 216JP Morgan: Possible Correction Between 205.5 - 216
The price already completed a Bearish BAT Pattern.
JP Morgan is still strong but the current potential reversal zone of the Harmonic Pattern is showing that we can be near to a bearish correction.
However, the price is required to develop more before it moves down at this moment considering
the bullish trend.
Immediate support will be found near the target areas 180; 165 and 140
You may find more details in the chart!
Thank you and Good Luck!
❤️PS: Please support with a like or comment if you find this analysis useful for your trading day❤️

SPX500 (SPDR TRUST) 10 YEAR MOONOh great, looks like we're in for a hard reset. NYSE:JPM short, SPX500 long.
Love,
dysonring2050

JPM Weekly to $210JPM setup looks solid and shows bull strength. Where are they taking it?...
NFA, let's see.

~12x Risk:Reward Spotted on JP Morgan CHASE 5 YEAR 2x PlayRead the chart
Golden ratio mathers have their time up, it's time to fly LONG XAUUSD LONG JP MORGAN CHASE
Take entry now with wide 20% SL or read my chart it doesn't matter 1x or 5x it's freaking 12-60x time ;)
Love,
dysonring2050
P.S.S I am never wrong. The trades just take awhile to play out.
