4LLY trade ideas

Another 50% ExampleThe beauty of studying price action is that a trader can apply their skills to ANY instrument, timeframe, and market. Just as the 50% retracement works in cryptocurrency it of course works in stocks. This happens to be a trade that I was able to catch. It took more than a day to trigger when NYSE:LLY pulled back to the 50% retracement for a 4th time. A very clear level for an entry and set point of risk makes for a great trade off the level!

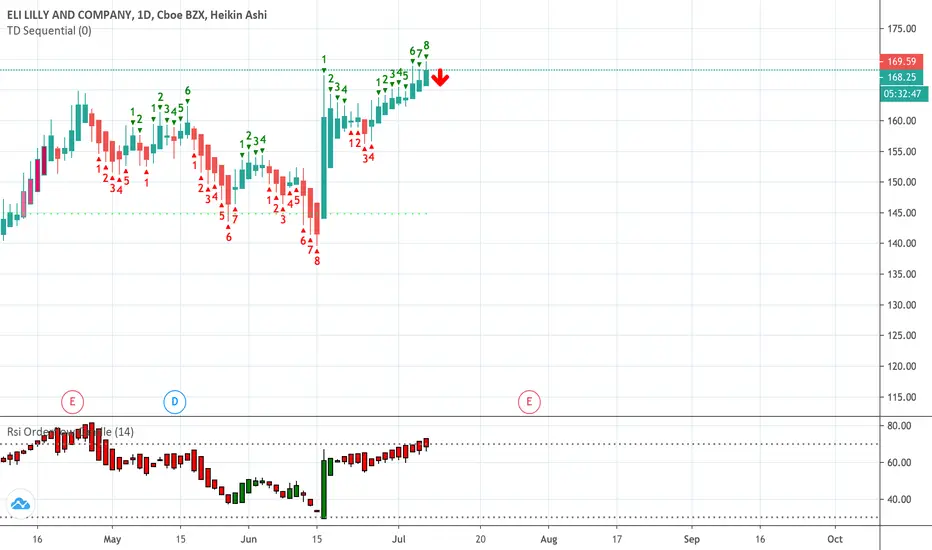
#LLY: Fractals and Future ZonesExamining the 1 Day chart, I found a potential fractal in the making. If the recent vaccine news and contracts are motivators for upward motion, then I’ve marked out zones for potential option strikes that could work their way into the money.
With confirmations off key fib areas, and the RSI about to backtest the 50% zone, this could be a runner over the next couple of weeks. Key support and resistance is clear and consistent.
Not financial advice chumps.

LLY Long, Gap into demandAfter sideway Consolidation;
Gap into demand.
Price is near the distal line .
Entry 134
Stop 132
Target1 157; reward:risk=11:1
Earning date 10/27/2020 6 AM
I am not a PRO trader. I need few months to practice trading strategies.
If you like this idea, please use SIM/Demo account to try it, until my trading plans get high winning rate.


LLY Neutral, Sell put at next supportLong term uptrend
Sideway, near bottom
Trendline break and re-test.
Stock trader needs to wait. 10/27/2020 Earning, it may gap to the demand zone.
Entry 142
Stop 139
Target 157; reward:risk=5:1
Option trade: Sell put at next support price.
Close this position before 10/27/2020 Earning.
I am not a PRO trader. I need few months to practice trading strategies.
If you like this idea, please use SIM/Demo account to try it, until my trading plans get high winning rate.

LLY October 2020PT $164 if it holds above $158. Oversold, but still bullish due to trump tweet to fast-forward vaccine and 50 SMA crossing 200 SMA.


LLY filling the GAPLooking for this to drop just a little more to fill the gap mid 140's is a buying opportunity

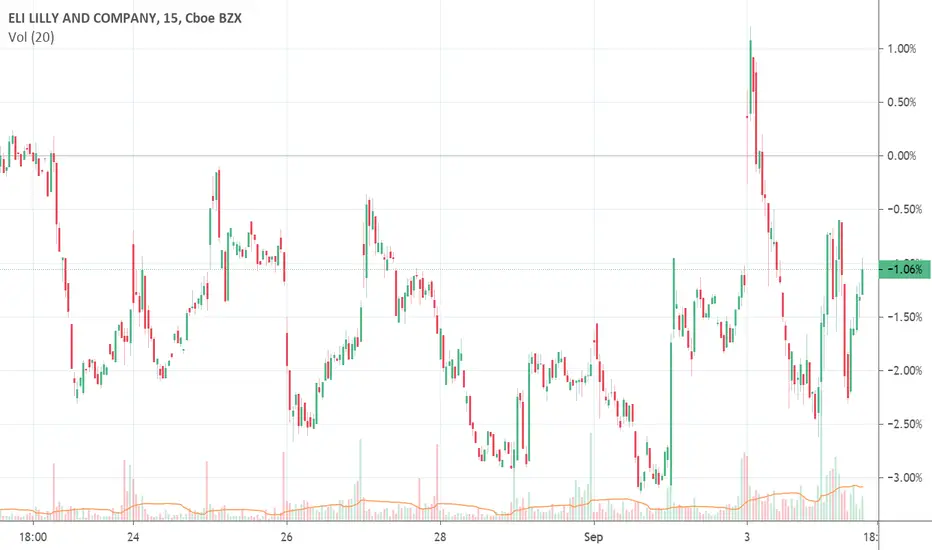
FDA approves additional doses of Trulicity® (dulaglutide) for thLLY: Eli Lilly and Company
2020-09-03 17:12:00
FDA approves additional doses of Trulicity® (dulaglutide) for the treatment of type 2 diabetes
daily analysis of ELI LILLY AND COMPANYHi friends
the daily chart of this market shows with a high probability a downtrend in the coming days but at the same time it is better to be vigilant of the change of direction towards the opposite please subscribe to receive more analysis

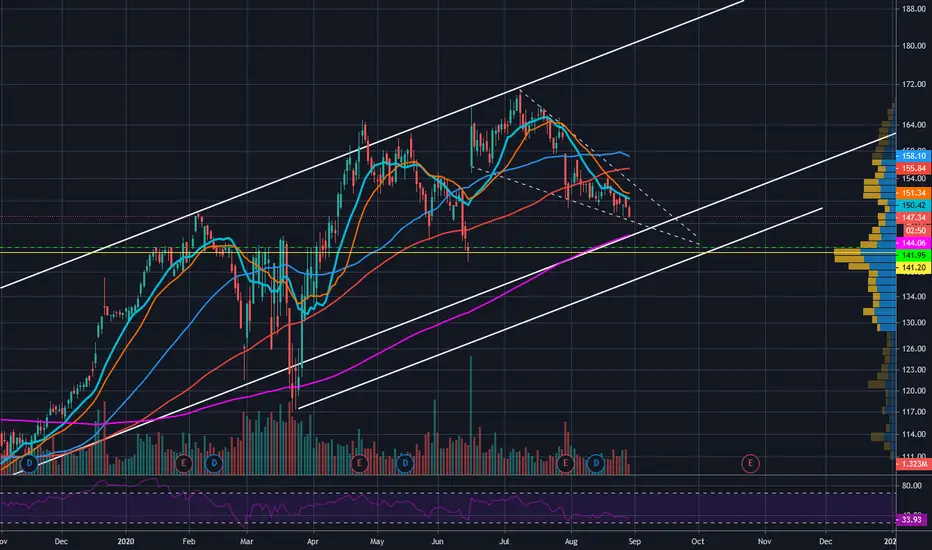
$LLY falling wedge$LLY is starting to looking interesting, in a nice big falling wedge coming into the 200dma with a gap fill just below and supporting volume price profile.
LLY - Monthly Support (19/8/20)Sideway between weekly support and monthly ressistance. Potential breakout?


Rising WedgeLLY has broken bottom trend line of it's latest rising wedge pattern and has dipped a ways since she fell out
There are multiple rising wedges since the flu hit this stock. There is a green volume spike when LLY dipped down to 140ish
Earnings are not until October.
I am watching for now

Eli Lilly and Co+ experts and j.p. morgan predict 180-190 price target
+ technically good entry point with 3:1 r/r ration
- technically in the bubble and overvalued
- ending diagonal pattern with triple divergence, so we can fall much lower
Considering buy with close stops


daily analysis of ELI LILLY AND COMPANY hello my friends
the one hour chart of this market that it will experience a downtrend with the vigilance to take into account the stop loss to be determined on the graph
thank you for subscribing to have more analyzes