MRNA RetestMRNA has retested support around the 156 area and showed a bullish close on the hourly/4hour/daily charts. The range here is 156 to 184. MRNA had a healthy pullback to support and now looks to continue upward in the range.
4MRNA trade ideas

MRNA SELLMRNA overbought on couple indicators on various time frame charts chart has long term support and long term resistance looking for a correction back to cloud support of $150 range. Purchased August 12 $175 puts will add if needed

Moderna NASDAQMRNA NASDAQ looking good, weekly close above confirmed trend line.
Confirm buy $190 above previous peak due to resistance at $179 area.

MRNA SHORT - A THING OF BEAUTYPURE Nature.....
Just follow nature
The Fib is as natural as one can get...

MRNA GOLDEN SHORTYou don't see beauty like this very often!!! Take advantage!!!
Flow and Algo support this move, Charts support this move, News and Politics support this move. Massive H&S, Same Pattern.....
R/R perfect.... DROP IT
I am ALL IN

MRNA-SELL strategyThe stock already has been testing little higher and subsequent movement lower has moved stochastic in negative territory amidst a high RSI.
It feels we may see a test of $ 155.00 area near the GANN support is my personal view.

WATCH MRNA Bullish
Fundamental
- High inflationary Macro environment / No fear sentiment
- Funds Accumulation
- Positive PE
- PEG
- Positive P/FCF
- Strong Sector / Industry / Leader
- Misc thoughts : looks like biotech is hot
Technical
- Momentum Theory Indicator - momentum bottomed and broke out
- Price action formation ( falling wedge )
- Broke Trend line / neckline pressure
- Under 200MA
- Above POC
- Under ST
- Engulfing Candlestick Broke out followed through
Entry idea
- For members
Stop loss depending on entry and risk appetite. But always set meaningful stops.
" Giving up is hard. Pushing through the struggle is hard. Choose your hard "
Cheers and happy trading!

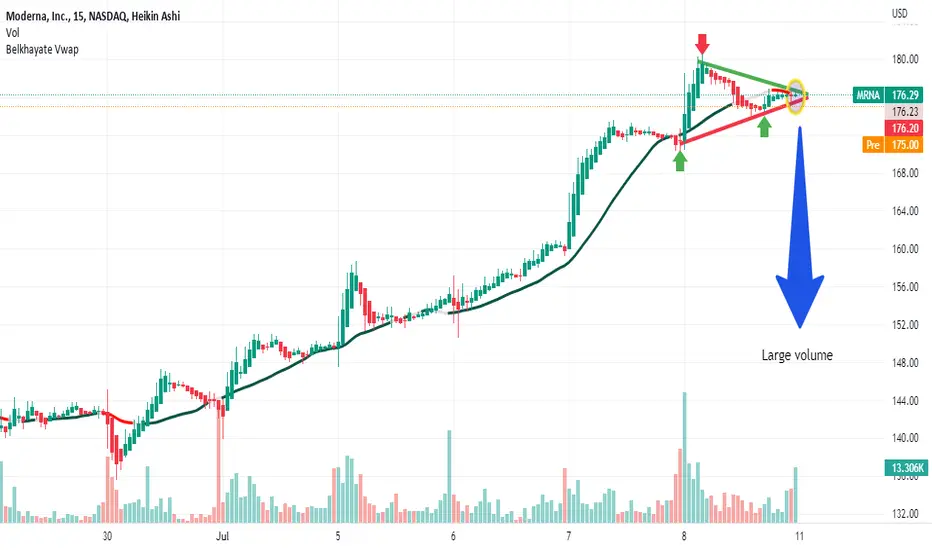
illustrationHere we have a downtrend after a breakout of the vwap and the support line with force by a big candle with a large volume .thanks.

analysisOn this action, we are already in an uptrend and we will not go against this trend. But we will keep a close eye on a high downtrend probability ie the breakout of the support line as well as the strong vwap followed by large volume. Indeed, it must be said, here the support line is more important than that of the resistance. But, if the resistance line also comes to be broken with force as well as the vwap followed by a large volume, it goes without saying that we would have a continuity of the said trend, namely bullish. thank you for your attention.
MRNA...Man, I mean look at this... self explanatory. The Wall St. Cheat sheet is pretty much identical to this Moderna chart. Ran up on Covid vaccines, but actually is a solid Biotech Pharma company that actually makes money. Good time to buy IMO.

MODERNA Long - 8 Jul 2022MODERNA Long
Entry: 172.40
Take profit: 250.10
Stop loss: 136.93
Risk/reward: 2.19

MRNA - breakout after baseBreaking out from base and moved above key pivot - early entry here and accumulation

Moderna break of flag and retest of flag breakout area As you can clearly see the break down of the bear flag on the daily timeframe . once breakout it wanted to retest the flag breakout area by forming ascending wedge pattern which is bearish. And also on daily time frame on the top resistance area 147 to 149 , it has created rejection wick candle as we can see it is clearly rejected at the area and wedge has already breakout . the 138 139 area support need to be break in order to come down more to 132 and 126 area respectively . GOOD r/r ratio at this point . the stop loss should be break of resistance or long time frame channel. Note : please be extra careful while playing health sector therefore . i hope this chart helps .

Shooting Star on Moderna? Moderna
Short Term
We look to Sell at 146.42 (stop at 154.23)
Preferred trade is to sell into rallies. Price action has posted a bearish Shooting Star and is negative for short-term sentiment. Trades with a bearish descending triangle formation. Our overall sentiment remains bearish looking for lower levels. The bias is still for lower levels and we look for any gains to be limited.
Our profit targets will be 122.21 and 94.19
Resistance: 150.00 / 171.76 / 187.50
Support: 120.00 / 100.00 / 66.41
Disclaimer – Saxo Bank Group. Please be reminded – you alone are responsible for your trading – both gains and losses. There is a very high degree of risk involved in trading. The technical analysis, like any and all indicators, strategies, columns, articles and other features accessible on/though this site (including those from Signal Centre) are for informational purposes only and should not be construed as investment advice by you. Such technical analysis are believed to be obtained from sources believed to be reliable, but not warrant their respective completeness or accuracy, or warrant any results from the use of the information. Your use of the technical analysis, as would also your use of any and all mentioned indicators, strategies, columns, articles and all other features, is entirely at your own risk and it is your sole responsibility to evaluate the accuracy, completeness and usefulness (including suitability) of the information. You should assess the risk of any trade with your financial adviser and make your own independent decision(s) regarding any tradable products which may be the subject matter of the technical analysis or any of the said indicators, strategies, columns, articles and all other features.
Please also be reminded that if despite the above, any of the said technical analysis (or any of the said indicators, strategies, columns, articles and other features accessible on/through this site) is found to be advisory or a recommendation; and not merely informational in nature, the same is in any event provided with the intention of being for general circulation and availability only. As such it is not intended to and does not form part of any offer or recommendation directed at you specifically, or have any regard to the investment objectives, financial situation or needs of yourself or any other specific person. Before committing to a trade or investment therefore, please seek advice from a financial or other professional adviser regarding the suitability of the product for you and (where available) read the relevant product offer/description documents, including the risk disclosures. If you do not wish to seek such financial advice, please still exercise your mind and consider carefully whether the product is suitable for you because you alone remain responsible for your trading – both gains and losses.

WATCH $MRNABullish
Fundamental
- Funds accumulating but not massive
- Good earnings
- Positive PE
- Positive P/FCF
TA
- Momentum theory valid
- Momentum theory indicator
- POC level established
- Price out of the wood of downtrend
Pending trigger

Is Moderna Squeezing Toward a Breakout?Vaccine developer Moderna had a dramatic rally in 2021, at one point more than quadrupling from its low to high. Now, after an equally dramatic pullback, it may be flashing some interesting signs to the bulls.
The first pattern on today’s chart is the $117.34 level. MRNA held that price in late March 2021 and again this month. That may suggest old support remains in effect.
Second is the series of lower highs since late March 2022 as prices held those lows. The result is a descending triangle with breakout potential.
Third, the falling trendline closely matches the 50-day simple moving average (SMA). MRNA closed above that line yesterday – another potential sign its direction is changing.
Finally you have the recent strength in biotechnology stocks. The industry has gained about 9 percent in the last month compared with the S&P 500’s 5 percent drop.
Important Information
TradeStation Securities, Inc., TradeStation Crypto, Inc., and TradeStation Technologies, Inc. are each wholly owned subsidiaries of TradeStation Group, Inc., all operating, and providing products and services, under the TradeStation brand and trademark. You Can Trade, Inc. is also a wholly owned subsidiary of TradeStation Group, Inc., operating under its own brand and trademarks. TradeStation Crypto, Inc. offers to self-directed investors and traders cryptocurrency brokerage services. It is neither licensed with the SEC or the CFTC nor is it a Member of NFA. When applying for, or purchasing, accounts, subscriptions, products, and services, it is important that you know which company you will be dealing with. Please click here for further important information explaining what this means.
This content is for informational and educational purposes only. This is not a recommendation regarding any investment or investment strategy. Any opinions expressed herein are those of the author and do not represent the views or opinions of TradeStation or any of its affiliates.
Investing involves risks. Past performance, whether actual or indicated by historical tests of strategies, is no guarantee of future performance or success. There is a possibility that you may sustain a loss equal to or greater than your entire investment regardless of which asset class you trade (equities, options, futures, or digital assets); therefore, you should not invest or risk money that you cannot afford to lose. Before trading any asset class, first read the relevant risk disclosure statements on the Important Documents page, found here: www.tradestation.com .

MRNA - Shorting Again
This looks like good place to short - we have negative divergence and its at the top of its recent range. There is a larger Triangle we're working in.
Look to sell at the bottom of this range.
Postilion taken via options.
Why this company? See link below.

Moderna Progress on all VaccinesThe statistics are between $184 - $219(1 Year)
Its Financial Health is very strong.
Why not wait till Moderna makes greater progress and finds It
Resistance Again at $450
Moderna has many projects running.
So if we see progress in some of the projects in the next Years,
we will see a great price rise.
I believe it won't be difficult to reach its older resistance again, around $450.
Disclaimer:
Just my Idea! Find your Trading Ideas and learn and study more!

MRNA - More Fib WavesFib waves idea linking relevant information about my idea below
Similar areas are within corresponding colors

Feeling sick? (Moderna)Moderna
Short Term
We look to Sell at 133.52 (stop at 141.88)
Preferred trade is to sell into rallies. Prices expected to stall near trend line resistance. Trades with a bearish descending triangle formation. Our overall sentiment remains bearish looking for lower levels. The bias is still for lower levels and we look for any gains to be limited.
Our profit targets will be 105.41 and 94.19
Resistance: 150.00 / 171.76 / 187.50
Support: 116.00 / 100.00 / 66.41
Disclaimer – Saxo Bank Group. Please be reminded – you alone are responsible for your trading – both gains and losses. There is a very high degree of risk involved in trading. The technical analysis , like any and all indicators, strategies, columns, articles and other features accessible on/though this site (including those from Signal Centre) are for informational purposes only and should not be construed as investment advice by you. Such technical analysis are believed to be obtained from sources believed to be reliable, but not warrant their respective completeness or accuracy, or warrant any results from the use of the information. Your use of the technical analysis , as would also your use of any and all mentioned indicators, strategies, columns, articles and all other features, is entirely at your own risk and it is your sole responsibility to evaluate the accuracy, completeness and usefulness (including suitability) of the information. You should assess the risk of any trade with your financial adviser and make your own independent decision(s) regarding any tradable products which may be the subject matter of the technical analysis or any of the said indicators, strategies, columns, articles and all other features.
Please also be reminded that if despite the above, any of the said technical analysis (or any of the said indicators, strategies, columns, articles and other features accessible on/through this site) is found to be advisory or a recommendation; and not merely informational in nature, the same is in any event provided with the intention of being for general circulation and availability only. As such it is not intended to and does not form part of any offer or recommendation directed at you specifically, or have any regard to the investment objectives, financial situation or needs of yourself or any other specific person. Before committing to a trade or investment therefore, please seek advice from a financial or other professional adviser regarding the suitability of the product for you and (where available) read the relevant product offer/description documents, including the risk disclosures. If you do not wish to seek such financial advice, please still exercise your mind and consider carefully whether the product is suitable for you because you alone remain responsible for your trading – both gains and losses.

Long IdeaMRNA is at a very strong demand zone on the daily. Looking to long if it holds and ride it up to the next zone

Moderna - My Favorite Short
Once again shorting Moderna . Sold it at $148.43 through options. It was 100% Fib retracement.
CEO Bancel admits in this video on Twtter they literally throwing out vaccines, kid you not.
$MRNA just threw out 30 Million vaxs : twitter.com
Pfizer is now selling vaxs to the 45 poorest countries now at cost just announced in Davos at the WEF .
My reasons for shorting this company are in the linked chart at the bottom.
Likely get a chance to short it Monday at the open.

Moderna in trouble? Moderna
Short Term - We look to Sell at 149.49 (stop at 160.31)
Preferred trade is to sell into rallies. Closed below the 20-day EMA. Trades with a bearish descending triangle formation. Our overall sentiment remains bearish looking for lower levels. We look to set shorts in the early trade.
Our profit targets will be 123.84 and 103.50
Resistance: 150.00 / 171.76 / 187.50
Support: 125.00 / 120.00 / 104.00
Disclaimer – Saxo Bank Group. Please be reminded – you alone are responsible for your trading – both gains and losses. There is a very high degree of risk involved in trading. The technical analysis, like any and all indicators, strategies, columns, articles and other features accessible on/though this site (including those from Signal Centre) are for informational purposes only and should not be construed as investment advice by you. Such technical analysis are believed to be obtained from sources believed to be reliable, but not warrant their respective completeness or accuracy, or warrant any results from the use of the information. Your use of the technical analysis, as would also your use of any and all mentioned indicators, strategies, columns, articles and all other features, is entirely at your own risk and it is your sole responsibility to evaluate the accuracy, completeness and usefulness (including suitability) of the information. You should assess the risk of any trade with your financial adviser and make your own independent decision(s) regarding any tradable products which may be the subject matter of the technical analysis or any of the said indicators, strategies, columns, articles and all other features.
Please also be reminded that if despite the above, any of the said technical analysis (or any of the said indicators, strategies, columns, articles and other features accessible on/through this site) is found to be advisory or a recommendation; and not merely informational in nature, the same is in any event provided with the intention of being for general circulation and availability only. As such it is not intended to and does not form part of any offer or recommendation directed at you specifically, or have any regard to the investment objectives, financial situation or needs of yourself or any other specific person. Before committing to a trade or investment therefore, please seek advice from a financial or other professional adviser regarding the suitability of the product for you and (where available) read the relevant product offer/description documents, including the risk disclosures. If you do not wish to seek such financial advice, please still exercise your mind and consider carefully whether the product is suitable for you because you alone remain responsible for your trading – both gains and losses.
