Strategy Hit SupportMSTR should easily hold $246 and make its way back up to $418 and form it's next support there.
Good luck!
4MSTR trade ideas

MSTR Short TargetsMSTR is finally beginning to fall now, about 45% off the ATH from only one month ago. We had a good example of what buyer exhaustion looks like with the dramatic reversal and volume spike at ATH. It has been rolling over ever since but finally broke $371 and accelerated. Now I'm watching the gap fill just below $280 for a target.
Next would be all the way back to previous ATH at $200, which is still a 30% drop away from here so not saying it hits immediately. That would put it back to the start of the cup and handle breakout as well so that area has the most interest for me in the longer term.

MicroStrategy The Next levels for Long positionsI have outlined the next important Levels for MSTR Longs using a suite of Fib tools . If you find value in my work then support me with a like/share/comment.

MSFT MicroStrategy Update Quick update on the move to the downside that we had been expecting . Sharing my thoughts on what next.

Microstrategy Enters "The Valley of Risk"A term I have coined, "The Valley of Risk", describes a price chart which has had a prior very strong bullish trend, pulls back to its 50% Retracement Support, and then fails to hold it... entering a long, grinding, bearish deflation which coincides with the heavy negative emotion being felt by those still holding the bag.
Inside the "Valley of Risk" nothing one does is correct:
If you sell... it will bottom and rally
If you buy... it will continue down
If you baghold... it will continue to go down until you cannot stand it and #1
This is just a pattern of human emotion being reflected on a price chart... which is what price charts ultimately are. It is best to avoid going into the Valley of Risk and have strict rules against bagholding. Deploy your capital elsewhere that there is a better potential rate of return.
When I teach about this concept I always look back to Zillow NASDAQ:Z . This was a stock I bought "on a dip" at 111 and made the right decision to sell my position at a loss at 102 when the stock price violated the 50% Support. This allowed me to avoid the horrible Earnings miss gap and the final -74% depreciation. My position still would not have recovered as of writing.
As I published months ago, it became clear to me that the over exuberance and fancy financial buzz words being thrown around about NASDAQ:MSTR were signs of a ponzi about to collapse. Well, the "Bitcoin nuclear reactor" has cooled and the leverage baked into Microstrategy would be its downfall. That has now come to pass. There are some other interesting elements of price action which have been textbook in this decline that I want to talk about in this post.
The 50% Retracement:
The operative level for the last 3 months has been 328. This is the 50% Retracement of the YOLO rally. In the pullback from the ATH 440 became the 50% Retracement Resistance.
The Ichimoku Cloud Breakout Confirmed:
The other textbook setup was when the Ichimoku Cloud Breakout was confirmed by the Lagging Span entering clear bearish space after price had exited the cloud. Interestingly, this happened at the same exact day as Bitcoin; last Friday. You can read more about this strategy and my 14 year study of how effective it is in my recent Ideas:
So what now?
That is the eternal question of "The Valley of Risk". There is never a good answer because the technical supports have been broken.
Personally though I need to answer this question for my bearish positions. The most logical point to look would be the Volume Profile POC at 165. However, Microstrategy is going to move concurrent to Bitcoin itself and knowing the past bearish cycle patterns this week, through brutal, will find a bottom. I do not believe it will be the final bottom only that price may hesitate at some point for perhaps even a month.
My trade management
This week I will be selling premium against my long Puts, which go out to 2027, to offset my Theta while still remaining short Delta.

4 weeks of accumulation !! oh boy its about to get spicy soon, I am bearish and the chart looks so good but sometimes when its too obvious it doest work out or wait till im not watching and give us a nice leg to 280. I don't care about buying but if it breaks under 309 and the bulls don't step up.... flush

probable target zoneBased historical breakdown, see depicted probable target area. Bull will want that moving average to hold.

MSTR MSTR is out of room time to place your bets. We will either starting moving higher from here to complete the 5th wave or double correct to 175ish on a slow grind down. My bet is up.
Good Luck
Stop loss at $285
NASDAQ:MSTR

Resistance is getting weakeron hourly chart the resistance is very weak. and A/D is showing that info..
Unless something really bad happens and entire market shakedown via some news
this is heading up to 460 area very very soon...
-->March/20

Mstr bullflag with bottomMstr bullflag with bottom
I bought big at 306$ 5x leverage mstr stock on etoro.

MSTR 7 day bull targetMSTR finally had a breakout on its long forming symmetrical wedge/riangle on Friday 2/14/2025.
5 day target = $365
10 target = $380
14 day target = $400+

Key Zones and Levels1) 2023: The price started to accumulate from
the end of Q2 to the middle of Q4 in 2022.
Then, at the end of Q4, the price broke below
the range, swept a weekly low from May 9,
2022, and utilized the weekly IFVG from March 9, 2020.
The price is currently in a monthly MMBM.
2) The CE of the weekly gap has rejected the price.
My final target for the monthly MMBM is around $667.
Currently, I am monitoring the $285–$380 area on the Daily and H1 timeframes.

$MSTR ONCE IN A LIFETIME Fibonacci PyramidBuys: 196.69 to 322.70 Target 662🎯
We have a TIGHT triple inside BAR forming on the MONTHLY this is Extremely Rare and Ready for a MASSIVE BREAKOUT
I plan to automate LEAPS and sell PUTS step by step all will be here DROP A LIKE!

Probably nothing... on MSTRMicroStrategy vs. CMC Crypto Fear & Greed Index.
Grean arrows represent fear area on this index.
Probably nothing... 👀

MSTR bull flag mstr bull flag about to pump again makes infinite billionaires with hard leverage from here 300$ stop

MicroStrategy (MSTR) AnalysisCompany Overview:
MicroStrategy NASDAQ:MSTR combines business intelligence solutions with a Bitcoin-focused investment strategy, holding 471,107 BTC (~$18B) as of now. The company has made significant strides in Bitcoin accumulation, positioning itself as a leveraged play on Bitcoin’s price appreciation.
Key Catalysts:
Aggressive Bitcoin Accumulation 📈
MicroStrategy continues to expand its Bitcoin holdings, raising $563M through an 8% Series A Preferred Stock offering to buy more BTC.
The "21/21" Plan 💡
This plan aims to raise $42B over three years, positioning MSTR as a strategic Bitcoin growth bet.
Indirect Bitcoin Exposure for Institutions 💰
With regulatory uncertainty around Bitcoin ETFs, MSTR offers a secure method for institutional investors to gain exposure to Bitcoin through equity.
Investment Outlook:
Bullish Case: We are bullish on MSTR above $295.00-$300.00, reflecting its Bitcoin-centric strategy and institutional adoption.
Upside Potential: Our price target is $600.00-$620.00, driven by continued Bitcoin accumulation and the growth of institutional interest in crypto exposure.
📢 MicroStrategy—The Bitcoin-Business Intelligence Hybrid. #Bitcoin #CryptoExposure #MSTR

MicroStrategy’s Premium Is Fading – Time to Brace for a Drop?The strong optimism following Trump’s election in November fueled a Bitcoin rally, which in turn led to a massive surge in MicroStrategy’s ( NASDAQ:MSTR ) stock.
However, after reaching an all-time high near $550, MSTR experienced a sharp decline. Interestingly, despite Bitcoin hovering around $100K and even attempting a new ATH recently, this momentum hasn’t been reflected in MSTR’s stock price.
From a technical perspective, the price has broken below its ascending trendline and is now consolidating between $320 and $360.
Given the unjustified premium (at least in my opinion), I expect further downside for the stock.
Additionally, if Bitcoin fails to hold the key $90K confluence support, MSTR could see a sharp plunge below $200.

MSTR TO ALL TIME HIGHS - CRYPTO 2025 ROCKETEvidently, it has come to our attention that after MSTR's split, and the recent sell off, we're likely to see some consolidation on MSTR for the short term but likely to increase in value due to number of bitcoins strategically bought and how the price of bitcoin will fuel the pump of MSTR. Happy Halloween/Happy Valentines.
Non-financial advice. Gamble at your own risk and discretion.

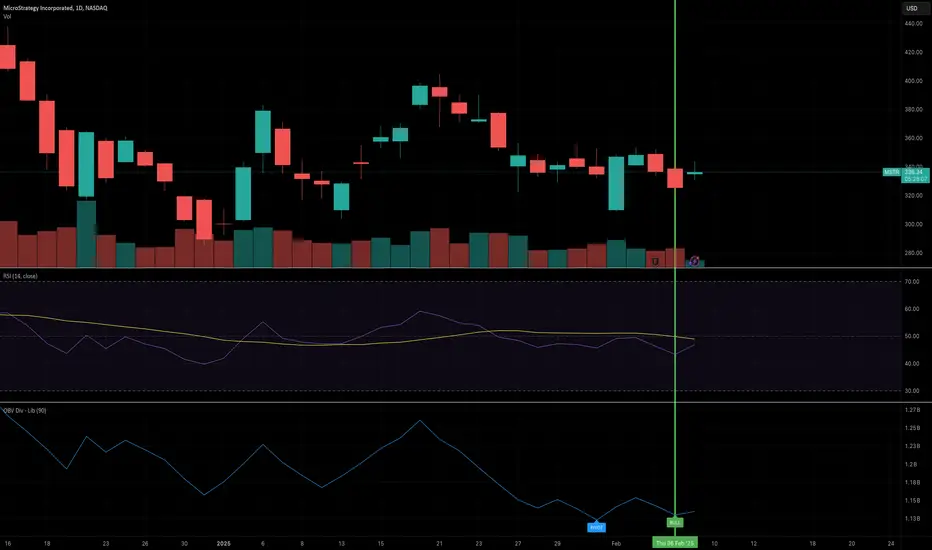
Buy Signal on MicroStrategy after 2 years.Bullish divergence on NASDAQ:MSTR that last appeared in the mid of 2022 and then december 2022. Bitcoin bottom appears to be nearer and this could take bitcoin to $250K price target.
The bear trap of TardFiMicroStrategy (MSTR): Locked & Loaded for a Breakout
Trump just put David Sacks in charge of crypto policy—a massive win for the industry. This signals clear regulations, institutional confidence, and a green light for Bitcoin adoption. The crypto space is buzzing, with major players vying for a seat at the table.
The recent trade war FUD triggered a classic bear trap, shaking out weak hands before the real move. Bitcoin briefly dipped but held strong, showing resilience. MSTR is tightening into a textbook bullish wedge—coiling up for what looks like an explosive breakout.
With macro winds shifting in crypto’s favor, MSTR is primed to rip higher. The question isn’t if—it’s when.
NASDAQ:MSTR BITSTAMP:BTCUSD

MSTR is about to go down....you've been warnedMSTR is about to go down and we can see this by the consolidation at the upper end of the downward channel. Also, BTC drop won't help so it's seems like a double dip!
You've been warned. Always do your own due diligence! Best of luck...and leverage MSTZ :)

Cycle inversion to the upside if we close above yesterday's highThis channel is not providing individualized trading or investment advice, nor is it a banking service, brokerage service, trading service, investment service or money management
service.

MSTR important levelMSTR is showing a bearish flag on the 1-hour, 4-hour, and daily charts. Was yesterday's pump just a pullback, or will the stock recover today? If it drops below the red line, it is 90% likely to be shorted. If the stock rebound, touch the red line, it is 90% likely to be long. All the best and trade with cares.
