Looking bullish immediately on OXY.🔉Sound on!🔉
Thank you as always for watching my videos. I hope that you learned something very educational! Please feel free to like, share, and comment on this post. Remember only risk what you are willing to lose. Trading is very risky but it can change your life!
4OXY trade ideas

OXY is OversoldThe plan for OXY looks really good it’s just not quite ready but I think the upside for a quick day/week is real. OXY needs a few things to happen. RSI needs to come down a bit (red arrow) then reverse, the price needs to hang in the $55-57 range, the MACD needs to turn bright red and or bright green indicating selling pressure is turning around, and oil prices need to start to head back up a bit. My best guess this happens around the 26th, which is where all the green arrows sit. If these conditions are met I will buy some.

Long oxy with majority of portfolioSupport has held once again, for now.
a 3rd failed breakdown suggests that were going higher.
trendline support.
Buffet likes the stock
Li Lu likes the stock
I like the stock
Daily MACD crossed up.

67 in 2 weeks and 125 in 24 months - Long Long Long Long Long I have been beating the table on this stock for the last month. This is the greatest buy in the market considering the crash we are about to slam into.
1. Oxy historically had too much debt. They financed various acquisitions with debt. Their highest profile investor (Warren buffet) happens to control Bank of America. Bank of America is now the oxy lender (I’d love to see the reg O paperwork on this deal) So to say they have favorable finance terms is an understatement. They have been selling off assets to pay down debt as well. They have paid down almost 2.5 billion of debt and another 2 billion will be paid off in the next six months out of cash flow. This will throw almost a billion to the bottom line earnings (12% increase to earnings without doing a damn thing different)
2. They increased their presence in the Permian basin with the purchase of Crown. Crowns operating costs were too high. They needed oil at 80 a barrel to make real money. Oxy needs it around 45. With the purchase, Oxy turned on half of crowns assets. This will throw another billion to the bottom line.
3. Their LNG and chemicals division is growing and as LNG rebounds from the synthetic supply flush from the government , this division will throw off another 500mm in cash.
So earnings should double in the next 18 months. They trade at a P.E of 14. That’s extremely cheap considering their growth profile. Recently the stock has dipped after incredible earnings. That’s because subsidiaries and crown sold off the shares they were given during the acquisitions. The market was flushed with 40mm shares this week priced around 35.
It’s going to snap back up to 67 in the next two weeks. Grab calls now! In 24 months this will be 125.

OxyI don't know what Mr. Buffett's plan is, but I think the price will continue to fall to lower levels.

Huge Inverse Head and ShouldersIf you can't see this on the weekly time frame...
Then you don't have any business making big $$$
in 2025-2026. Even your seeing eye dog would slap
you upside you head for NOT investing in this baby.
Don't worry...everything is playing out just fine over
here in this camp...BAM!

Even a SEEING EYE DOG...If you can't see this on the weekly time frame...
Then you don't have any business making big $$$
in 2025-2026. Even you seeing eye dog would slap
you upside you head for NOT investing in this baby.
Don't worry...everything is playing out just fine over
here in this camp...BAM!

Occidental Staggers Before Big EventsOccidental Petroleum has been rangebound for more than two years, and some traders may worry about potential downside with some big events looming.
The first pattern on today’s chart is the price action after the April 12-June 4 slide. OXY retraced half the decline before rolling over, which may suggest its trend is now lower. The recent drop below $61 could also be interpreted as a bear-flag breakdown.
Next, the 50-day simple moving average (SMA) is in the process of forming a potential “death cross” below the 200-day SMA.
Third, the oil stock tried to clear last year’s high above $69 in April but couldn’t hold. That kind of false breakout is a potentially bearish reversal pattern.
Finally, at least two big events could impact trading. On Thursday, OPEC+ is expected to let production increase as previously announced. Quarterly results follow on August 7.
TradeStation has, for decades, advanced the trading industry, providing access to stocks, options and futures. See our Overview for more.
Past performance, whether actual or indicated by historical tests of strategies, is no guarantee of future performance or success. There is a possibility that you may sustain a loss equal to or greater than your entire investment regardless of which asset class you trade (equities, options or futures); therefore, you should not invest or risk money that you cannot afford to lose. Online trading is not suitable for all investors. View the document titled Characteristics and Risks of Standardized Options at www.TradeStation.com . Before trading any asset class, customers must read the relevant risk disclosure statements on www.TradeStation.com . System access and trade placement and execution may be delayed or fail due to market volatility and volume, quote delays, system and software errors, Internet traffic, outages and other factors.
Securities and futures trading is offered to self-directed customers by TradeStation Securities, Inc., a broker-dealer registered with the Securities and Exchange Commission and a futures commission merchant licensed with the Commodity Futures Trading Commission). TradeStation Securities is a member of the Financial Industry Regulatory Authority, the National Futures Association, and a number of exchanges.
TradeStation Securities, Inc. and TradeStation Technologies, Inc. are each wholly owned subsidiaries of TradeStation Group, Inc., both operating, and providing products and services, under the TradeStation brand and trademark. When applying for, or purchasing, accounts, subscriptions, products and services, it is important that you know which company you will be dealing with. Visit www.TradeStation.com for further important information explaining what this means.

Occidental Petroleum Corp | Range Idea | Pre-MarketWithin a 100K Account Balance the split on Trade & Risk Management = 1/10% - 1/20% margin as an Execution Range, to set up an Order Entry and select a per Trade on Average, to avoid any drawdown hit regarding to Stop Loss & to execute Risk on Management Specifics. Trail Stop efforts are a Focus of Attention to the set up in general when Volatile-Price-Action is involved, mainly because of the usage of an Intraday-Scalp-Position tool on behalf on the Trade Plan in general
# POSITION & Risk Reward | 15 Minutes Time Frame
- Measurement on Session
* Retracement | 0.5 & 0.618
* Extension | 0.88 & 1
# POSITION & Risk Reward | 1 Hour Time Frame
- Measurement on Session
* 20 EMA
* 1000 EMA
* Retracement
# TREND | TIME FRAME CONDUCTIVE | 4 Hour Time Frame
- Support & Resistance area 1
- Support & Resistance area 2
- Support & Resistance area 3
- Subdivision & General Trend
- Measurement on Session
* Retracement
* Support & Resistance
* Trade Area | Focus & Motion ahead
Active Sessions on Relevant Range & Elemented Probabilities;
* Asian(Ranging) - London(Upwards) - NYC(Downwards)
* Weekend Crypto Session

OXY trendline breakout - US Stock63.50 above breakout possible
65/66/68 expected to test
21 ema above daily close which gives bullish sign


Occidental Petroleum: Do not Slacken!We still locate the Occidental Petroleum stock in the wave (c). In the next step, it should therefore exceed the resistance at $71.19 to mark the high of the superordinate wave B in turquoise. Subsequently, there should be strong sell-offs.

OXY long ideaOXY:-
As long as the trend line holds OXY should move upwards to
Targets:-$64.10, $68.00
Stop loss:- $58

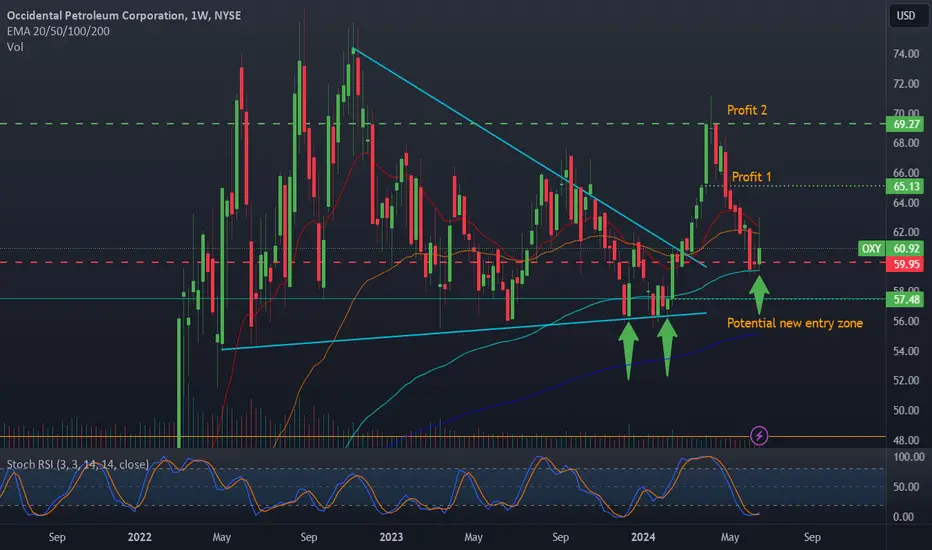
Oxy update, and my most profitable strategy discussedHere is an update on the OXY chart after oil had its pivot in April. Oxy was my best trade of the year dollar amount wise and I am 6/6 the last 1.5 years on these longer dated call strategies. I like to trade wedges or bull flags on value stocks and or GLD and similar ETFs. This wedge breakout like many I have posted before is my most favored setup, I am currently doing this with CLSK.
1. You layer into a long on a demand zone as the contraction nears its end.
2. You enter on a bottoming stochastic RSI, here I added to the position after the initial bump
3. A new entry zone is noted on a potential breakout on crude oil futures
4. The stock bounced on the 100 EMA, I plan to layer in next week
5. My preferred entry is 4-6 months out likely a 65-70$ strike on calls
Descending Triangle BreakoutOXY broke out yesterday from a down trend line with volume to confirm strong buyer interest. I'm wanting to see a price pullback before I make my long entry.
Buy to open = Around $60
1st profit target = $62.50
Stop Loss = $59.50


OXY updateI expect the price to break above the resistance of 70.65 and goes higher , first to 75 then higher this year.

OXY LONGMassive base around historical trendline
Good zone to buy the dips till 55.85
Indicators oversold and bullish divergence.
Warren Buffet bought more $2.5 million value shares this weekend.
Medium term target is $75
Long term $140+

Well DUH...Inverse Head and Shoulders printing on the WEEKLY TIME FRAME
No worries here. Got my bags loaded and waiting on this baby
to fly...looking for OIL per BARREL to TRIPLE almost overnight
in 2025 after "BLEEEEEEEP" gets a serious spanking.
*************** NOT FINANCIAL ADVICE*****************

OXY - retesting for the massive move!!Oxy has been in an uptrend for the last few months while consolidating within the triangle. We have recently broken out and are in motion for the retest. Expect a bounce to break out of the greater down trend before we shoot to the stars.

Mean Reversion First then Go LongOXY is very extended relative to its moving average ribbon. But the breakout looks promising for a long. Look for consolidation for a few days or a pull back to its 13 EMA to enter long on the the multi year breakout. I traded the fake breakdown on a recession signal a few months ago and now its time to trade the possible breakout on more inflation!
To be clear if the pull back doesn't happen I wont chase. Let it reload first. If not There are lots of other tickers out there.

OXY should bounceI am expecting oil and Oxy stock to bounce here. Oxy finds itself on the 100 EMA which serves as support on pivots and overall up trending assets. A historic bottom of the stochastic RSI is marked in dashed red as well. This stock is very oversold here after the tremendous rally. This is actually my best trade of the year, those 70$ Jan 2025 calls made me bank and I still have 33% of my position riding. The question now is do I add here?

Is this retracement the opportunity to buy? 🤔 Price target $117Is this retracement the opportunity to buy? 🤔
If Warren Buffett owns it so should we 🚨
Price should bounce if it retraces to the bull flag breakout point.
We have mapped predicted price movement.
Our upside price target is $117.
Will you be buying if we retrace further?
