PEPSICO TA Bullish SetupNASDAQ:PEP
Purely from Techincal Analysis point-of-view shows a positive setup for PEPSICO:
+ Bullish engulfing candle
+ Prices rejected on 200EMA
+ Stochastic on an oversold area
Area of concern:
- Prices around $147.50 zone have a strong resistance formed
No TP is set for this setup because I believe if the prices are able to break through the previous resistance we would continue to ride a very long trend upwards.
Will be monitoring this trade for any reversal pattern.
Lastly, I have setup an SL in case prices are not trending upwards
4PEP trade ideas


Oversold incoming? (Pepsi)Comb through the annual reports of Coca-Cola and Pepsi, and you will see the two rivals list one another as their main competition. White both are giants in the beverage field, there is one key difference, which could be the reason to pick one over the other.
About Coca-Cola: Sparkling soft drink brands for Coca-Cola Co (NYSE: KO) include Coca-Cola, Diet Coke, Sprite and Fanta. The company also has a growing portfolio of non-sparkling soft drinks that includes Powerade, Vitamin water, Minute Maid, Costa Coffee, Fuse and Gold Peak.
Coca-Cola also owns a stake in energy drink maker Monster Beverage (NASDAQ: MNST) and helps distribute the brand. The company owns a stake in growing sports drink company BodyArmor.
Sparkling soft drinks made up 69% of unit case volume for Coca-Cola in fiscal 2019. The company’s portfolio includes four of the top five non-alcoholic sparkling beverages with Coke, Diet Coke, Fanta and Sprite.
About Pepsi: Sparkling soft drink brands for PepsiCo Inc (NASDAQ: PEP) include Pepsi, Diet Pepsi, Mountain Dew and Mug Root Beer. The company’s portfolio of non-sparkling soft drinks inclues Gatorade, bubbly, Pure Leaf and Tropicana.
The Key Difference: The big difference between the two beverage giants is the huge portfolio of food brands owned by PepsiCo.
Under its Frito-Lay and Quaker Oats divisions, Pepsi owns brands like Lay’s, Doritos, Quaker Oats, Sabra, Cheetos, Fritos, Tostitos, Cap’N Crunch and Aunt Jemima.
Pepsi got 54% of its revenue from food in fiscal 2019, making its beverage division the smaller segment. The Frito-Lay North America and Quaker Foods North America segments made up 25% and 4% of overall fiscal 2019 revenue, respectively.
Frito-Lay North America made up 45% of the operating profit for PepsiCo in fiscal 2019. This high margin segment has been a key to the financial success of the company over the years.
Related Link: Stock Wars: General Mills Vs. Kellogg Vs. Post
Financials: Coca-Cola has products in more than 200 countries. The company got 18% of its unit volume from the United States in fiscal 2019, with the rest coming from international markets.
Sales for Coca-Cola rose in fiscal 2019, but that came after three straight years of declining sales. Revenue was $37.3 billion in fiscal 2019. Net income for the company hit a five-year high of $8.9 billion in fiscal 2019.
Coca-Cola reported third-quarter revenue declined 9% year-over-year to $8.7 billion. Coca-Cola lost value share in the non-alcoholic ready-to-drink segment.
Coca-Cola presently pays dividends of $1.60 per year, equal to a 3.4% dividend yield. The company has raised its dividend 58 consecutive years.
Pepsi got 58% of its revenue from the United States in fiscal 2019 and 42% from international territories. Revenue for PepsiCo was $67.2 billion in fiscal 2019 and was up year over year for the fourth consecutive year.
PepsiCo had revenue growth of 5.3% year over year in the third quarter to $18.09 billion.
The dividend yield for shares of Pepsi is 2.9%. Pepsi has raised its dividend 48 consecutive years.


PEPPEP 1/12/21 1D Time Frame
Price action could go down a little more with pivot point around the 200ema & channel bottom area. Key supports are 200ema & channel bottom. Stop loss just below channel bottom. MACD indicates bearish momentum.
Disclaimer
I do not know how the market will move tomorrow. All my post is not a recommendation, advise nor a suggestion and should not be used as a replacement for investment advice from a qualified licensed professional. All my post is for practice, informational and entrainment purposes only as I am not a registered investment advisor and do not offer investment advice and recommendation. You, the reader, bear full responsibility for your own investment and trade decisions and should seek the advice of a qualified securities professional before making any investment or trade.


PEP - Blue Sky MoonshotPEP is another ticker that is looking to break out from it's one month long consolidation pattern. Beautiful set up here with next price target at 159-160. The volume and OI on the 1/15/21 150c look great at around $170-$200 a piece. Trigger to go long could be on confirmed break of ATH, have your alerts set on this one!
Preferred Contracts: 1/15/21 150c


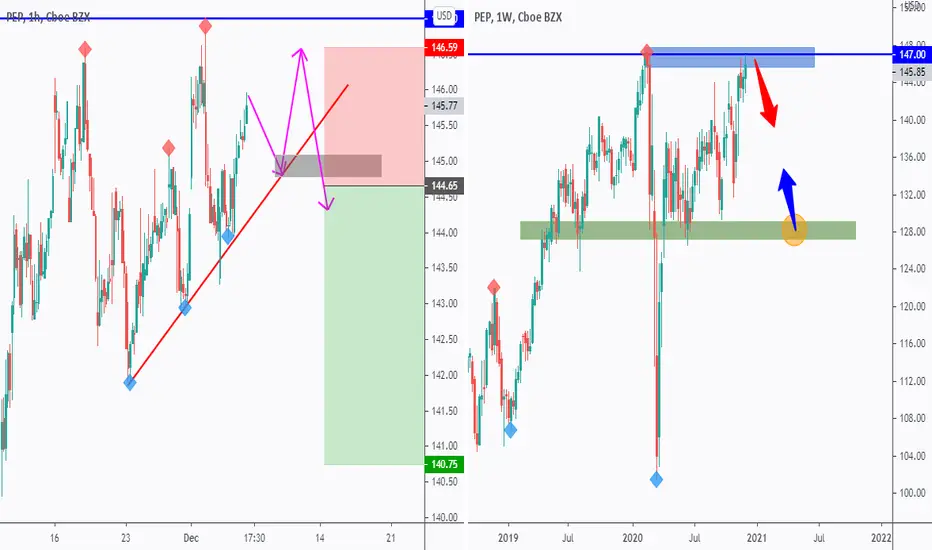
PEPSI-CO video top-down AnalysisHello everyone, if you like the idea, do not forget to support with a like and follow.
on DAILY: PEPSI is sitting around strong supply in blue and all-time-high so we will be looking for sell setups on lower timeframes.
on H1: PEPSI formed an objective trendline in red so we are waiting for a new swing to form around it to consider it our new trigger swing.
Trigger: Waiting for a momentum candle close below the gray area to sell.
and until the sell is activated, this one would be overall bullish and can still dive inside the blue zone.
As price approaches our lower green support, we will be looking for buy setups.
Good luck!


Giant Ascending Triangle for Pepsi?Pepsi appears to be trading in an ascending triangle drawn in blue, but additionally, there's a noticeable inverted H&S, the blue head icon represents the head, and the two dark green lines are the shoulders.
I have placed a blue finger on the KST to represent a bullish cross.
On the RSI there appears to be a descending channel & potentially a triple bottom where I have placed the three blue fingers.


Option Play: PEPStock closed above key consolidation level at 143.77 on Friday. Stock tried to break through this level 3 times before finally breaking through and closing above for confirmation on Friday. We will see 147.2 shortly for an ATH kiss, and if momentum is strong enough, it could blow right through. Solid rally all together for the market on Friday afternoon helped push this one to confirm the close. Look for a green cloud to form up on the right as the price pulls up - setting up for a gap Monday or Tuesday, maybe Wednesday. Sitting in 147c for 11/20 expiration, and the 150c for 11/27. Good luck if you play!! 147 is my first 🎯 and then I’d base a larger rally on if the market is strong or not. Look for potential stimulus relief talks. In a scenario as such, we could see 155-160. Don’t hold onto calls too long, take profit and leave a runner or two.


PEP - Bull Flagging after Consolidation BreakoutBeen awhile since I’ve posted about PEP - Gap through consolidation to start the week off. Then the stock tagged the 143.77 resistance created in March and September, and is continuing to hold in the 140’s above the 9 day ichimoku average line, indicating a positive continued trend. Looking to close out weeklies around 147 resistance from pre-Covid timeframe. Below 142 this could be a bust. Above 143.77, jump on the train!! (In end of October calls - 145, 150 strikes)


