4PEP trade ideas

PEPSICO TREND AND WAVE ANALYSISBe sure to stick to Stop Lost and TAkE Profit. This is an idea and not a bargain offer
This is just idea, not trading advice, use at own risk.
reasons:
It is recommended to buy in this price limit
It is mandatory to pay attention to the stop loss and the target marked on the chart
Do not be greedy and adhere to the specified principles. I hope you will be profitable
Note that there is no 100% analysis and it is possible to stop flirting
This is a personal analysis and you should not enter into a transaction without review
If you know this, make a purchase
Be sure to adhere to the principles of capital management and do not invest more than 2% of your capital in each transaction.
High-risk individuals can enter a maximum of 5% of risk capital in this transaction by accepting risk-taking.
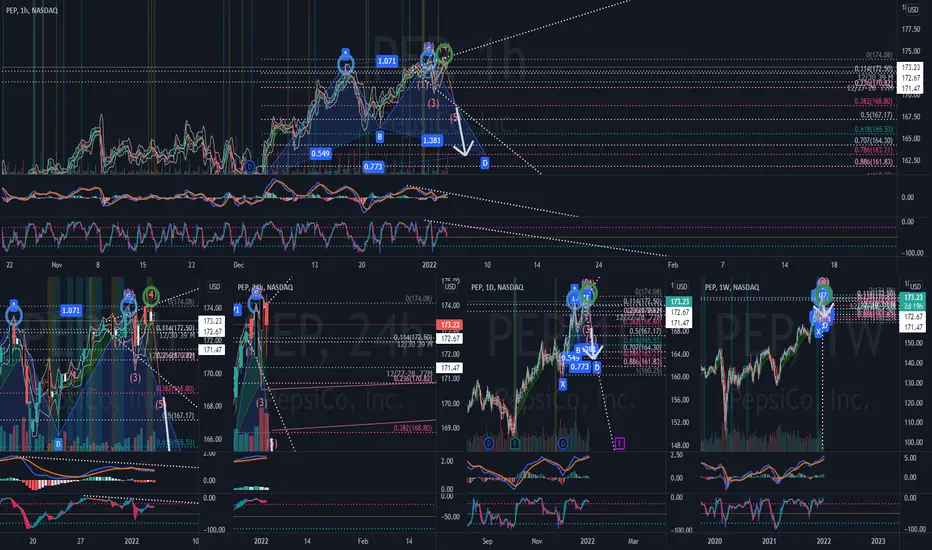
This analysis has been analyzed with the classic Elliott topics and neo wave style. Also, the principles of price action have been used.

Day 3 Iron condorPrice range : 172 to 182
this is a 10 dollar spread in between
Max loss : $300, Max profit $200
CApital risked: 304

$PEP with a Bullish outlook following its earnings #Stocks The PEAD projected a Bullish outlook for $PEP after a Positive Under over reaction following its earnings release placing the stock in drift A with an expected accuracy of 90.91%.

Pepsico PEP - Short Setup on WeeklyHere we are with another interesting short setup. Pepsico is approaching my short level and should get there in the next day or two. Risk/reward is too good for me not to take this trade.

PEP - 45mIt has crossed the shaded area as shown on the chart. The targets are from it, we enter a correction to its maximum limits. It is clear on the chart, including a bullish wave. The analysis cancels when the third area is broken by closing a 3-hour candle below it or closing above the third target, an hourly candle.

$PEP with a Bullish outlook following its earnings #Stocks The PEAD projected a Bullish outlook for $PEP after a Negative Under reaction following its earnings release placing the stock in drift D with an expected accuracy of 100%.


PEP 17/02/2022 LongAsset and Time frame -Daily,PEP
Entry Price -166.32
Exit(Stop Loss) 163.99
Exit(Take Profit) -175.08
Technical Analysis - Price action reached the bottom of an up-trend channel and the daily 0.00 Fibonacci level after retracing from the -61.8 level, in addition, we have the 100DMA as further support.
Good Luck

Update on pep short seems to be createing a broadening pattern which is outlined by the trendlines and and 5 orange waves. lots of bearish divergence going on as well on the 1hr and 4hr outlined by trendlines on indicators and circles on candles.
my first target would be the 38 and depending on the timing move down the trendline to see where it intersects with with a fib. if it comes down and doesnt hold 38 well the patterns tells us the 78 is a likely spot. 1 thing is earnings is coming up so potential sell off into earnings for a post earnings dip buy.
Not financial advice

PEP - STOCKS - 11. OCT. 2021Welcome to our Weekly V2-Trade Setup ( PEP ) !
-
4 HOUR
Solid performance and data.
DAILY
Expecting more bullish price action!
WEEKLY
Great long entries, underprices imo..
-
STOCK SETUP
BUY PEP
ENTRY LEVEL @ 156.92
SL @ 149.40
TP @ Open
Max Risk: 0.5% - 1%!
(Remember to add a few pips to all levels - different Brokers!)
Leave us a comment or like to keep our content for free and alive.
Have a great week everyone!
ALAN

PepsiCo : one method to swing tradeif the crossover TSI shadow happens under the EMA ribbon (100 EMA and 200 EMA), I either just leave it alone and move on to the next stock OR I wait if price close above the ribbon AND the daily pivot is missed (and not too far away from the ribbon).
Look at the charts, its self explanatory

PEP Trade Opportunity Pep has a very nice ascending triangle, the trend line is very strong on the 6 month and PEP is currently at resistance. Break to the upside could lead to new all time highs.

Powerful Demand Zone for PEPSIPEPSI made a great demand zone I showed on the chart and I think the price will comeback to the zone.
We can have a low risk long.
Do risk free.

PEPSI getting ready for another breakoutPrice almost retested breakout level during recent correction
Now getting ready for another breakout
I posted the initial breakout as well
If one is holding initial breakout, he can add to this breakout
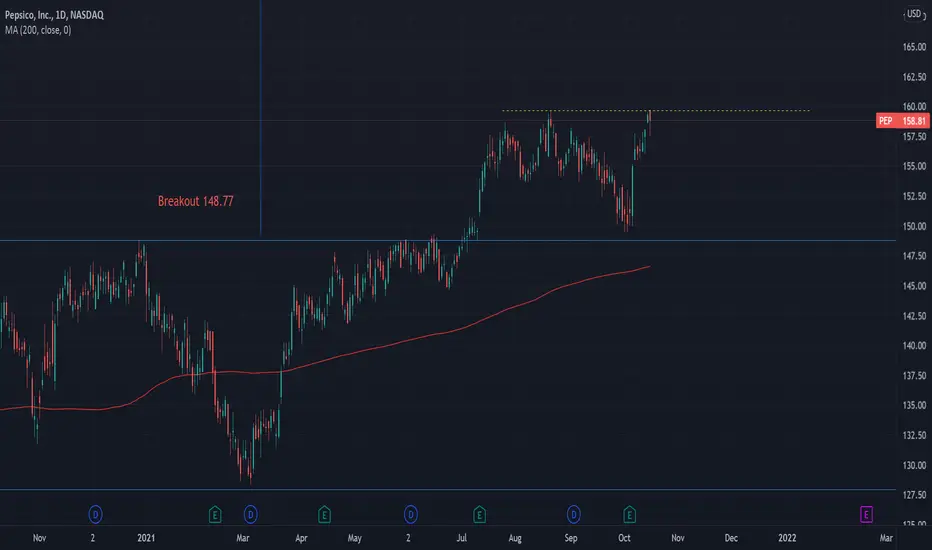
PEPSI close to a breakoutPepsi coming close to a breakout
15 Month long consolidation
Price is in steady uptrend
Earnings coming up as well, last 2 earnings came above the expectations

$PEP with a Bullish outlook following its earnings #Stocks The PEAD projected a Bullish outlook for $PEP after a Positive under reaction following its earnings release placing the stock in drift A with an expected accuracy of 100%.
If you would like to see the Drift for another stock please message us. Also click on the Like Button if this was useful and follow us or join us.

PEP idea #1Very close to retesting 2020 highs.
Watching for reversal patterns on daily/intraday for short-term trades.

PEPSICO IN DAILY TIMEFRAME CORRECTION Stock Trading in Daily time frame correction which expected to go till December and Prices corrects till 140...


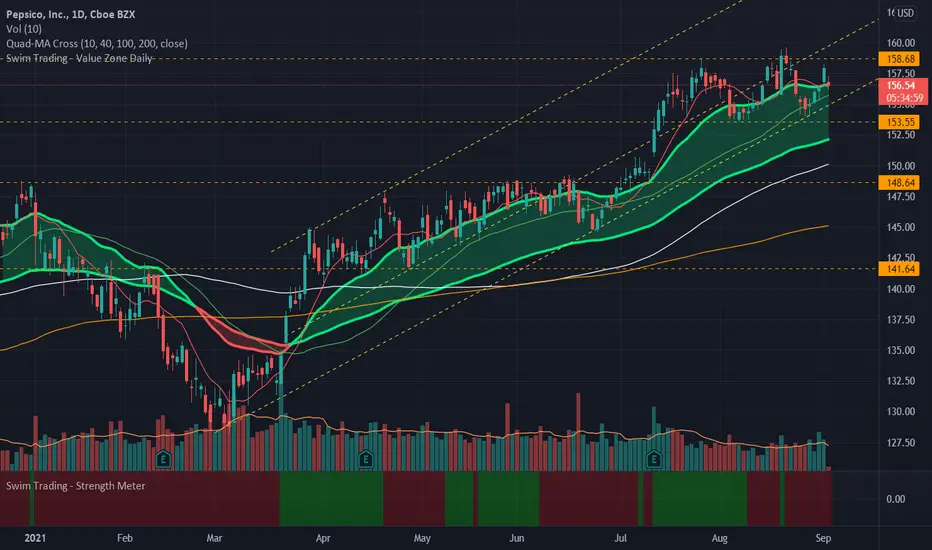
PEP.NAS_Swim Trading VZ Breakout Trade_LongENTRY: 156.53
SL: 151.94
TP1: 162
TP2: 167
- ADX<20. Would like to be higher.
- RSI>50.
- Reacted well to pivot point "P" by bouncing off twice.
- Entry based on breakout from VZ yesterday.
- Strength meter shows weakness so entered with lower risk.
PEP - Earnings play idea end of the month PEP jumped up high after last earning report, at the moment its consolidating in the weekly and daily time frame. Hoping to see another run up after OCT 4th earnings. Buy in when it hits support level end of month.
