4PFE trade ideas


Esperando para entrarSi rompe las resistencias en la zona 39-40 es una buena oportunidad para entrar si recupera el canal superior alcista.
Esperamos los resultados positivos de la vacuna COVID-19 para salir al alza.

Pfizer great chanceHey everyone,
there is an awesome setup for a short trade. As you can see, there is a double top and 2 divergences which signals a falling stock within the next 2 weeks. Let's wait for a confirmation and then short that stock!
Very much fun with that awesome trade!
Please leave a follow :)

Is This a Cup And Handle Formation on PFE?It looks to be a clear Cup and Handle Formation on the weekly PFE chart. Does anyone also see it forming correctly? Today we would need some good volume and to break above the lip and that could be the confirmation we would need it looks like. Let me know how you feel about this chart. TY

Pfizer sell signals on D1.Pfizer, D1: Resistance zone + Side of Bollinger Bands + Hanging Man + Overbought

PFE - 1H - 21.07.2020#PFE - 1H - MACD divergece already descounted?
Notable divergence on our 1H MACD. The key question here is that if has been already discounted on the last bullish run from 31 USD to 36 USD?
Today we have reach an importan resistance on 37 USD level. If there is not any news about COVID vaccine among these days, we will have a healthy correction of the price during the rest of the week.

PFE might be the stockWIth corna virus getting worse in america and the world demand for a cure is very high cause most leading cure finders to rise in price but there is always others that might make it
Prediction 50 dollars by the end of fall
do not use these as stocks unless you absalutly want to because my opion might be wrong.

Outlook PFE / Pfizer Inc.Although there are several open gaps in Pfizer's chart, I'd like to highlight two of them, as well as the two-times crossed downtrend-line.
Personally I see this as a strong signal that should push the chart even further.
As a logical next step I'd expect the stock to close at least one of the open gaps on the downside and then to rise and close the July '19 gap at USD 41,44.

$PFE sure looks prettyThis is the prettiest chart i've seen this month. It seems to be respecting geometry well. Let's begin at the first impulse wave on 3/23-4/28. After that, PFE went through a distribution period through the month of May. It broke down from there to a correction wave (falling wedge) then broke out to another impulse wave. It looks like the beginning of the 5th wave might play out on earnings!? This is definitely one to watch tomorrow. I would love to enter at 37$ if it's possible. The 42.86$ resistance is from a prior high. Nonetheless this seems like a 5 point move post earnings. We'll see how it flows tomorrow....

Pfizer long36.11 level support
under 37 - long
fib 0.786 - 40.82 resistrance
fib 1 - 44.35 resistance

Technical view of PfizerPfizer’s stock is moving in a short-term sideway direction.
Between levels 41 and 31.5
With high volumes.
Therefore it is possible to trade between the two levels.

PFE - GREAT Short Opportunity, IF ... !!Hello! Friends,
This would be a great short Opportunity, IF NYSE:PFE breaks down the Daily Support line at $37.05 (with a whole DAILY Candle) !!

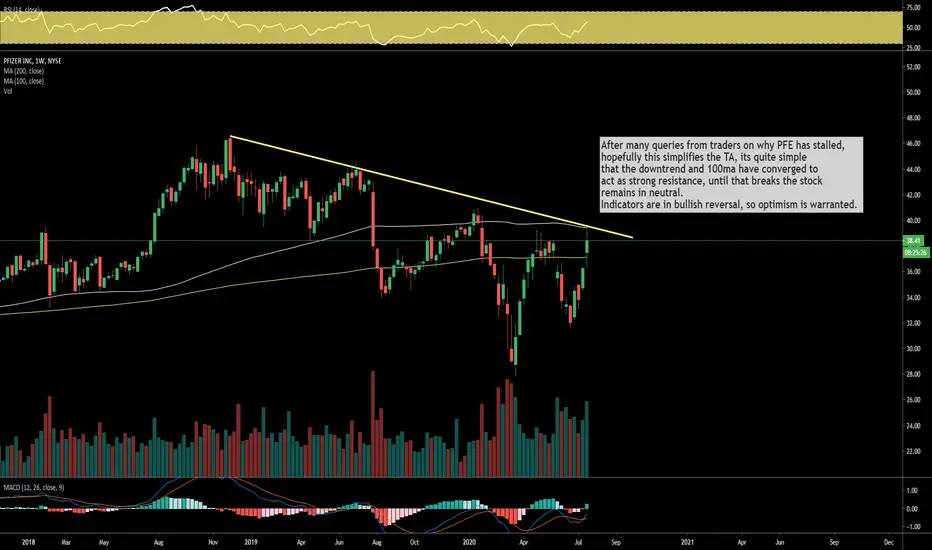
$PFE Pfizer a buy above Trend-lineAfter many queries from traders on why PFE has stalled,
hopefully this simplifies the TA, its quite simple
that the downtrend and 100ma have converged to
act as strong resistance, until that breaks the stock
remains in neutral.
Indicators are in bullish reversal, so optimism is warranted.

GoNoGo Charts sees positive price action for Pfizer, IncGoNoGo Charts has flagged a recent “Go” signal on Pfizer Inc, and this has driven price higher to test previous highs.
If price can consolidate above this level that would be a very good sign.
The GoNoGo Oscillator crossed into positive territory on a surge in price several bars before the “Go” flag, suggesting the trend change.
Of note now, is the heavy volume that is starting to accompany the bullish price action. This is indicated by the oscillator’s darker blue color (small grey arrow in the oscillator panel). The GoNoGo Oscillator is at an overbought extreme, but if the ensuing price pause can stay at current levels we would look for another push higher.
What are the GoNoGo Indicators?
The GoNoGo Trend indicator blends traditional trend concepts to color price action according to the strength of its trend. The colors range from *bright blue (strongly *bullish) to dark *purple (strongly *bearish)
The GoNoGo Oscillator blends traditional *momentum concepts to demonstrate the velocity of price action. The oscillator ranges from -6 (extremely *oversold) to +6 (extremely *overbought)


Looking really good on the weeklyLooking like PFE just busted a downward trend and crossing fib . Other indicators look good also.


Pfizer great news!! and resistance break!Some great vaccine news as US prepares to vaccinate the American population with 100M doses worth up to 2Billion USD and supplied by Pfizer and BioNtech!. The resistance line that PFE was under represents a long term hard resistance since 2018. PFE might go a lot higher now, perhaps as high as Moderna.

PFE LONG EARNINGS 7/28 READ HOW TO FIND A GOOD PRICEThis Earning's Season has proved nothing is every guaranteed. IBM is definitely one example although it appears to be crawling its way back up. The closer you are to a Stock's Earnings Date the bigger the difference in the bid/ask price. I bought the $36 Call using the 8/21/2020 expiration for $2.20 the bid/ask price was 2.20/2.21. You have to be patience and look for the price to turn "red" and then either bid lower and/or wait for the price to go down. I placed the trade this morning.

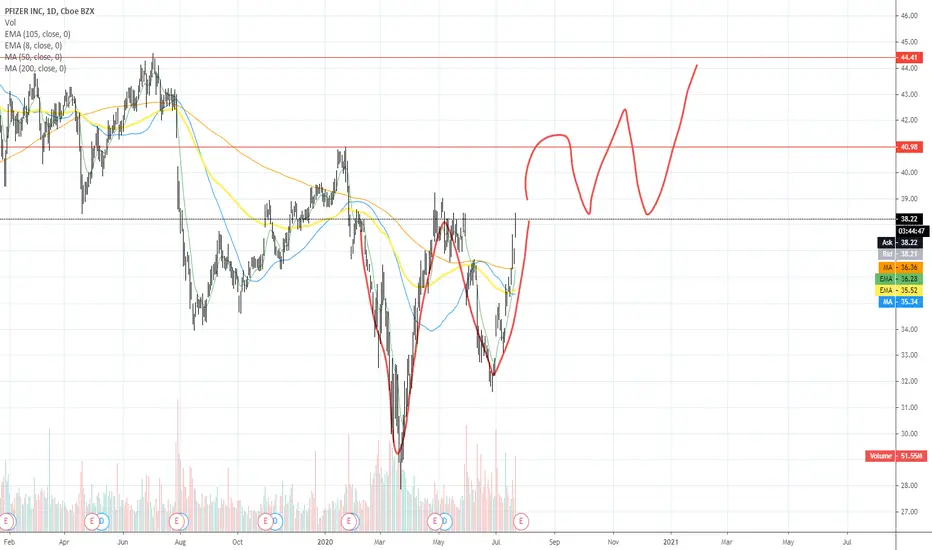
PFE LONG OR BUY TARGET UP TO $46Along with the good news about the PFE vaccine, it has increased the chances of success for this stock, and
if it surpasses $ 38.5, it will confirm the "Asymmetrical Triangle" pattern.
PFE buy : $38.5
PFE target : $46+-1
PFE stop loss : 10% .
Current prices are supported on all 3 averages of 25-50-200.
Wish you good deals!
