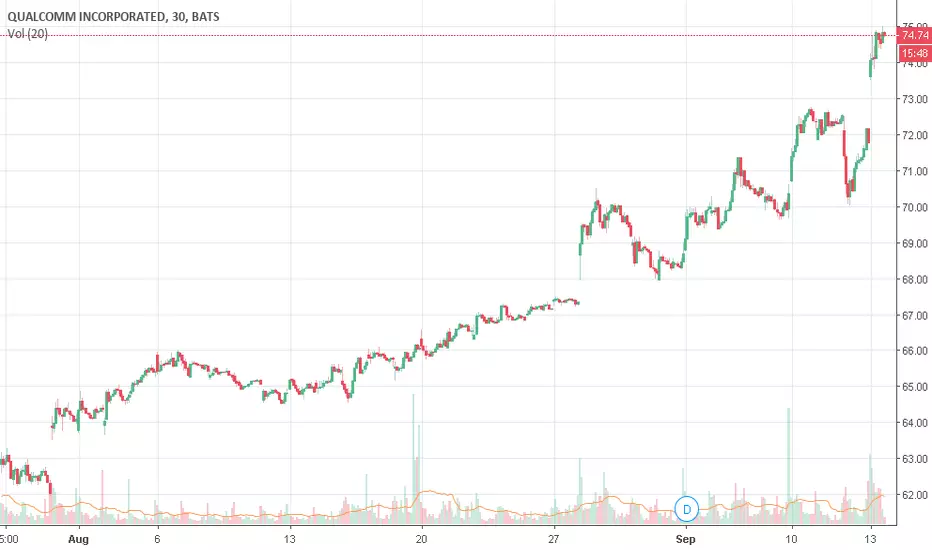
QCOM more upsideHuge 52 week breakout on large volumes for QCOM. Shares should continue heading higher.
4QCOM trade ideas

QCOM LongQCOM finally broke out of the range it was trading in. Rounding bottom formation with confirmation now, TP at previous swing hi

Qualcomm Initiates $16 Billion Accelerated Share RepurchaseQCOM: Qualcomm Incorporated
2018-09-13 05:55:00
Qualcomm Initiates $16 Billion Accelerated Share Repurchase
QCOM, AAPL, OLED - Coincidence on new iphone plans?TELECOM Sector
Qualcomm snapdragon chips tend to go into cell phones #QCOM
Apple introducing new iphone as release X a fake release to 5G #AAPL
OLED displays are the best in the market #OLED
STM chips for ASIC might be made by someone else #whoknows
AXTI 3D sensors might have competition ?? #whoknows (not PM)
Yes, I left out AMD, which might be making the GPU, who knows ?? #toolate-shipsailing
Am I more interested in Softbank comment on new Japanese Telecom Carrier IP and needing big investments from banks.
Bought OLED in August. QCOM in Sept. Sold AXTI for now...3D sensor users needed. STM well holding on for no good reason.
These are all prognostications and viewers come to own sense of reality, investing, and humor.
Samsung / 5G-Apple here's a new product idea: I'd love to see a whole house smart phone system. Every phone has WIFI, display, GPU, etc. for under $1K or abouts.


QCOM Detected possible stock repurchase!!!QCOM: qualcomm inc
2018-07-26 05:15:57
Detected possible stock repurchase

BUY! CHARTS LOOK GREAT!Weekly and Monthly Charts look Great!
Indicators trending up!
Position: 7500 Shares
Purchase Price: $58.77

QUALCOMM (QCOM) earnings preview: tepid revenue projectionsAnalysts expect Qualcomm’s licensing business to show a solid growth, because of increased 3G and 4G device adoption. However, recent government investigations into the business model and the Apple lawsuit against Qualcomm’s business practices have increased the possibility of negative effects on royalty revenue. Qualcomm may be able to withstand these inquiries and maintain adequate royalty rates.
Qualcomm is a steward of the digital communication technology known as CDMA, which is commonly referred to as a third-generation, or 3G, wireless communications standard. 3G allows devices to send/receive voice signals and wireless data, and has played a major role in the proliferation of mobile devices. Qualcomm’s treasure trove of patents (with a monopoly in 3G and a significant portion of 4G) allows the firm to charge device-makers a royalty fee as a percentage of the price of each 3G and 4G device sold (as most 4G phones are backward-compatible with 3G).
www.finstead.com

Range Trading on QCOMPrices are ranging heavily between 48.00 and 68.00. A lot of range trading can be done. There are strong supply zones from above and strong demand zones from below as well.
Just stay patient and I advise to restrain trading from the middle of the supply and demand curve.

QCOM - 5GRising wedge correction or breakout. Watching volume (OBV) and VIX affect on market volatility in next week for buy opportunity.

QCOM time for long?$QCOM has strong fundamentals support as 4g/5g patents. For now stock trades for last year price, look good for me for hodl portfolio. Unfort trade wars can easily make pain for this stock, so be careful in you trades and dont forget to hedge.

QCOM Head and Shoulders ShortWatch for H&S to play out and confirm on the 1 hour before taking a short position.


$qcomalts bit boring, lets do a stock
was going to buy this a while ago and forgot to set the alarm, missed the recent bottom around when amd was.


Upward ChannelStrong supporting oscillators and indicators. But possibly not for long. Riding current swing before strong reversal signals.

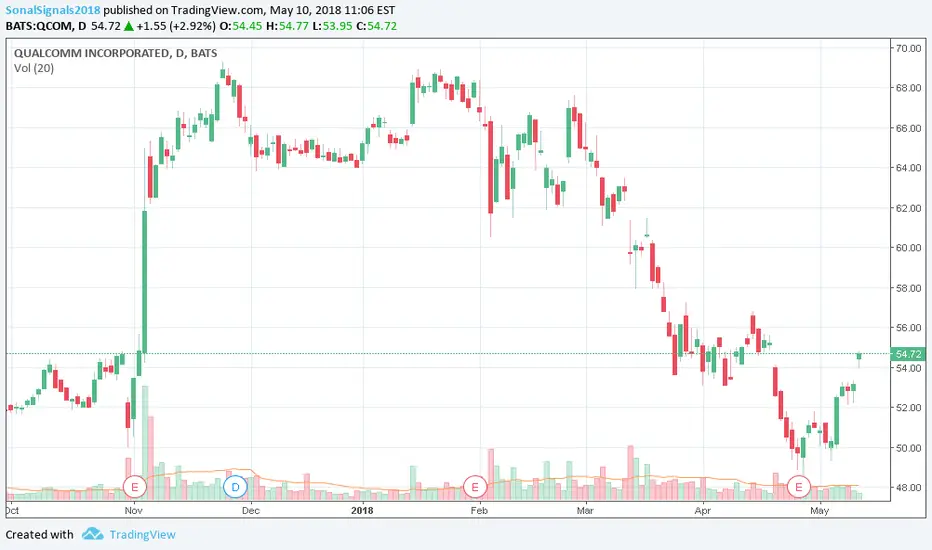
QCOm Detected possible stock repurchase!!!QCOM: qualcomm inc
2018-05-09 16:30:15
Detected possible stock repurchase


$QCOM Oversold at $50 Support$QCOM looking like a buy oversold at $50 support with earnings expected tomorrow (04/25) post-close. Expectations seem to already be fairly low heading into tomorrow. If QCOM reports a beat this could bounce 10%+ in the next week, with a couple overhead gaps to be filled. Risk/reward for going long here feels worth it.
Note: This is an opinion and is not investment advice.
