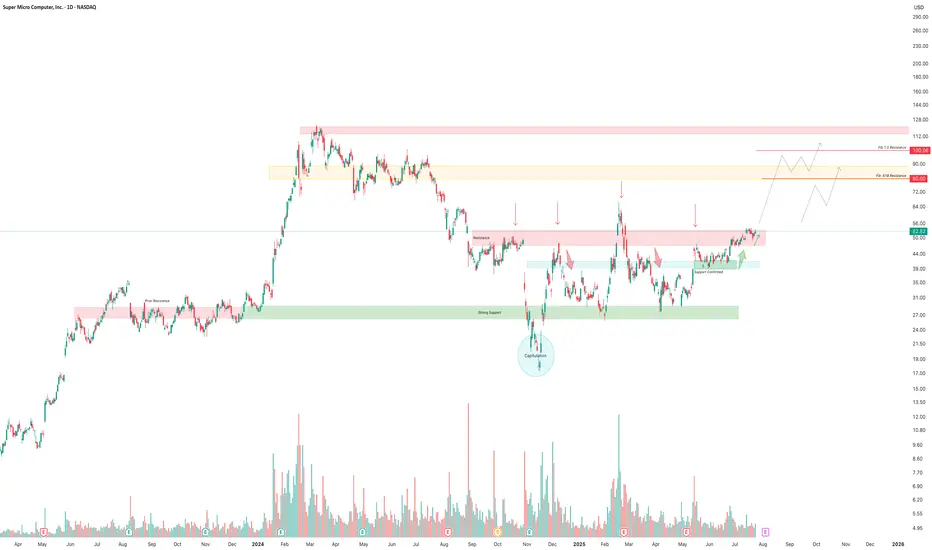
SMCI going to breakout soon, targeting $200NASDAQ:SMCI hasfound support at $28, it is currently trading around the $46 level. It is attempting to test the $50-$61 range for the third time and will likely turn this level into support with a breakout.
$200 could be a good psychological target. The relative strength against the SP:SPX is a
Key facts today
Next report date
—
Report period
—
EPS estimate
—
Revenue estimate
—
1.89 EUR
1.08 B EUR
13.99 B EUR
512.67 M
About Super Micro Computer, Inc.
Sector
Industry
CEO
Charles Liang
Website
Headquarters
San Jose
Founded
1993
FIGI
BBG01QMX3T61
Super Micro Computer, Inc. engages in the distribution and manufacture of information technology solutions and other computer products. Its products include twin solutions, MP servers, GPU and coprocessor, MicroCloud, AMD solutions, power supplies, SuperServer, storage, motherboards, chassis, super workstations, accessories, SuperRack and server management products. The company was founded by Charles Liang, Yih-Shyan Liaw, Sara Liu, and Chiu-Chu Liu Liang in September 1993 and is headquartered in San Jose, CA.
Related stocks

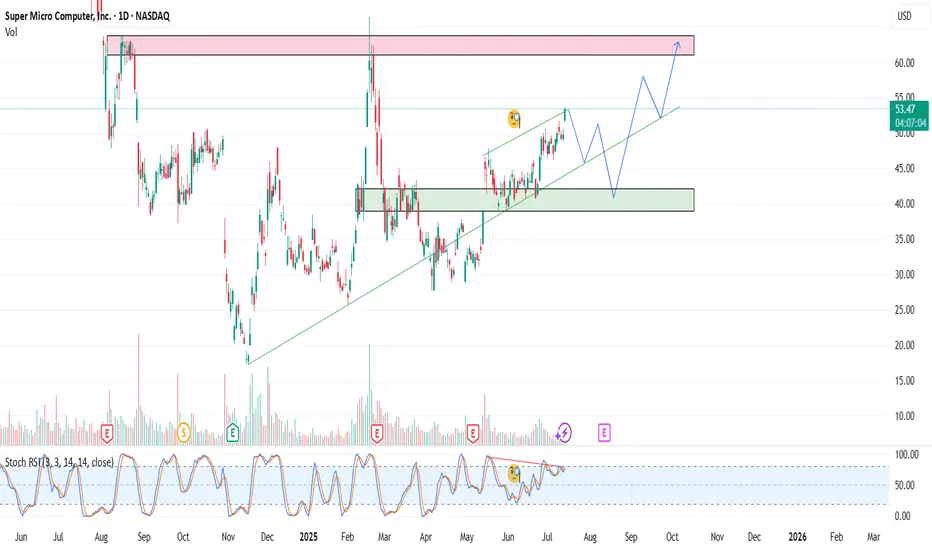
SMCI to Previous Highs!Super Micro Computer Inc. (SMCI) has formed a well-defined accumulation base between $26 and $46 after a major downtrend and capitulation event in late 2024. Price action has since transitioned from panic selling to structured accumulation, confirmed by:
Strong support at $26–28, tested multiple ti
SMCI: When a chart says it’s time to reconnect with the AI hypeOn the daily chart, Super Micro Computer Inc. (SMCI) is showing a clean bullish setup. Price broke out of a descending trendline (green dashed), confirmed it with a retest, and is now consolidating above the breakout zone. The golden cross — where the MA50 crossed above the MA200 — confirms a long-t

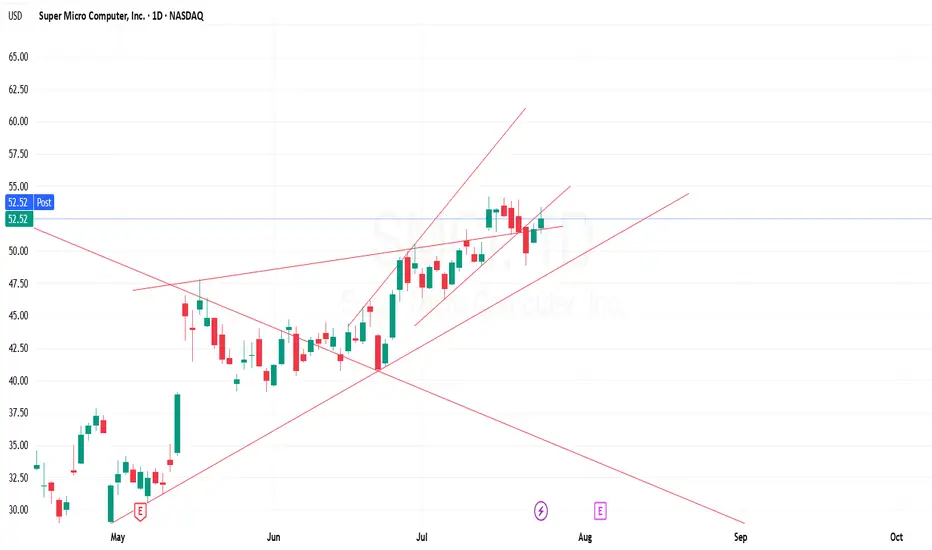
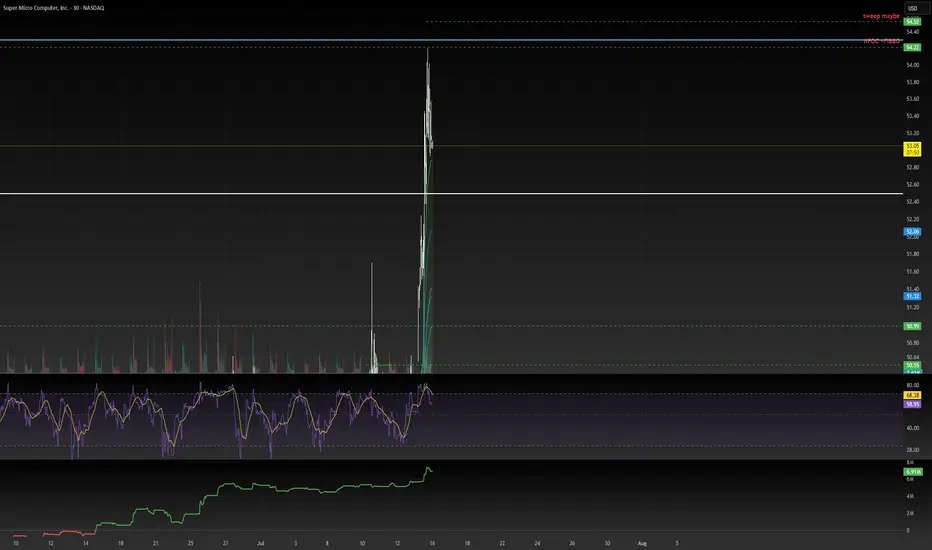
Reversal from Daily Trendline50, 52, 54 sees major resistance. As of today, rejection seen in the daily trend line.
Support 1: 48.90
Support 2: 46.30
Support 3: 35
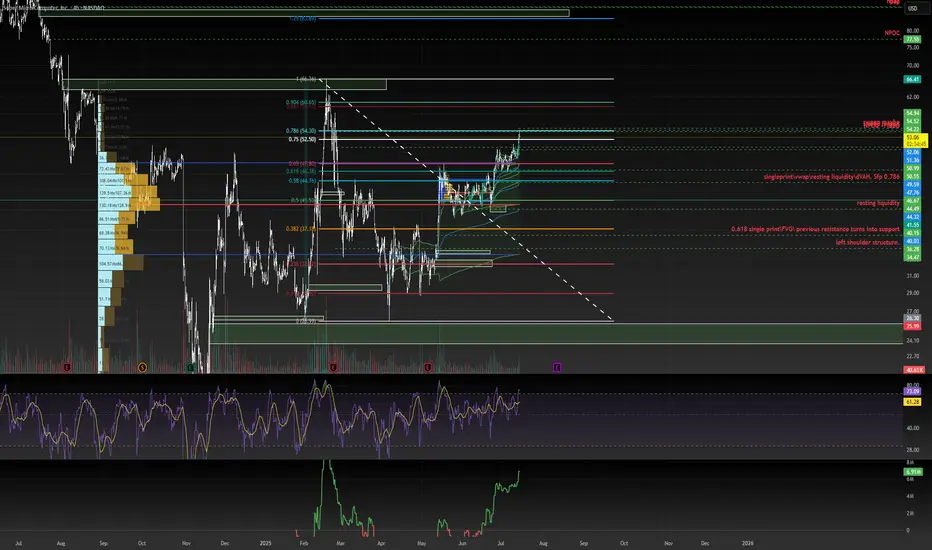
NeoWave Structure: Flat–X–Triangle Combination - break outThis chart illustrates a possible NeoWave-style corrective combination: a Flat–X–Triangle structure, likely completed and followed by a breakout.
W Wave: A well-structured Flat correction (labeled A–B–C) with a clean internal 5-wave impulse in C. Balanced time and volume across subcomponents suggest

SMCI: Watching Monitoring price action closely. Momentum remains positive, and volume is supportive of continuation. Awaiting confirmation before entering, but setup favors a potential move higher.

SMCI – Reloading the AI BeastSMCI continues to show strength as a key player in the AI infrastructure space. In this update, I present a new strategy with staggered entry zones at $49, $45, and $38 — designed to capture value during healthy pullbacks within a larger bullish trend.
Entry Plan:
1) $49
2) $45
3) $38
Target:
1)
Got filled at the bugattiMy hedge short is filled
continuation of my other chart
IF this is good the target it the!!....
key levels will be longed if data aligns.
SMCI: The Monthly Chart says it ALL
Stochastic is way oversold.
MACD is converging.
RSI is converging back up.
Would not be surprised to see this soar back towards the CRT value of $65, then take on new challenges back towards it previous ATH of $122.90 in March, 2024.
Regards,
Terrapins

See all ideas
Summarizing what the indicators are suggesting.
Neutral
SellBuy
Strong sellStrong buy
Strong sellSellNeutralBuyStrong buy
Neutral
SellBuy
Strong sellStrong buy
Strong sellSellNeutralBuyStrong buy
Neutral
SellBuy
Strong sellStrong buy
Strong sellSellNeutralBuyStrong buy
An aggregate view of professional's ratings.
Neutral
SellBuy
Strong sellStrong buy
Strong sellSellNeutralBuyStrong buy
Neutral
SellBuy
Strong sellStrong buy
Strong sellSellNeutralBuyStrong buy
Neutral
SellBuy
Strong sellStrong buy
Strong sellSellNeutralBuyStrong buy
Displays a symbol's price movements over previous years to identify recurring trends.
SMCI6004752
Super Micro Computer, Inc. 2.25% 15-JUL-2028Yield to maturity
−0.45%
Maturity date
Jul 15, 2028
SMCI6021416
Super Micro Computer, Inc. 0.0% 01-MAR-2029Yield to maturity
−2.07%
Maturity date
Mar 1, 2029
See all 4SMCI bonds
Frequently Asked Questions
The current price of 4SMCI is 45.31 EUR — it has increased by 0.57% in the past 24 hours. Watch Super Micro C stock price performance more closely on the chart.
Depending on the exchange, the stock ticker may vary. For instance, on EUROTLX exchange Super Micro C stocks are traded under the ticker 4SMCI.
4SMCI stock has fallen by −3.91% compared to the previous week, the month change is a 13.11% rise, over the last year Super Micro C has showed a 80.95% increase.
We've gathered analysts' opinions on Super Micro C future price: according to them, 4SMCI price has a max estimate of 59.87 EUR and a min estimate of 12.83 EUR. Watch 4SMCI chart and read a more detailed Super Micro C stock forecast: see what analysts think of Super Micro C and suggest that you do with its stocks.
4SMCI reached its all-time high on Feb 25, 2025 with the price of 59.90 EUR, and its all-time low was 16.68 EUR and was reached on Nov 15, 2024. View more price dynamics on 4SMCI chart.
See other stocks reaching their highest and lowest prices.
See other stocks reaching their highest and lowest prices.
4SMCI stock is 1.94% volatile and has beta coefficient of 3.38. Track Super Micro C stock price on the chart and check out the list of the most volatile stocks — is Super Micro C there?
Today Super Micro C has the market capitalization of 26.68 B, it has increased by 7.97% over the last week.
Yes, you can track Super Micro C financials in yearly and quarterly reports right on TradingView.
Super Micro C is going to release the next earnings report on Aug 5, 2025. Keep track of upcoming events with our Earnings Calendar.
4SMCI earnings for the last quarter are 0.29 EUR per share, whereas the estimation was 0.38 EUR resulting in a −24.46% surprise. The estimated earnings for the next quarter are 0.38 EUR per share. See more details about Super Micro C earnings.
Super Micro C revenue for the last quarter amounts to 4.25 B EUR, despite the estimated figure of 4.63 B EUR. In the next quarter, revenue is expected to reach 5.08 B EUR.
4SMCI net income for the last quarter is 100.55 M EUR, while the quarter before that showed 309.69 M EUR of net income which accounts for −67.53% change. Track more Super Micro C financial stats to get the full picture.
No, 4SMCI doesn't pay any dividends to its shareholders. But don't worry, we've prepared a list of high-dividend stocks for you.
As of Jul 26, 2025, the company has 5.68 K employees. See our rating of the largest employees — is Super Micro C on this list?
EBITDA measures a company's operating performance, its growth signifies an improvement in the efficiency of a company. Super Micro C EBITDA is 1.31 B EUR, and current EBITDA margin is 8.35%. See more stats in Super Micro C financial statements.
Like other stocks, 4SMCI shares are traded on stock exchanges, e.g. Nasdaq, Nyse, Euronext, and the easiest way to buy them is through an online stock broker. To do this, you need to open an account and follow a broker's procedures, then start trading. You can trade Super Micro C stock right from TradingView charts — choose your broker and connect to your account.