Potential Bearish Flag in Super MicroSuper Micro Computer has bounced since November, but some traders may expect further downside.
The first pattern on today’s chart is the major slide that began last May. SMCI’s spike in February stalled at a 50 percent retracement of that move. The maker of AI servers also tried and failed to clear its 200-day simple moving average (SMA).
Those signals may confirm the longer-term trend is moving lower.
Next, the small rising channel so far in March could be viewed as a bearish flag.
Third, SMCI has tried to hold support at its 50-day SMA but yesterday closed under it.
Fourth, the 8-day exponential moving average (EMA) has remained below the 21-day EMA. MACD is falling as well. Both of those patterns may reflect short-term bearish trends.
Finally, SMCI is one of the most active underliers in the options market. (TradeStation data shows it averaging more than 800,000 contracts per day in the last month.) That could help traders position for moves with calls and puts.
TradeStation has, for decades, advanced the trading industry, providing access to stocks, options and futures. If you're born to trade, we could be for you. See our Overview for more.
Past performance, whether actual or indicated by historical tests of strategies, is no guarantee of future performance or success. There is a possibility that you may sustain a loss equal to or greater than your entire investment regardless of which asset class you trade (equities, options or futures); therefore, you should not invest or risk money that you cannot afford to lose. Online trading is not suitable for all investors. View the document titled Characteristics and Risks of Standardized Options at www.TradeStation.com . Before trading any asset class, customers must read the relevant risk disclosure statements on www.TradeStation.com . System access and trade placement and execution may be delayed or fail due to market volatility and volume, quote delays, system and software errors, Internet traffic, outages and other factors.
Securities and futures trading is offered to self-directed customers by TradeStation Securities, Inc., a broker-dealer registered with the Securities and Exchange Commission and a futures commission merchant licensed with the Commodity Futures Trading Commission). TradeStation Securities is a member of the Financial Industry Regulatory Authority, the National Futures Association, and a number of exchanges.
Options trading is not suitable for all investors. Your TradeStation Securities’ account application to trade options will be considered and approved or disapproved based on all relevant factors, including your trading experience. See www.TradeStation.com . Visit www.TradeStation.com for full details on the costs and fees associated with options.
Margin trading involves risks, and it is important that you fully understand those risks before trading on margin. The Margin Disclosure Statement outlines many of those risks, including that you can lose more funds than you deposit in your margin account; your brokerage firm can force the sale of securities in your account; your brokerage firm can sell your securities without contacting you; and you are not entitled to an extension of time on a margin call. Review the Margin Disclosure Statement at www.TradeStation.com .
TradeStation Securities, Inc. and TradeStation Technologies, Inc. are each wholly owned subsidiaries of TradeStation Group, Inc., both operating, and providing products and services, under the TradeStation brand and trademark. When applying for, or purchasing, accounts, subscriptions, products and services, it is important that you know which company you will be dealing with. Visit www.TradeStation.com for further important information explaining what this means.
4SMCI trade ideas

SMCI FOMO for longs, pure terror for shorts—ALERT!!!SMCI SuperMicro Alert !!! sooo Urgent - don't miss it
Greed rules the world, baby! FOMO for longs, pure terror for shorts—ALERT!!! Dump all metals NOW, pile into equities. High Beta or bust—High Tech only. Move FAST, minutes not hours, that’s my hot tip (wink wink). SMCI’s the play—not Tesla—oversold, over-shorted, tiny float, primed for a $20, $30, even $60 rip in ONE swing. Double, triple your cash, EASY. Took just $200M to tank it from $130 to $39—chump change. Same fireworks coming on the way up. Liquidity’s a joke—penny stock vibes with monster upside. Multi-X move is HERE. Shhh… tell only your greediest pals. This post vanishes soon—pass it on!
This is the advice I gave to myself... To each its own, as the frog said wanting to get married.
Disclaimer: This information is compliant with Standard III(A) of the CFA Institute Code of Ethics and Standards of Professional Conduct.

Super Micro Computer Inc. (SMCI) - Price Forecast ReportDate: March 18, 2025
SMCI today held off on the $40.50 level today. This level is CRUCIAL! By holding this level off, it kept the higher low.
There is one issue though. When I'm looking at this graph and thinking about what I will do tomorrow for SMCI, it could go either directions really. These are the two predictions that I have:
Purple Line:
The best hope is that tomorrow morning, we will have a break above the $43.15 level. Afterwards, I want to see a hold out on that level. If that's the case, the road to $50 will be getting close and closer.
Cyan Line:
If the price of SMCI does drop tomorrow from open, I imagine a drop to the $38.90 level. I won't panic yet since $38.90 isn't actually the low, the lowest low is still $37.40. I would actually try and enter into a long trade and target the $43.15 level.
News:
Everything looks amazing for SMCI. Yes the interview with the CEO was a couple days ago (last week), but I think the words he said does carry a lot of weight. Looking at other companies, SMCI has no lay offs, they are increasing production, and are the best company at what they do. On top of that NVDA is soon releasing there new GPU which requires liquid cooling which *hint hint* SMCI is the best on the market for.
Conclusion:
All in all I am super happy on the outlook of SMCI. Everything right now is demonstrating an upward trend. Lets see how things play out!
Disclaimer: This is my personal trading perspective and not formal investment advice. Always do your own research and manage your risk accordingly.

SMCI stock Chart Fibonacci Analysis 031725Trading Idea
1) Find a FIBO slingshot
2) Check FIBO 61.80% level
3) Entry Point > 45/161.80%
Chart time frame: B
A) 15 min(1W-3M)
B) 1 hr(3M-6M)
C) 4 hr(6M-1year)
D) 1 day(1-3years)
Stock progress: B
A) Keep rising over 61.80% resistance
B) 61.80% resistance
C) 61.80% support
D) Hit the bottom
E) Hit the top
Stocks rise as they rise from support and fall from resistance. Our goal is to find a low support point and enter. It can be referred to as buying at the pullback point. The pullback point can be found with a Fibonacci extension of 61.80%. This is a step to find entry level. 1) Find a triangle (Fibonacci Speed Fan Line) that connects the high (resistance) and low (support) points of the stock in progress, where it is continuously expressed as a Slingshot, 2) and create a Fibonacci extension level for the first rising wave from the start point of slingshot pattern.
When the current price goes over 61.80% level , that can be a good entry point, especially if the SMA 100 and 200 curves are gathered together at 61.80%, it is a very good entry point.
As a great help, tradingview provides these Fibonacci speed fan lines and extension levels with ease. So if you use the Fibonacci fan line, the extension level, and the SMA 100/200 curve well, you can find an entry point for the stock market. At least you have to enter at this low point to avoid trading failure, and if you are skilled at entering this low point, with fibonacci6180 technique, your reading skill to chart will be greatly improved.
If you want to do day trading, please set the time frame to 5 minutes or 15 minutes, and you will see many of the low point of rising stocks.
If want to prefer long term range trading, you can set the time frame to 1 hr or 1 day.

SMCI: Chart Analysis, Key Fundamentals, and Why It Could Be the Chart Analysis
On the daily chart, SMCI (Super Micro Computer, Inc.) has been trading within a broad descending channel (shaded in blue). Recent price action shows a breakout from a tighter, shorter-term channel (shaded in red), suggesting the potential for a trend reversal. Key levels to watch:
Support around 35.99: This level has acted as a floor in recent sessions. A pullback to this zone could provide a secondary entry for those who missed the initial move.
Intermediate Support around 39.45: After the breakout, this level may serve as a short-term pivot if price consolidates.
Upside Resistance near 44.99: This is a pivotal zone. A clear break above could trigger momentum buying and open the way for further upside.
ATR (the red line appears to be a longer-term moving average) are starting to flatten, which often precedes a potential bullish crossover if price can remain above these key levels. On the momentum front (the green and orange RSI oscillators at the bottom), a bullish crossover has formed, supporting a near-term upside bias.
Thought Process:
Sure! Here's a first-person take on it:
---
I honestly can't believe how undervalued **Super Micro Computer (SMCI)** is right now. This company is an absolute beast in its field—no layoffs, ever. While other tech companies are constantly "restructuring" and cutting staff, SMCI has been scaling up, increasing production, and solidifying its dominance. They’re not just good at what they do; they’re the **best** at it.
And let’s talk partnerships—**NVIDIA (NVDA) and Tesla (TSLA)** are working with SMCI, which tells you everything you need to know about their credibility and future potential. They just **broke through a major resistance level**, which is a strong technical signal that big moves are coming.
So why did the stock take a hit? A **CFO-related issue**—which, let’s be real, is minor in the grand scheme of things. Fundamentals haven’t changed. Demand for their high-performance computing solutions is only going up, and their execution has been nothing short of stellar. **The outlook is ridiculously strong.**
Right now, SMCI isn’t just undervalued—it’s a rare opportunity.
News / Reports
Source A: link
Source B: link
Source C: link
If you want to take a close look at some current news and reports, feel free to read these articles!
Disclaimer: This is my personal trading perspective and not formal investment advice. Always do your own research, double check my findings, and manage your risk accordingly.

SMC I dont think its ready yet...SMCI Daily Chart Analysis & Prediction (March 14, 2025)
1. Key Observations from the Chart:
• Recent Bounce Off Support: SMCI has rebounded from a key support level around $30.30 and is attempting to hold above its ascending channel.
• Major Support & Resistance Levels Identified:
• Resistance Levels:
• $39.84 – Immediate resistance; must break for upside movement.
• $45.29 – Strong resistance; previous rejection area.
• $48.98 - $63.05 – Major resistance zone; unlikely to be tested tomorrow unless a major rally occurs.
• Support Levels:
• $39.08 – Currently being tested; a break below could push SMCI lower.
• $30.30 – Major long-term support if $39 fails.
⸻
2. Trend Analysis & Chart Patterns
• Short-Term Uptrend Still Intact: SMCI is trading in a rising channel, but a breakdown could lead to a test of lower levels.
• Moving Averages Acting as Resistance: The 200-day EMA around $40.32 is acting as a key resistance zone.
⸻
3. Indicator Analysis
Stochastic RSI (Middle Panel - Momentum Indicator)
• Currently near neutral levels (~47.78), suggesting room for movement in either direction.
• No confirmed bullish crossover yet, meaning upside momentum is still weak.
MACD (Bottom Panel - Trend & Momentum)
• Bearish MACD Cross Confirmed:
• MACD histogram is slightly negative, signaling weak selling momentum.
• A bullish crossover could indicate a shift in trend.

SMCI - Let's bring it home, baby!SMCI, I'm waiting. See me? I'm standing in the doorway. The front porch light is on. Despite what you may have done in the past, I forgive you and want you to come home. NOW HIT THA TARGET!

Put your seatbelts on for $SMCI to $55-65 range- NASDAQ:SMCI traders be ready to pounce and ride the momentum for this name.
- Buyers are getting aggressive and price can easily be pushed to 55 ( 200 sma ) to 65 range.
- $55 seems to be a resistance, if price moves above that then we could be seeing some parabolic moves in this name.
- Please Notes that, NASDAQ:SMCI has to submit SEC filing before Feb 25, 2025 and CEO re-assured that they would be filing the documents to SEC in time.
- So, next 2 weeks, buckle up your seatbelts for volatility!

Are the Bears Coming out or false alarm?Here we have SMCI on the hourly chart, we recently just had a bearish cross over with the 200 SMA crossing over the 50 SMA. Price was consolidating and then broke out of the downward parallel channel but if price does not overcome the 39.16 price, we might see some lower prices for SMCI. Please see chart for key levels

The calm before the stormA retest of the breakout area, if buyers step in at this support, the next move higher could have strong conviction, I am loving this play, lets see how this play out,

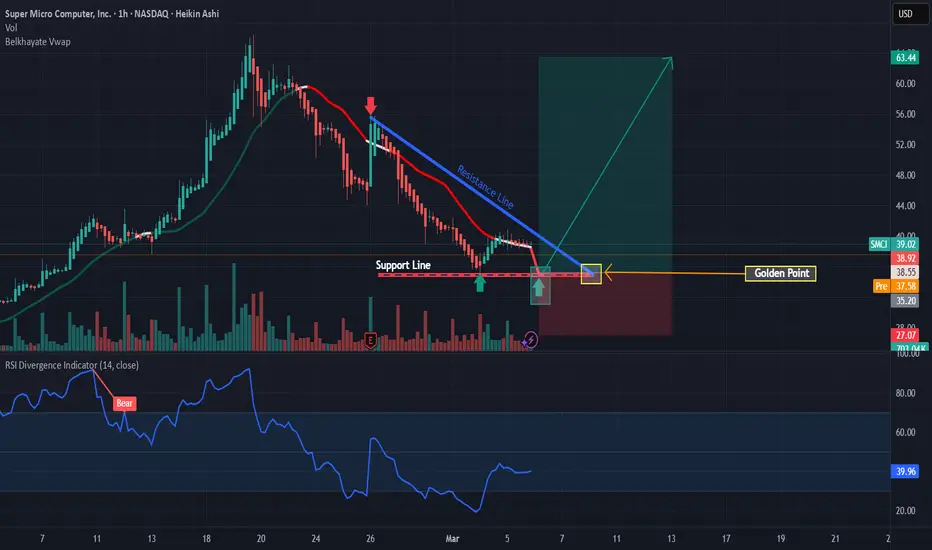
SMCI: Buy ideaOn SMCI we would have a high probability of having an uptrend after the bounce on the support line as you can see on the chart.
Smci monthly chart SMCI monthly chart
I see very good engulfing candlestick pattern
I bought this stock 4 long 🙏
I support this stock
Good luck 4 all 👑🃏

SMCI Approaching Key Reversal Zone – Breakout or More Downside?Technical Analysis (TA):
1. Trend & Structure:
* SMCI has been in a strong downtrend, marked by multiple Break of Structure (BOS) signals.
* A Change of Character (ChoCH) has occurred, hinting at a potential reversal if confirmed.
* Resistance: ~43 (Call Resistance), 57-60 (Major Supply Zone).
* Support: ~35-38 (Demand Zone & Highest Negative NETGEX).
2. Reversal Zone:
* The 35-38 range is a key demand area where buyers have previously stepped in.
* If SMCI holds above 38, it has potential to test 43 before further upside.
* A failure to hold 38 could see retesting 35 or lower.
3. Indicators:
* MACD: Neutral, with potential for a bullish cross.
* Stochastic RSI: Oversold, signaling possible upward momentum.
* Volume: Increased buying near the 38 level suggests accumulation.
Options GEX & Trade Setup:
1. Call Walls (Resistance):
* 43 – First resistance where price may stall.
* 57-60 – If price clears 43, gamma resistance intensifies.
2. Put Walls (Support):
* 38 – Highest negative NETGEX support, critical for reversal.
* 35 – 2nd major Put Wall; a break here could accelerate downside.
3. Option Trade Suggestions:
* Bullish Play: If price holds above 38 and starts breaking 40, consider April 40C or 45C targeting 43-45.
* Bearish Play: If SMCI breaks below 38 with weakness, consider March-April 35P targeting 35 or lower.
Thoughts & Conclusion:
SMCI is at a critical decision point around 38. If it reclaims 40, it could push toward 43-45, but failure to hold 38 could send it lower to 35. Traders should wait for confirmation of either a breakout or breakdown before committing to a trade.
Disclaimer:
This analysis is for educational purposes only and does not constitute financial advice. Always do your own research and manage risk accordingly.

SMCI - Updated Analysis and Potential Entry PointsThis has been an interesting start since the massive 80%+ downfall. I'm always looking to start building positions in companies that are sitting in undervalued territory and although that doesn't necessarily mean we're going to jump tomorrow, it is how you build a solid longer term portfolio of value.
Happy Trading :)

SMCI - Trade#2: PullbackEntered SMCI again, and 1D prints a piercing candle if it closes today above $40 key support. Although it has broken, a recovery above will resume the uptrend.
The upside swing target remains a mid-term breakout of the trend line. Holding this stock for 3-5 months can be profitable.
A secondary position is the sideways here.

SMCI/USD – 30-Min Long Trade Setup!📌 🚀
🔹 Asset: SMCI (Super Micro Computer, Inc.)
🔹 Timeframe: 30-Min Chart
🔹 Setup Type: Bullish Reversal Trade
📌 Trade Plan (Long Position)
✅ Entry Zone: Above $36.07 (Breakout Confirmation)
✅ Stop-Loss (SL): Below $33.81 (Invalidation Level)
🎯 Take Profit Targets:
📌 TP1: $39.62 (First Resistance Level)
📌 TP2: $43.63 (Extended Bullish Move)
📊 Risk-Reward Ratio Calculation
📉 Risk (SL Distance): $36.07 - $33.81 = $2.26 risk per share
📈 Reward to TP1: $39.62 - $36.07 = $3.55 (1:1.6 R/R)
📈 Reward to TP2: $43.63 - $36.07 = $7.56 (1:3.3 R/R)
🔍 Technical Analysis & Strategy
📌 Falling Wedge Breakout: Price has broken out of a falling wedge, a strong bullish reversal pattern.
📌 Support Rejection: The price tested $36.07 support and showed buying pressure.
📌 Volume Confirmation Needed: Ensure high buying volume when price holds above $36.07 to confirm bullish momentum.
📌 Momentum Shift Expected: If price remains above $36.07, it could push toward $39.62, and further to $43.63.
📊 Key Support & Resistance Levels
🟢 $33.81 – Stop-Loss / Support Level
🟡 $36.07 – Breakout Level / Long Entry
🔴 $39.62 – First Resistance / TP1
🔴 $43.63 – Final Target / TP2
📉 Trade Execution & Risk Management
📊 Volume Confirmation: Ensure high buying volume above $36.07 before entering.
📉 Trailing Stop Strategy: Move SL to entry ($36.07) after TP1 ($39.62) is hit.
💰 Partial Profit Booking Strategy:
✔ Take 50% profits at $39.62, let the rest run toward $43.63.
✔ Adjust Stop-Loss to Break-even ($36.07) after TP1 is reached.
⚠️ Fake Breakout Risk
❌ If the price fails to hold above $36.07 and drops back, exit early to avoid losses.
❌ Wait for a strong bullish candle close above $36.07 before entering aggressively.
🚀 Final Thoughts
✔ Bullish Setup – Bouncing from support at $36.07 suggests a potential reversal.
✔ Momentum Shift Possible – Watch for volume confirmation.
✔ Favorable Risk-Reward Ratio – 1:1.6 to TP1, 1:3.3 to TP2.
💡 Stick to the plan, manage risk, and trade smart! 🚀📈
🔗 #StockMarket 📉 #TradingNews 📰 #StockAnalysis 📊 #MarketUpdate 🔥 #Investing 💰 #Trading 📈 #Finance 💵 #ProfittoPath 🚀 #SwingTrading 🔄 #DayTrading ⚡ #StockTrader 💸 #TechnicalAnalysis 📉 #EconomicNews 🏛️ #FinancialFreedom 💡 #MarketTrends 📊 #StockAlerts 🔔 #TradeSmart 🤓 #Bullish 🐂 #RiskManagement ⚠️ #TradingCommunity 🤝

SMCI TOO CHEAP TOO MANY SHORTS...Imagine a company that’s not just riding the AI wave but steering it—Super Micro Computer (SMCI) is that titan. With demand for its servers skyrocketing—think $14.94 billion in 2024 revenue, doubled from the prior year, and a $40 billion 2026 target—it’s the undisputed king of high-performance computing. Why? SMCI’s mastered the art of execution, delivering custom, energy-efficient servers faster than anyone. Its secret weapon? Liquid cooling technology, backed by 9 critical patents, that’s revolutionizing data centers. While others scramble to keep up, SMCI’s already shipped over 100,000 liquid-cooled GPUs, slashing power costs by up to 40% and meeting the insatiable needs of AI factories.
This isn’t new for SMCI. As a motherboard manufacturing pioneer since 1993, it’s spent decades perfecting modular, scalable designs—think Lego bricks for tech giants. That legacy, paired with its server supremacy, creates an unassailable moat. Dell and HP? They’re playing catch-up. Dell’s AI servers are a fraction of its business (5% of revenue), and HP’s enterprise arm lacks SMCI’s agility. Neither matches SMCI’s rack-scale integration or its chokehold on Nvidia’s ecosystem—SMCI’s the go-to for Blackwell GPUs, where liquid cooling is non-negotiable. Competitors face a brutal truth: SMCI’s patents and speed-to-market are a wall too high to climb.
Yet, at ~$36 today (March 3, 2025), SMCI’s shares scream undervalued. A forward P/E of 20-25, with 54% YoY growth in Q2 2025 prelims ($5.6-$5.7 billion), dwarfs Dell’s 15 P/E on slower gains. The Street’s “Hold” and $45-$53 targets miss the mark—SMCI’s moat and demand suggest $70-$100 is closer. Tariff fears and audit noise? Temporary static. With 85% institutional ownership and AI infrastructure spending surging (Gartner predicts $367 billion in 2025 data center spend), SMCI’s poised to soar. This isn’t just a stock—it’s a steal, a front-row seat to the AI revolution, with a moat that leaves rivals drowning in its wake.

$SMCI: Super Micro Computer – AI Server Surge or a Pit Stop?
NASDAQ:SMCI : Super Micro Computer – AI Server Surge or a Pit Stop?
AI infrastructure’s hotter than a July barbecue, with revenue up 110% to $14,989.2 million in 2024! But with internal control concerns, is this tech beast charging up or taking a breather? Let’s dive in!
(1/9)
Good morning, everyone! ☀️ NASDAQ:SMCI : Super Micro Computer – AI Server Surge or a Pit Stop?
AI infrastructure’s hotter than a July barbecue, with revenue up 110% to $14,989.2 million in 2024! But with internal control concerns, is this tech beast charging up or taking a breather? Let’s dive in! 🔍
(2/9) – PRICE PERFORMANCE 📊
• Fiscal 2024: Net sales soared 110.4% to $14,989.2 million 💰
• Server Systems: Up 115.9%, GPU servers leading the charge 📏
• Sector Trend: AI demand’s skyrocketing 🌟
It’s a wild ride, fueled by AI’s hunger! ⚙️
(3/9) – MARKET POSITION 📈
• Market Cap: $2.4B, based on shares outstanding 🏆
• Holdings: Servers, storage, and AI solutions ⏰
• Trend: International sales steady at 32%, showing global appetite 🎯
Firm, carving a niche in AI infrastructure! 🚀
(4/9) – KEY DEVELOPMENTS 🔑
• 10-K Filing: Dropped Feb 25, 20
25, dodged NASDAQ delisting 🔄
• Revenue Driver: GPU servers for AI workloads 🌍
• Market Reaction: Shares jumped 19.8% after-hours 📋
Adapting, with investors cheering the comeback! 💡
(5/9) – RISKS IN FOCUS ⚡
• Internal Controls: Audit flagged issues, per Feb 25 filing 🔍
• Competition: Big players in AI server space 📉
• Volatility: High-growth sectors swing hard ❄️
Tough, but risks loom! 🛑
(6/9) – SWOT: STRENGTHS 💪
• Revenue Boom: 110% growth, $14,989.2 million in sales 🥇
• AI Focus: GPU servers crushing it 📊
• Global Reach: 32% international sales 🔧
Got rocket fuel in the tank! 🏦
(7/9) – SWOT: WEAKNESSES & OPPORTUNITIES ⚖️
• Weaknesses: Internal control concerns, per audit 📉
• Opportunities: AI infrastructure demand keeps soaring 📈
Can it fix the cracks and ride the wave? 🤔
(8/9) – 📢 SMCI’s revenue up 110%, with AI demand exploding, your take? 🗳️
• Bullish: Shares to $50+ soon, AI’s unstoppable 🐂
• Neutral: Steady, risks balance growth ⚖️
• Bearish: $35 looms, controls spook 🐻
Chime in below! 👇
(9/9) – FINAL TAKEAWAY 🎯
SMCI’s revenue surge to $14,989.2 million screams AI potential 📈, but control issues add a pinch of caution 🌿. Volatility’s our friend—dips are DCA gold 💰. Grab ‘em low, climb like pros! Gem or bust?

HOW TO use the Acceleration Bands HTF indicatorYou can access this indicator HERE:
For details about the indicator, please see the indicator's description.
This idea is about the use of it.
You always want to go with the trend and trade into the direction that "accelerates" according to the indicator.
When the price accelerates, it is more likely to continue than to reverse.
Also, the volatility will be much greater (momentum) to the acceleration direction.
All the explosive moves happen outside of the acceleration bands.
You can go over many charts and see that the indicator methodology is aligned with good trading principles of great traders such as Darvas Box Trading, and Jesse Livermore entries, and also SMC.

Double Zigzag?Hey guys, in my opinion, the price is currently forming an ABC correction, with waves A and B already completed, and we are now in wave C of the correction.

SMCI Pulling Back After Earnings Surge! Is a Bounce Coming? Technical Analysis for February 27, 2025:
1. Current Price Action:
* SMCI spiked following earnings but has since retraced, now trading near $48.20.
* The stock is testing key support at $48.50, a crucial level for a potential bounce.
* POC (Point of Control) at $51.08 is the major level that bulls need to reclaim.
2. Key Levels to Watch:
* Support: $48.50 (Current level), $45.50, $41.64 (Major downside risk).
* Resistance: $51.08 (POC), $58.28 (Breakout zone).
* Upside Targets: $57, $60, $66.42.
3. Indicators Analysis:
* MACD: Bearish momentum, showing weakness.
* Stoch RSI: Extremely oversold, signaling a potential short-term bounce.
* Volume Profile: Heavy liquidity between $48.50 and $51, meaning strong accumulation.
GEX & Option Strategy for Tomorrow and the Week:
1. Gamma Exposure (GEX) Insights:
* Call Walls: $57, $60 → Resistance areas.
* Put Walls: $39, $35 → Major support.
2. IV & Sentiment:
* IVR: 41.1 (Moderate)
* IVx Avg: 136 (High IV, potential for premium selling).
* Call Positioning: 99.8% bullish sentiment.
* GEX Sentiment: Bullish if $51 is reclaimed.
3. Trading Suggestions:
* Bullish Setup: If SMCI reclaims $51, consider long positions targeting $57-$60, with a stop at $48.
* Bearish Setup: If SMCI breaks below $48, short setups targeting $45-$42, stop at $50.
* Options Play: Selling put spreads at $45 support or call spreads near $60 resistance.
📌 My Thoughts & Suggestion:
* SMCI remains highly volatile due to earnings—watch for a reclaim of $51 for a bullish continuation.
* If $48 fails, expect a test of $45-$42.
* High IV makes option selling attractive, especially for short-term plays.
⚠️ Disclaimer:
This analysis is for educational purposes only and does not constitute financial advice. Always do your own research and manage your risk before trading. 🚀

SMCI ...Super-Calcula-aand its GoneHere is the 4hr chart with the Rainbow-Railroad employed...Make sure as always to use the Log "L" function in the bottom right to see hidden levels..
10 min close up of earnings with Log:
10 min close up of earnings without Log:
10 min panned view of recent price action with Log:
10 min panned view of recent price action without Log:

SMCI Bullish Parabolic Move Ahead.Super Micro Computer (SMCI) and spotting a bullish setup with wave patterns marked on the charts. Volatility can definitely make things exciting but also tricky—those waves might signal a big move.
Consider risk before investing. Kindly share and boost this idea if you like it :)
