4SPOT trade ideas

SPOT Newbie Analysis [5 Sep 2021]I know a lot of traders are bullish on this, however I can't see the breakout of the downtrend yet.
Any advise?
Wait for price confirmation or enter with a tight stop loss.
- Current price 251.23 is still within the two downtrend Line.
- Current price hit resistance on 150/200 Daily EMA.
- Daily still show strong bullish candle.
I was in a lost trade during the downtrend, and manage to turnaround and sold it at a good profit during the trend reversal. Re-entry and sold it off again on 3 Aug when there is a slight pullback.
Trying to learn to put in more effort in risk management after few lost trades.
Plan
Thinking to enter the trade at suport level between 243.32 - 246.18 with a tight stop loss.
If it goes well, it should go above 277.67, otherwise a bearish double top will form.
Stop Loss
-3
Price Target
- 277.67 (previous high)
This is not financial advice.
Please be kind, I am really new and welcome constructive feedback:)

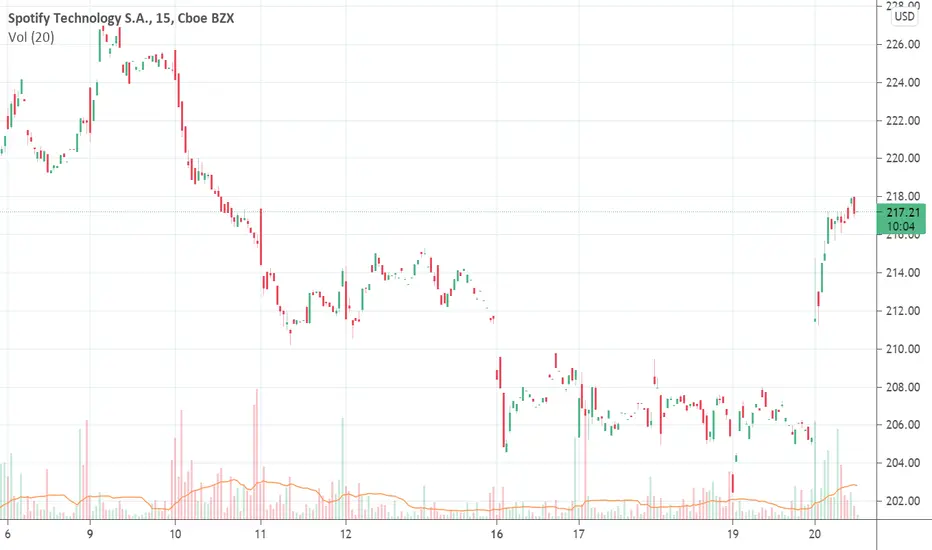
Spotify - Breaking Out of the Downtrend ChannelSpotify looking to finally break out of the 6-8 month long downtrend channel. Picked some up at $221 price range. May pick up more if we retest the channel lines for support level.
Feel free to give us a follow and shoot us a like for more analysis updates.
Cheers!
Disclaimer:
I do not provide personal investment advice and I am not a qualified licensed investment advisor. I am an amateur investor.
All information found here, including any ideas, opinions, views, predictions, forecasts, commentaries, suggestions, or stock picks, expressed or implied herein, are for informational, entertainment or educational purposes only and should not be construed as personal investment advice. While the information provided is believed to be accurate, it may include errors or inaccuracies. I will not and cannot be held liable for any actions you take as a result of anything you read here.
Conduct your own due diligence, or consult a licensed financial advisor or broker before making any and all investment decisions. Any investments, trades, speculations, or decisions made on the basis of any information found on here, expressed or implied herein, are committed at your own risk, financial or otherwise.
Feel free to give us a follow and shoot us a like for more analysis updates.

SPOT broke past the 30 day MA, whats next?SPOT has been gaining traction lately after being in a downtrend for some time. Bollinger Bands indicating a 247 resistance which matches around with the volume shelf. I could go far as to say SPOT might get to 260s before letting the volume shelf around 245 act as support before the next leg up.

Spotify Analysis 28.08.2021Hello Traders,
welcome to this free and educational analysis.
I am going to explain where I think this asset is going to go over the next days/weeks and where I would look for trading opportunities.
If you have any questions or suggestions which asset I should analyse tomorrow, please leave a comment below.
I would also appreciate, if you would smash that like button and help me to create more free analysis like that.
Thank you for watching and I will see you tomorrow!

$SPOTA lot has happened to Spotify during the last year.
The stock soared over 165% and reached $364 in February. Since then, the stock price has declined by over 40% since.
Spotify continues its global dominance, adding 27 million net subscribers between Q1 2020 and Q1 2021, more than any other single service. However, it lost two points of market share over the period because its percentage growth rate trailed that of its leading competitors. \
Google was the fastest-growing music streaming service in 2020, growing by 60%, with Tencent second at 40%. Amazon continued its steady trajectory, up 27%, while Apple grew by just 12%.
But moving onto the technical side of things.
Spotify is a classic example of previous resistance now acting as support.
Price closed on a hammer on the weekly.
MACD curling w/ the RSI above 50.
Keep this on your watchlist.

spot buy buy after the break at 230.55. macd helps a lot.. stoploss at 199.75. we'll going long on this trade.

Head and ShouldersHead and shoulder tops do not always reach the down targets in a bull market. The inverse head and shoulders performs much better in a bull market, vice versa for a bear market.
SPOT has passed the neckline which would have been former support before that support was breeched.
I drew green dashed lines where I see support, but you may see it elsewhere. When a security is doing this, going down, I watch the support levels and wait for a breech of that level if it occurs, then I set an alert for the next level.
On the bearish side: There was a death cross a while back and the 50 SMA crossed down through the 200 SMA. Price is still under the 50 which many consider bearish. The 4 moving averages I used are all sloping down and opposite of where they need to be. The 20 is on bottom and the 200 is on top.
I do see a large volume bar recently.
Many consider the first warning sign to possibly sell is when price goes under the 50. The second is when a death cross occurs.
Surprisingly, short interest is lower than I thought it would be at around 4% depending on where you look. Possible targets down are in orange down below, but as I mentioned, H&S do not always hit down targets in a bull market.
No recommendation

$SPOT on...SPOT has been on an epic downtrend sitting -45% from it’s all time high but bouncing off it’s original resistance (now support) of $200. With more volume across the option chain than I can remember, taking a small position with any close above $215 (prior support). This trade is bullish near term for a small bounce up toward it’s next resistance level of $240.

Spotify Announces Stock Repurchase Program, Up to $1.0 Billion!!SPOT: Spotify Technology S.A.
2021-08-20 06:00:00
Spotify Announces Stock Repurchase Program, Up to $1.0 Billion


spot lookin' spotty. swing short.spot with the legit h & s pattern. weak price action. yesterday's bounce should have continued for spot but overall market weakness dragged it down. if spot continues to get weak price action expect waterfall price action.

SPOT; Head and Shoulders vs Wyckoff dosDisclaimer
This is purely a chart analysis, nothing more. I know very little on the analyst ratings for Spotify, I have little knowledge on the ownership, news, business plans, nada.

Double bottom on the dailySpotify looking undervalued and nice double bottom on daily candle. Looking like a good buy signal if Monday candle is bullish.
disclaimer: Not financial advice

POTENTIAL HEAD AND SHOULDERS IN SPOTPotential H&S pattern emerging in SPOT. Trigger below 211. first target 198 then 184. Stop at 221 NYSE:SPOT

SPOT, at CrossRoadSpotify, the famous audio streaming portal has completed a head and shoulder top
However, price is sitting around the median channel line.
Which is why i feel it is a 50-50 case
Should neckline be broken down, next immediate level is around 198, further downside includes 160 and 120
However, if this is just another complete retracement and price begins to go up, immediate level is around 280
Just a research opinion


SPOTWeekly chart of SPOT. Shares are currently at the 61.8% retracement from the Covid lows. RSI is also at a critical support at 38.2. This RSI level provided strong support in the past. So, needs to hold this level.

$SPOT Majorly OversoldSpotify shares overreacted to the earnings call a couple of days ago, but it left us with a phenomenal buy opportunity. I am targeting $290. Good Luck!

SPOT
Retracement to the critic support, right now needs still above the support, I expect a bounce from here... maybe happens, maybe not

Spotify (SPOT) Stock. A Lot Of Buy Signals On D1.Spotify (SPOT),D1: Support level + Bollinger bands + Hammer + Volume + Oversold + Discout

SPOT LONGGoing LONG on Spotify.
Looks like a great entry zone, will DCA over coming weeks should the stock dip any further.
** NOT TRADING ADVICE **
