Tesla earnings setup favours upsideTesla is scheduled to report its second-quarter results on Wednesday 23 July, after the New York close of trading. The company is forecast to report revenue of $22.8bn, representing a 10.5% year-on-year decline, with earnings expected to decrease 19% to $0.34 per share. Gross profit margins are also anticipated to contract by 2.3 percentage points to 16.4%, down from 18.7% last year.
Tesla does not provide traditional guidance but instead offers a business outlook. In its first-quarter release, the company noted difficulties in assessing the impact of shifting global trade policies and stated it would revisit its 2025 guidance during the second-quarter update. Consequently, investors will undoubtedly be focused on any insights regarding 2025 delivery forecasts, especially given the weak performance in the first half of 2025.
Given the current uncertainty, the market is pricing in a 7.5% rise or fall in the shares following the earnings release. Options positioning is relatively neutral, with only a slight bullish bias. However, there is significant support for the stock between $280 and $300, marked by substantial put gamma levels. Conversely, resistance from call gamma exists between $325 and $330. This setup suggests that it could be easier for the stock to rise rather than fall following the results.
The technical chart clearly illustrates this scenario, highlighting strong support around $290 that dates back to March. More recently, the shares have encountered resistance around the $330 mark. If Tesla can successfully break above this resistance, the stock could move towards approximately $360, while downside seems limited to around $290 to $300.
Written by Michael J. Kramer, founder of Mott Capital Management.
Disclaimer: CMC Markets is an execution-only service provider. The material (whether or not it states any opinions) is for general information purposes only and does not take into account your personal circumstances or objectives. Nothing in this material is (or should be considered to be) financial, investment or other advice on which reliance should be placed.
No opinion given in the material constitutes a recommendation by CMC Markets or the author that any particular investment, security, transaction, or investment strategy is suitable for any specific person. The material has not been prepared in accordance with legal requirements designed to promote the independence of investment research. Although we are not specifically prevented from dealing before providing this material, we do not seek to take advantage of the material prior to its dissemination.
4TSLA trade ideas
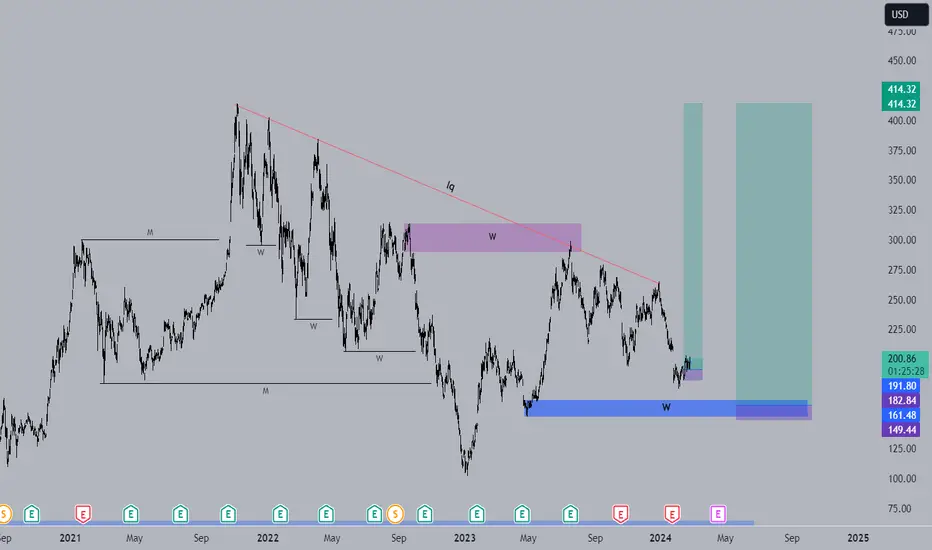
TSLA - Explosive Bounce TSLA Before the Drop? | EW Analysis My primary view is that we’re in the final stages of an ending diagonal, which could lift the price to new all-time highs, potentially between $460 and $650. Wave 4 of this structure appears to have completed after precisely tagging key Fibonacci support, and since then, we've already seen a strong bounce from that low. I’m now watching for the development of the final wave in this pattern, which could deliver gains of over 100% from current levels.
However, I’m not fully convinced by the internal shape of the diagonal so far. That’s why I’m also have an alternative scenario: in this case, the recent low may have marked the end of Wave 2 within a much larger diagonal. If true, this opens the door to a much more extended rally potentially reaching $1,000 before we see a major correction.
That said, this second scenario is not my preferred one, and a decisive break below the recent lows would invalidate both counts.

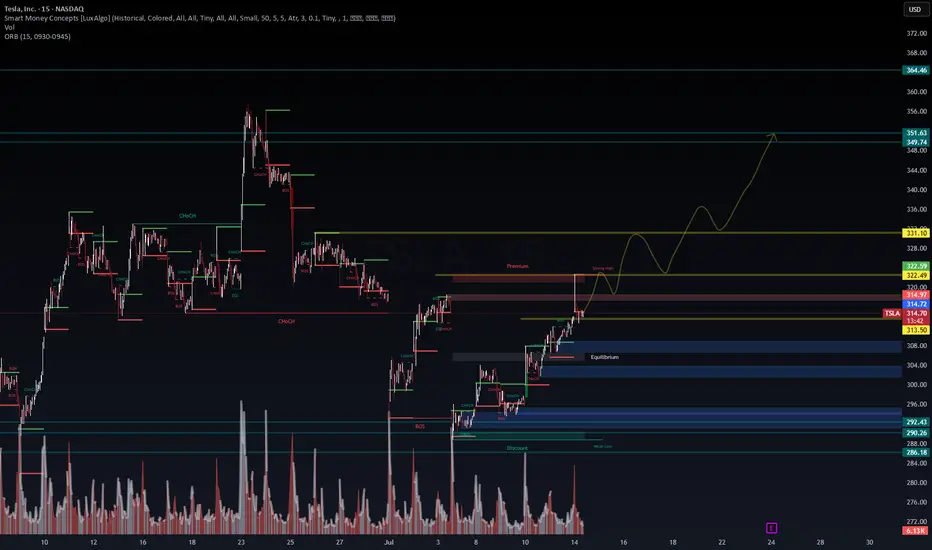
TSLA | Breakout Fuel Loaded – Will the Trend Accelerate Toward 🚗 TSLA | Breakout Fuel Loaded – Will the Trend Accelerate Toward $350?
🔍 Chart Type: 15m
🧠 System: Smart Money Concepts (LuxAlgo) + WaverVanir DSS
📊 Volume: 2.08M
🧭 Narrative: Liquidity Engine + Bullish Flow Momentum
📈 Current Price: $314.78
Clean breakout above BoS and ChgofCHoCH
Currently testing Strong High within a defined Premium Zone
EMA Stack (20/50/100/200) is bullishly aligned
📌 Key Levels to Watch:
📍 Premium Resistance: ~$315–$318
⚖️ Equilibrium Support: ~$309
💧 Discount Liquidity Zones: $292.43, $290.26
🚀 Upside Targets:
Minor: $322.49
Mid: $331.10
Major: $349.74 → $351.63 (projected wave peak)
📈 Bullish Case (Preferred by DSS Flow Model):
Retest of strong high → rally toward $322 then $331
Momentum and volume support trend acceleration
Break of $331 opens path toward $349.74–$351.63 (final wave)
📉 Bearish Invalidator:
Break below equilibrium ($309) → Discount zone retest
Watch $292–$286 for final liquidity sweep if rejection occurs
📅 Catalyst:
Earnings (📦 E icon marked) + macro tech sentiment could ignite explosive continuation
Market structure favors liquidity vacuum toward premium targets
🧠 VolanX DSS Sentiment: STRONG BULLISH
✅ Structure: Uptrend
✅ Volume: Expanding
✅ Momentum: Aligned
🟡 Risk: Premium rejection short-term possible
🔁 Executed via VolanX AI Scanner + WaverVanir DSS Engine
📊 “The Edge Is a System. The System Is Intelligence.”™
#WaverVanir #TSLA #SmartMoneyConcepts #PriceAction #LiquidityZones #Tesla #TechnicalAnalysis #VolanX #InstitutionalEdge #AITrading #QuantFinance
Tesla Stock in Bearish Trend - Further Downside ExpectedTesla Stock in Bearish Trend - Further Downside Expected
Tesla's (TSLA) stock price continues to display a clear bearish trend structure, characterized by the formation of consistent lower lows and lower highs on the price chart. This technical pattern suggests sustained selling pressure and indicates the downtrend will likely persist in upcoming trading sessions.
Key Technical Observations:
- Established Downtrend: The consecutive lower highs and lows confirm the bearish price structure remains intact
- Weak Momentum: Each rally attempt has failed to gain traction, meeting selling pressure at progressively lower levels
- Critical Price Levels: The stock has established well-defined resistance and support zones for traders to monitor
Price Projections:
- Downside Target at $272: The bearish momentum could drive TSLA toward the $272 support level, representing a potential 15% decline from current levels
- Key Resistance at $370: Any recovery attempts will likely face strong selling pressure near the $370 level, which now serves as a major resistance barrier
Market Implications:
1. Bearish Continuation Expected: The prevailing trend structure favors further downside unless a significant reversal pattern emerges
2. Breakdown Risk: A decisive move below current support levels could accelerate selling momentum toward $272
3. Short-Term Rally Potential: While the overall trend remains down, temporary rebounds toward $370 may present selling opportunities
Trading Considerations:
- Short Positions: Consider maintaining bearish exposure while price remains below the $370 resistance level
- Stop Loss: A sustained break above $370 would invalidate the immediate bearish outlook
- Profit Targets: $272 serves as the primary downside objective, with potential support levels to watch along the way
Risk Factors to Monitor:
- Market sentiment shifts in the EV sector
- Changes in Tesla's production/delivery outlook
- Broader market conditions affecting tech/growth stocks
The technical setup suggests Tesla shares remain vulnerable to further declines, with $272 emerging as the next significant downside target. Traders should watch for either confirmation of the bearish continuation or potential reversal signals near key support levels. As always, proper risk management remains essential when trading in trending markets.

A Strategic Long Opportunity Amid VolatilityCurrent Price: $316.06
Direction: LONG
Targets:
- T1 = $324.00
- T2 = $328.50
Stop Levels:
- S1 = $312.50
- S2 = $308.00
**Wisdom of Professional Traders:**
This analysis synthesizes insights from thousands of professional traders and market experts, leveraging collective intelligence to identify high-probability trade setups. The wisdom of crowds principle suggests that aggregated market perspectives from experienced professionals often outperform individual forecasts, reducing cognitive biases and highlighting consensus opportunities in Tesla.
**Key Insights:**
Tesla’s stock presents both short-term risks and long-term upside opportunities. Despite recent earnings misses and margin compression, its pivot into AI and robotics offers significant growth opportunities. Upside resistance zones near $325-$330 create favorable price targets, while support levels at $307-$310 suggest strong buying interest. This environment could favor a long trading strategy, provided disciplined risk management is maintained.
**Recent Performance:**
Tesla recently experienced notable sell-offs following disappointing earnings, attributed to compressed margins and weaker EV demand. However, the stock rebounded 3.5% from last week’s lows, signaling resilience amid uncertainty. Year-to-date, Tesla remains one of the top-performing stocks with a 54% price increase, reflecting strong underlying investor confidence in its long-term story.
**Expert Analysis:**
Market experts are divided on Tesla’s trajectory. Near-term fundamentals appear challenging with declining revenue (-12% YoY) and price cuts impacting profitability. However, bullish projections from analysts such as Kathy Wood highlight Tesla’s potential for disruptive innovation in AI and robotics. Its ambitious initiatives like robo-taxi deployment add speculative appeal but also introduce scaling and regulatory risks.
**News Impact:**
Tesla’s upcoming robo-taxi launch in San Francisco is poised to impact market sentiment significantly. While safety drivers will be required during the initial rollout, scalability and regulatory challenges could limit the project’s immediate impact. Meanwhile, recent disappointing earnings results may weigh on sentiment in the short term while providing an opportunity for potential retrishments off support levels.
**Trading Recommendation:**
Given the current setup, Tesla appears poised for long-term growth, with upside resistance levels suggesting a viable rally opportunity. Investors should consider taking a bullish position while maintaining stops near key support zones to mitigate downside risks. This balanced approach aligns well with Tesla’s speculative appeal and broader investor sentiment.

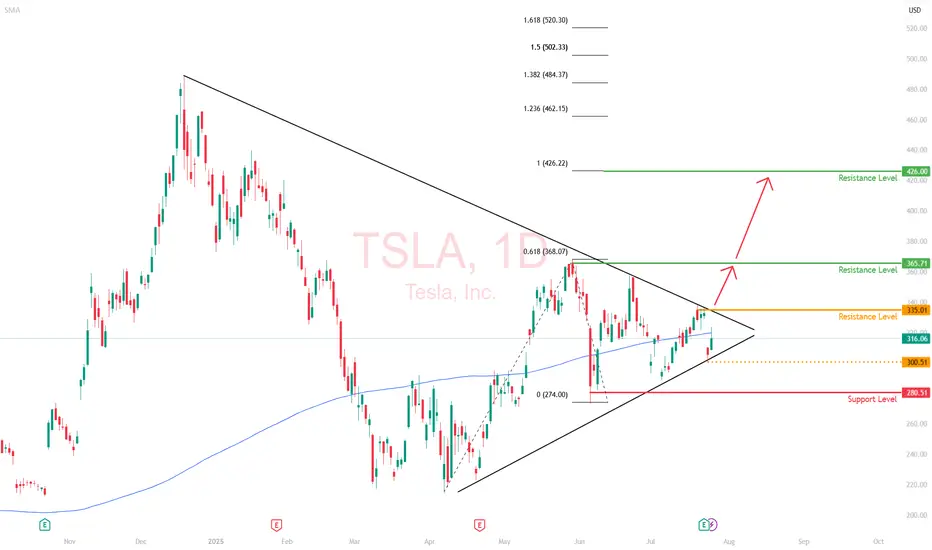
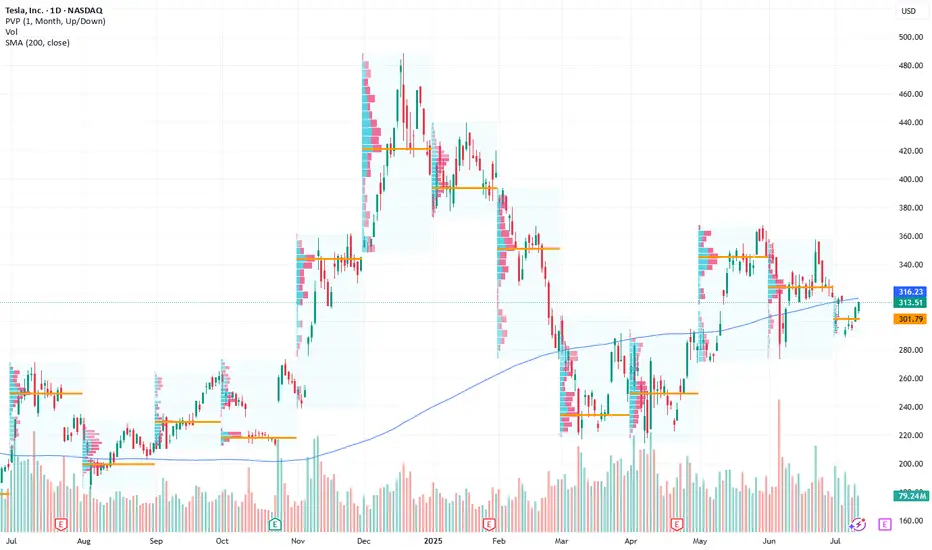
Tesla (TSLA) | Short-Term Compression, Long-Term ExTesla’s daily chart is coiled, with price currently trading at $316, sitting along the 200-day moving average. This looks like a consolidation phase with significant moves building up.
Price Action Snapshot
TSLA sold off last week, rejecting the $335 resistance level before finding footing around $300. The previous range of $280 and $365 is now tightening.
Immediate resistance sits at $335 with a clean breakout above that zone likely triggering momentum back toward the upper range of $365.
The recent drop does not seem like a capitulation move; it's likely institutional redistribution. Smart money is repositioning, not exiting.
Market Is Focused on the Wrong Data
Tesla’s Q2 earnings were objectively weak. Revenue fell 12%, deliveries dropped, and operating margins got clipped.
But this correction isn't all about fundamentals. It is about the market adjusting to a company evolving beyond traditional valuation models.
While most investors are trying to value Tesla like a car company, it’s spending this entire phase retooling itself into an AI and autonomy-first enterprise. That transition doesn't show up in EPS yet (but it will).
The Bigger Picture is Being Missed
The robotaxi rollout in Austin is live. Expansion into California, Phoenix, and Florida is on the roadmap.
Tesla is building a vertically integrated, owner-driven ride-hailing model that could eventually bypass both Uber and legacy OEMs entirely.
Optimus is no longer a lab prototype—it’s moving toward scalable production by 2026.
If Tesla even partially succeeds in general-purpose robotics, it will unlock a Technology Acceptance Model (TAM) that dwarfs the current EV narrative .
Daily Technical Outlook
We’re currently in a bullish compression, with higher lows forming against the resistance area of $365. If $280 holds and the price continues to grind within this wedge, it sets up a volatility breakout scenario.
The breakout level to watch is $335. A daily close above that reopens $365. And beyond that, the resistance level is at $426.
My View
Tesla is compressing, both in price and narrative.
The long game is quietly coming into focus, where the risk/reward skews asymmetrically in favor of the upside.
This daily compression won’t last forever, and when it resolves, the move will likely be outsized.
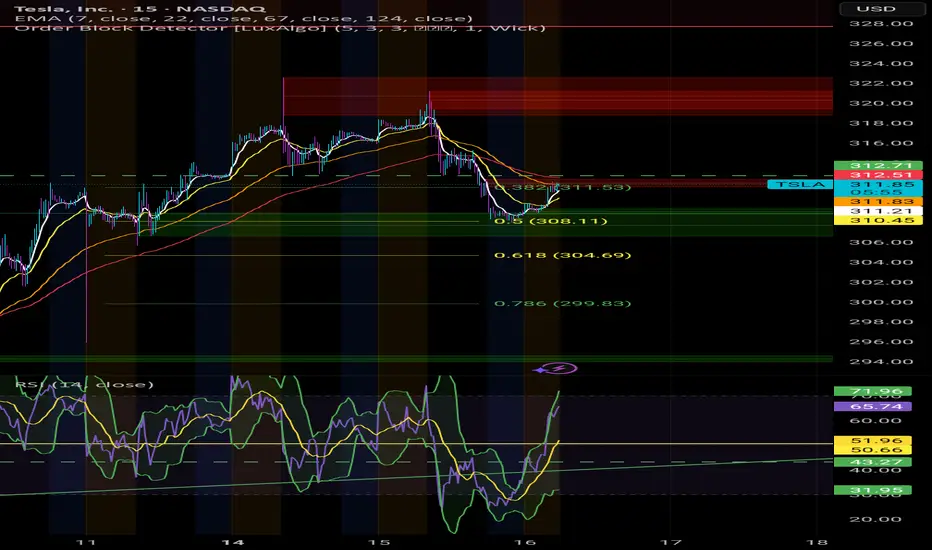
TSLA at the Edge of Reversal or Rally? Key Setup Ahead. Jul 28🔍 Technical Analysis (1H + 15M Confluence)
* Market Structure:
After a steep drop from $334, TSLA has shown a recovery off the $300.41 low. The 1H chart shows a bounce forming higher lows, with price now consolidating around $317–$318.
* SMC Insight (15M):
The bullish BOS and CHoCH signal a structural shift. Price has respected the ascending channel and reacted from the Fair Value Gap (FVG) inside a purple supply zone near $323–$325, indicating short-term resistance.
* Volume Analysis:
Volume increased on the bullish move off $302.5 demand zone, indicating possible accumulation, but stalled near resistance.
🔐 Key Supply & Demand Levels:
* Demand Zones (Support):
* $302.5 (1H GEX HVL zone + volume demand)
* $300.41 (last low & liquidity pocket)
* Supply Zones (Resistance):
* $323.62–$325 (15M supply + GEX resistance zone)
* $334–$338 (GEX7/High wall)
📈 Options Sentiment – GEX & Flow
* Gamma Walls (Resistance):
* $317–$323: Heavy CALL walls, especially at $320 (Gamma Wall)
* $335–$338: Strong GEX7 / GEX9 resistance — potential magnet only if TSLA breaks 325 cleanly
* PUT Walls (Support):
* $302.5: HVL + PUT support
* $295 & $290: Lower extreme GEX support (panic defense zones)
* Options Oscillator:
* IVR: 7.1 (very low — cheap premiums)
* IVx avg: 51.7 (slightly elevated fear)
* Call Bias: 68.8% bullish
* GEX Sentiment: ✅✅✅ bullish until $325, then neutral-to-risky
🎯 Trade Setups
✅ Bullish Setup (if price holds above $316–317):
* Entry: 317.50–318.00 (current consolidation)
* Target 1: 323.50 (supply)
* Target 2: 334.00 (GEX9 magnet)
* Stop-loss: 312.70 (SMC breaker structure + 15M CHoCH invalidation)
Scalp Target: 323
Swing Target: 334
Add Calls (weekly): Only above 320 breakout with volume.
❌ Bearish Setup (if price loses 312.70):
* Entry: < 312.50 breakdown
* Target 1: 305.30 (mid-demand)
* Target 2: 302.50 (HVL & GEX PUT support)
* Stop-loss: 316.10 (back inside channel, bullish flip invalid)
Scalp Target: 305
Swing Target: 302.5
Add Puts: Only below 312.5 with confirmation candle.
⚖️ Bias & Scenario Outlook:
* Neutral-to-Bullish Bias: As long as price holds above 316 and respects the ascending trendline.
* Risk Zone: 323–325 = possible reversal zone (heavy GEX wall + supply)
* Gamma Flip Above: 325 opens up 334–338.
📌 Conclusion:
TSLA is compressing between supply and demand. Monday’s price action around 317–320 will be key. A break above 320 could fuel a GEX chase to 334, while rejection may trigger a pullback toward 305–302. Stay nimble and let price confirm direction around key GEX walls and SMC structure.
⚠️ Disclaimer:
This analysis is for educational purposes only and does not constitute financial advice. Always do your own research and manage your risk before trading.

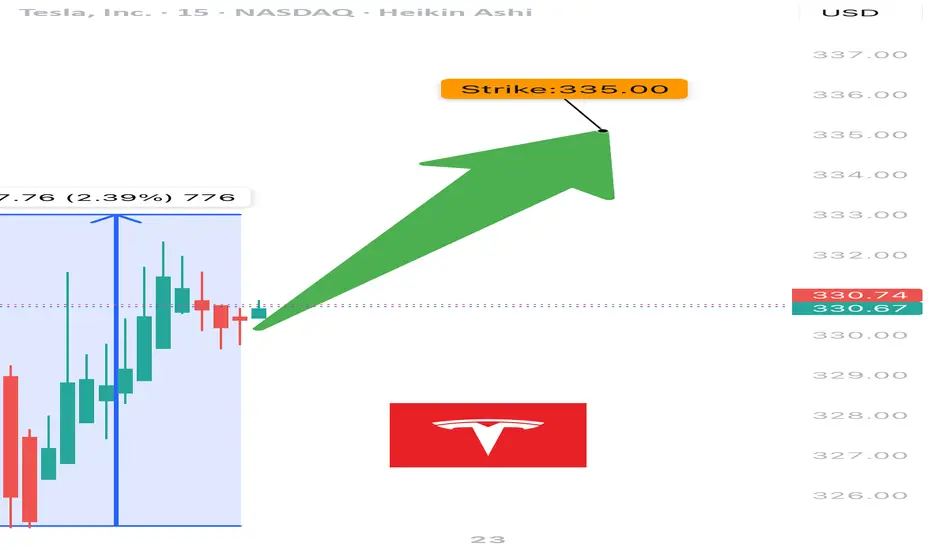
$TSLA Weekly Call Play – 07/22/25
🚀 NASDAQ:TSLA Weekly Call Play – 07/22/25
RSI Bullish 📈 | Options Flow Strong 🔁 | Volume Weak 💤 | 3DTE Tactical Entry
⸻
📊 Market Snapshot
• Price: ~$332–335 (spot near strike)
• Call/Put Ratio: 🔁 1.24 – Bullish Flow
• Daily RSI: ✅ 57.6 – Rising momentum
• Weekly RSI: ⚠️ 54.8 – Neutral / flattening
• Volume: ❌ Weak – Institutional absence
• Gamma Risk: ⚠️ Moderate (DTE = 3)
• VIX: ✅ Favorable
⸻
🧠 Trade Setup
{
"Instrument": "TSLA",
"Direction": "CALL",
"Strike": 335.00,
"Entry": 9.90,
"Profit Target": 15.00,
"Stop Loss": 6.00,
"Expiry": "2025-07-25",
"Confidence": 0.65,
"Size": 1,
"Entry Timing": "Open"
}
⸻
🔬 Sentiment Breakdown
Indicator Signal
📈 Daily RSI ✅ Bullish – confirms entry
📉 Weekly RSI ⚠️ Flat – no long-term edge
🔊 Volume ❌ Weak – no institutional bid
🔁 Options Flow ✅ Bullish (C/P = 1.24)
💨 VIX ✅ Favorable for upside trades
⏳ Gamma Decay ⚠️ High risk (3DTE)
⸻
📍 Chart Focus
• Support Zone: $328–$330
• Breakout Watch: $335+
• Target Zone: $340–$345
• ⚠️ Risk Watch: Volume divergence + gamma decay on low move
⸻
📢 Viral Caption / Hook (for TradingView, X, Discord):
“ NASDAQ:TSLA bulls flash 335C with confidence, but volume’s asleep. RSI’s in, gamma’s ticking. 3DTE lotto with caution tape.” 💥📉
💵 Entry: $9.90 | 🎯 Target: $15.00+ | 📉 Stop: $6.00 | ⚖️ Confidence: 65%
⸻
⚠️ Who This Trade Is For:
• 🔁 Options traders chasing short-term call flows
• 📈 Momentum scalpers riding RSI pop
• 🧠 Disciplined risk managers eyeing 3DTE setups
⸻
💬 Want a safer bull call spread (e.g., 330/340) or risk-defined iron fly for theta control?
Just ask — I’ll build and optimize it for you.
TESLA 400 BY END OF YEAR !! 5 REASONS !!!
1. **Strong Earnings and Revenue Growth**
Tesla has a track record of exceeding earnings expectations. If the company reports robust financial results in Q3 and Q4—driven by higher vehicle deliveries and growth in its energy storage business—investors are likely to gain confidence. This could push the stock price upward as Tesla demonstrates its ability to scale profitably.
2. **Advancements in Autonomous Driving**
Tesla’s Full Self-Driving (FSD) technology is a game-changer in the making. If Tesla achieves significant progress toward Level 4 or 5 autonomy—where vehicles can operate with little to no human intervention—it could position the company as a leader in transportation innovation. Such a breakthrough would likely excite investors and drive the stock price higher.
3. **Battery Technology Innovation**
Tesla is working on developing cheaper, longer-lasting batteries, which could lower production costs and improve profit margins. If the company announces advancements in battery tech—such as improvements from its Battery Day initiatives or new manufacturing processes—it could signal a competitive edge, boosting the stock to $400.
4. **Global Expansion and Production Increases**
Tesla’s new Gigafactories in Texas and Berlin are ramping up production, while potential market entries like India loom on the horizon. Increased output and access to new customers signal strong growth potential. If Tesla successfully scales its operations, investors may see this as a reason to push the stock price toward $400.
5. **Favorable Market Trends and Government Policies**
The global shift toward sustainable energy and electric vehicles (EVs) is accelerating, supported by government incentives and regulations favoring clean energy. If EV adoption continues to rise and policies provide a tailwind—such as subsidies or stricter emissions standards—Tesla, as an EV leader, could see increased demand and a higher stock valuation.
While reaching $400 by year-end is ambitious, Tesla’s strong brand, innovative edge, and leadership under Elon Musk could make it achievable. That said, risks like market volatility and growing competition from other EV makers could pose challenges. If these five factors align, however, Tesla’s stock has a solid shot at hitting that target.

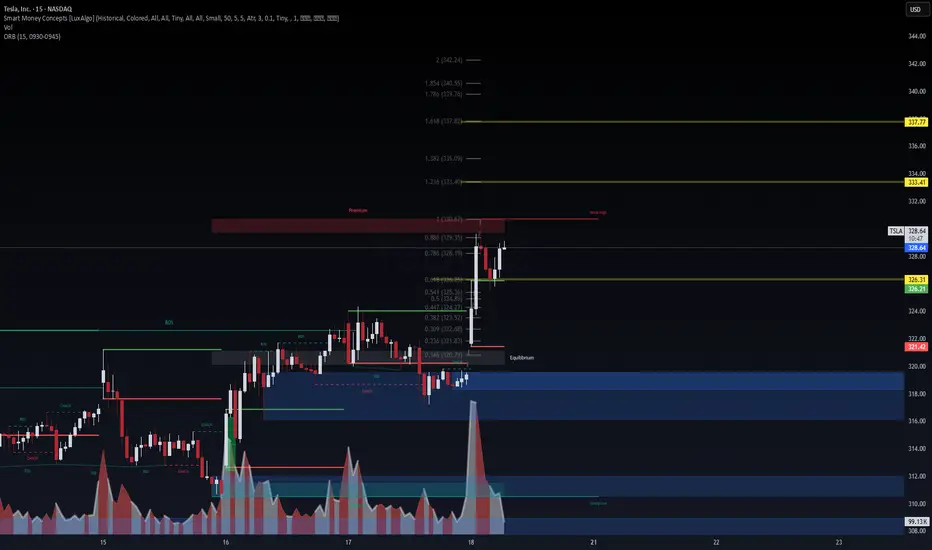
$TSLA Fibonacci Expansion Targets in Play – VolanX Precision Le🔋 NASDAQ:TSLA Fibonacci Expansion Targets in Play – VolanX Precision Levels
TSLA just powered through a clean bullish reversal from the discount zone and now trades inside the premium supply block near 330.67. This zone aligns with:
📍 0.886 Fib (329.35)
📍 Weak high at prior inefficiency
📍 VolanX ORB resistance (326.21–330.67)
🧠 WaverVanir VolanX Setup:
✅ CHoCH → BOS → Premium Tap
✅ ORB (15) broken to upside with volume (76.6K)
🟡 Currently testing equilibrium/premium confluence
🎯 Fibonacci Expansion Targets:
1.236 → 333.40
1.382 → 335.09
1.618 → 337.77
2.0+ range → 342–347 (if melt-up continues)
⚠️ Trade Logic:
A pullback to 326.30 may serve as a re-entry zone.
Watch for rejection at 330.67 — if it fails, bulls could reclaim control into the 333–337 fib cluster.
Macro + flows suggest continuation, but premium rejection remains possible. Stay nimble.
📌 #TSLA #Tesla #WaverVanir #VolanXProtocol #SmartMoneyConcepts #ORB #Fibonacci #LiquidityZones #BreakoutSetup #TradingView #OptionsFlow #Scalping #MacroMomentum
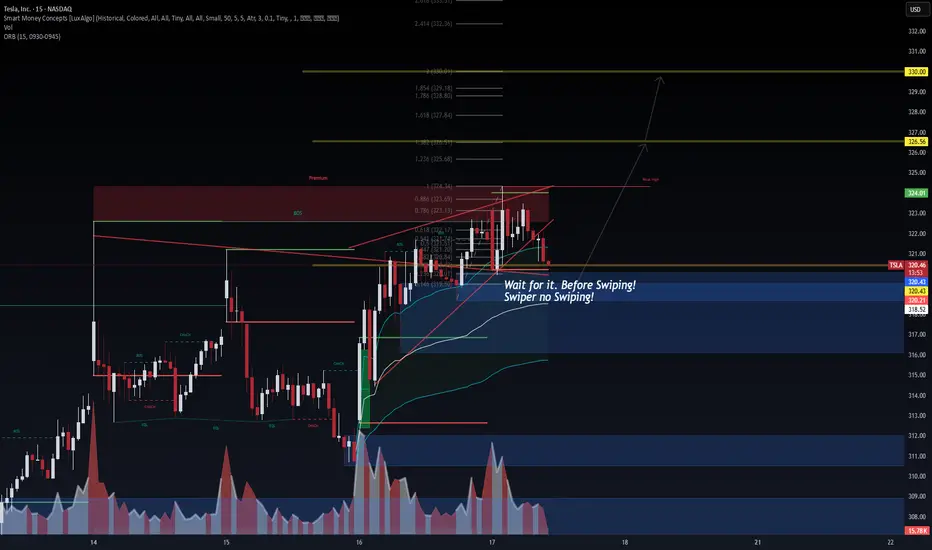
TSLA: Time for the 2/3 rally?TSLA remains tightly wedged inside a bullish pennant, hovering just above the ORB high (324.01) and within the premium SMC zone. Smart Money structure is clear:
🔹 Bullish BOS + CHoCH stacking
🔹 Fibonacci confluence from 0.618 to 0.886 holding strong
🔹 Hidden demand resting at 320.21 / 318.66 zone
🧠 VolanX DSS Logic:
Break above 324.34 unlocks liquidity toward 1.236 = 325.68, then key magnet zone 326.56
Liquidity sweep + micro pullback ideal entry signal
Volume shows absorption at each higher low → bullish intent
🎯 Trade Plan (15m):
Entry: 322.00–324.00 with confirmation
Target: 326.56 → 328.18
Invalidation: Below 320.21 BOS flip
ORB + Fib + SMC stack = High-conviction directional play
💬 Price may seek inefficiencies left in prior imbalance zones below, but current order flow favors upside continuation.
📢 This analysis is powered by the VolanX Protocol under WaverVanir DSS — where liquidity meets logic.
#TSLA #WaverVanir #VolanX #SMC #DayTrading #Fibonacci #ORB #SmartMoneyConcepts #Tesla #MacroEdge #OptionsFlow
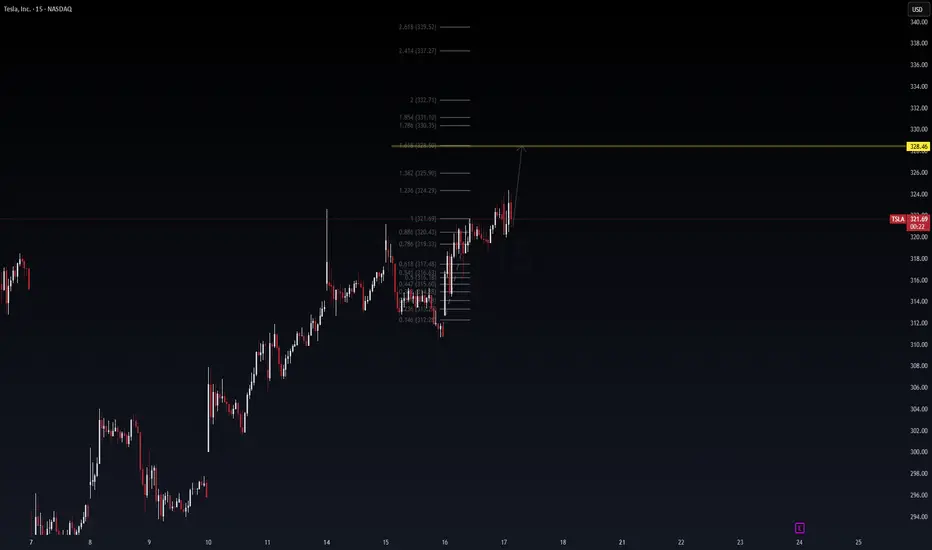
TSLA Fibonacci Launchpad: 328.46 in Sight? (15-min Daytrade Setu🔋 TSLA Fibonacci Launchpad: 328.46 in Sight? (15-min Daytrade Setup)
Posted by WaverVanir_International_LLC | Powered by VolanX Protocol
TSLA continues to show bullish continuation structure on the 15-min timeframe. After a textbook retracement to the golden pocket (0.618–0.786), bulls defended $315-$317 zone and reclaimed $321 resistance.
📌 Technical Thesis
Clean impulsive wave from $312.24 → $321.69
Consolidation → Breakout structure with low selling volume
Fib extension targets 1.618 at $328.46, followed by confluence zones at $331 and $332.71
Price respecting higher lows, forming micro bull flag
📈 Entry Idea:
Intraday breakout confirmation above $324.29 (1.236 extension)
Risk-managed long setup with stops below $320.43 (0.886)
Target zones: $328.46 → $330.35 → $332.71
⚠️ Risk Note:
Heavy resistance expected around $328–$332 zone. Scalp profits near extensions or trail stops tight.
🔮 VolanX Signal Score: 7.5/10
Favoring upside continuation unless macro catalyst shocks sentiment.
#TSLA #DayTrading #Fibonacci #Scalping #VolanX #WaverVanir #TechStocks #OptionsFlow #AITrading #PriceTargets #TeslaTraders
TSLA: DT 7/16/2025Took a trade at the fair value gap 15 min TF, If the market is going to reverse it is either going to be from .50 or .382.

Is the BullRun over? I don't think so. $TSLAYesterday we saw a somewhat heavy fall in Indexes, and it probably scared alot of retail Bulls outs.
However, it seems we've fallen straight into potential medium term supports across multiple stocks in the markets.
I'm convinced we will get a good economic data print today.
This would open the door to new ATHs, again, in the Indexes.
For this to play out, the local bottoms established over night need to hold.
Stocks SPOT ACCOUNT: TESLA stocks buy trade with take profitStocks SPOT ACCOUNT: MARKETSCOM:TESLA stocks my buy trade with take profit.
Buy Stocks at 297 and Take Profit at 319.
This is my SPOT Accounts for Stocks Portfolio.
Trade shows my Buying and Take Profit Level.
Spot account doesn't need SL because its stocks buying account.

Tesla’s Next Move: Bullish Play Amid AI and Volatility Current Price: $313.51
Direction: LONG
Targets:
- T1 = $319.00
- T2 = $329.15
Stop Levels:
- S1 = $307.75
- S2 = $303.60
**Wisdom of Professional Traders:**
This analysis synthesizes insights from thousands of professional traders and market experts, leveraging collective intelligence to identify high-probability trade setups. The wisdom of crowds principle suggests that aggregated market perspectives from experienced professionals often outperform individual forecasts, reducing cognitive biases and highlighting consensus opportunities in Tesla.
**Key Insights:**
Tesla’s recent AI innovation and its expanding robo-taxi footprint signal long-term growth potential while short-term volatility requires strategic entry points. Market sentiment has significantly improved with positive news about the integration of Gro 4 AI, enhancing Tesla’s autonomous vehicle advancements. Trading at critical levels, Tesla offers a potential buying opportunity near key support zones.
The rallying investor focus on Tesla’s technological edge places it among the leaders in automation-driven growth. Despite macroeconomic pressures, Tesla’s proactive efforts in leveraging cost efficiencies and scaling autonomous solutions are helping to sustain bullish momentum.
**Recent Performance:**
Tesla demonstrated notable resilience during a turbulent earnings season, holding strong amidst mixed market signals. Recent delivery figures reflected a 13% year-over-year decline, which stirred concerns. Yet, the stock was buoyed by positive AI-related news and the market-wide optimism surrounding automation technologies, enabling Tesla to maintain its pivotal price range.
**Expert Analysis:**
Analysts acknowledge Tesla’s robust innovation pipeline centered around driver assistance and robo-taxi functionality powered by the Gro 4 AI platform. Concerns related to Elon Musk’s focus and governance have tempered enthusiasm for some traders, but these have largely been offset by Tesla’s strategic actions to sustain revenue and growth. Tesla’s prominent role in setting the market narrative for autonomous vehicles and broader EV adoption ensures ongoing support from long-term investors.
Tesla’s recent moves are growing investor confidence as it seeks to hedge against broader economic uncertainties and mitigate risks around regulatory changes. Its expansion strategy continues to highlight its leadership within the EV space, while early adopters of its AI-driven solutions may set the pace for sustainable revenue expansion.
**News Impact:**
The integration of Gro 4 AI is expected to significantly enhance Tesla’s robo-taxi and autonomous vehicle functionality, enabling it to capture market share in urban mobility services. Tesla’s announcement of an expanded robo-taxi fleet targeting key metropolitan areas could help offset delivery declines and drive future recurring revenues. While concerns about Elon Musk’s governance persist, ongoing innovation continues to support Tesla’s bullish outlook in global EV markets.
**Trading Recommendation:**
Tesla’s current price action signals an advantageous entry point for a long position, reinforced by recent bullish news and industry-leading innovations. Short-term traders can target $319.00 and $329.15 while maintaining disciplined stop-loss levels at $307.75 and $303.60. With strong support from institutional sentiment and expanding AI applications in its product line, Tesla offers substantial upside for bullish investors.
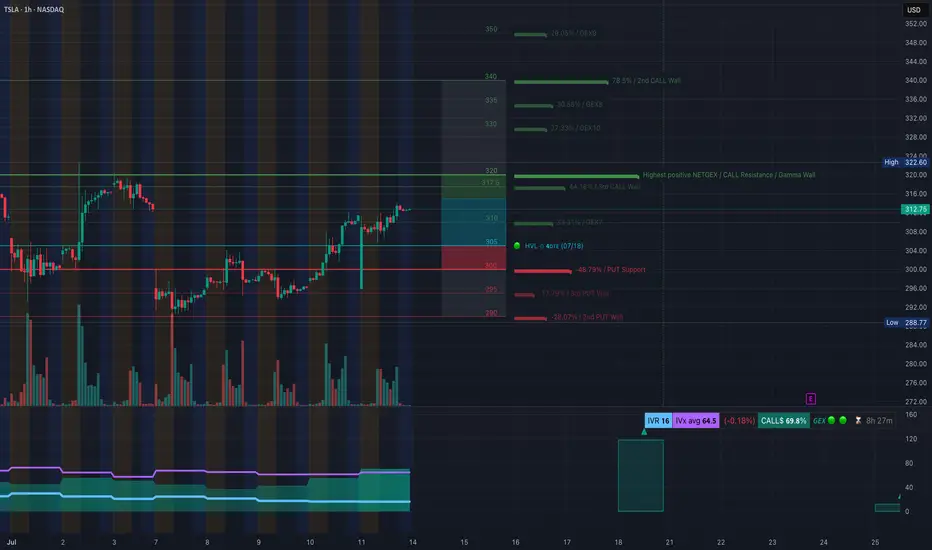
TSLA TA – Call Side Dominance Nearing Resistance-July 14TSLA GEX Analysis – “Call Side Dominance Nearing Critical Resistance 💥”
GEX Snapshot:
* Highest Positive GEX / Resistance: $320 – This is where call positioning is heaviest and likely where dealer hedging could resist further upside.
* Call Walls:
* $317.5 (44.18%)
* $320 (High NetGEX)
* $335–$340 (Intermediate resistance, weaker positioning beyond)
* Put Walls:
* $300 (48.79% support)
* $295 / $290 (3rd/2nd tier walls)
Options Oscillator:
* IV Rank (IVR): 16 (Low)
* IVx avg: 64.5
* Call Positioning: 69.8% (very bullish skew)
* GEX: 🔰 Bullish
🎯 Options Trade Setup:
Direction: Cautiously Bullish – but close to key resistance!
⚡ Aggressive Bullish Setup:
* Entry: Near $312.75 (current price)
* Strike: Buy $317.5C or $320C expiring this week
* Target: $320+
* Stop: Close below $308
* Note: Watch dealer hedging around $320. If TSLA breaks $320 with strength, gamma squeeze toward $335 is possible.
🛡️ Bearish Reversal Setup (if rejected at $320):
* Strike: Buy $310P or $305P (next week expiry)
* Trigger: Rejection at $320 + breakdown below $311
* Target: $304–$300
* Stop: Above $321
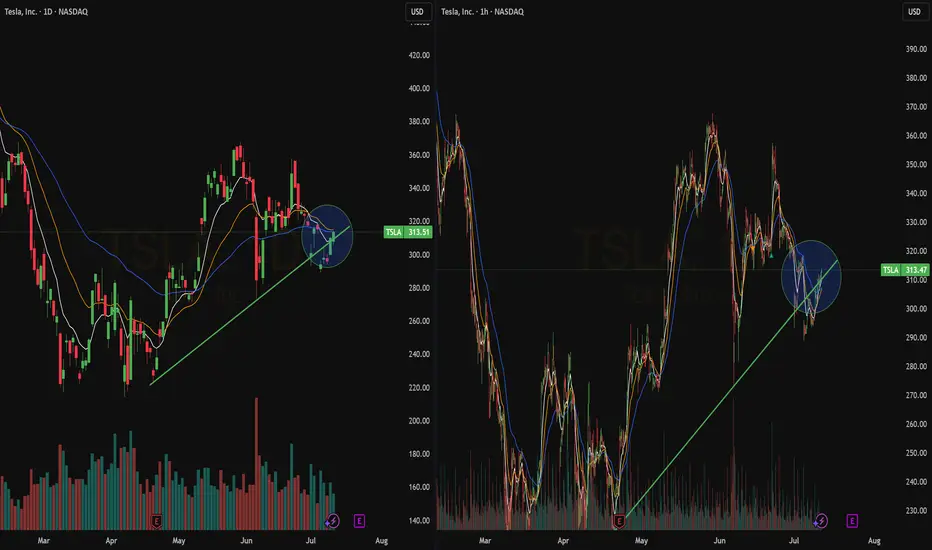
📉 TSLA 1-Hour Chart Analysis – “Breakout Zone or Fakeout Trap? Watch These Levels 🎯”
Structure:
* TSLA broke above the CHoCH and BOS zones between $308–$310. Price is consolidating under the $317.5–$320 resistance (also seen on GEX).
* There’s a clean ascending wedge/channel forming – upper boundary is near $320, and the lower trendline is near $304.
Key Zones:
* Supply Zone (Purple): $317.5–$320 (watch for rejection or breakout)
* Support: $309.8 (BOS zone), then $304 (trendline + demand overlap)
* Demand Zone: $293.5–$296 (origin of last rally)
🛠️ Trade Scenarios:
🔼 Bullish Continuation:
* Entry: Break and hold above $320
* TP1: $325
* TP2: $335
* SL: Below $311
🔽 Bearish Pullback:
* Entry: Rejection at $317.5–$320 zone and break below $309
* TP1: $304
* TP2: $296
* SL: Above $320
✅ Summary:
* GEX favors calls but $320 is a critical gamma wall – if broken, it opens room toward $335+.
* On the chart, watch the rising channel and upper resistance at $320.
* Bullish momentum is still intact unless $309 fails.
* Stay nimble: scalp calls on breakout, or prepare for a reversal put if there's rejection and structure break.
Disclaimer: This analysis is for educational purposes only and not financial advice. Trade at your own risk with proper risk management.
TSLA / Earning seasonNASDAQ:TSLA showing nice price action bounce off the base last week. With earnings season here, watch the $315 level — a breakout could send it toward $320 and $326 next 🚀📈 #TSLA

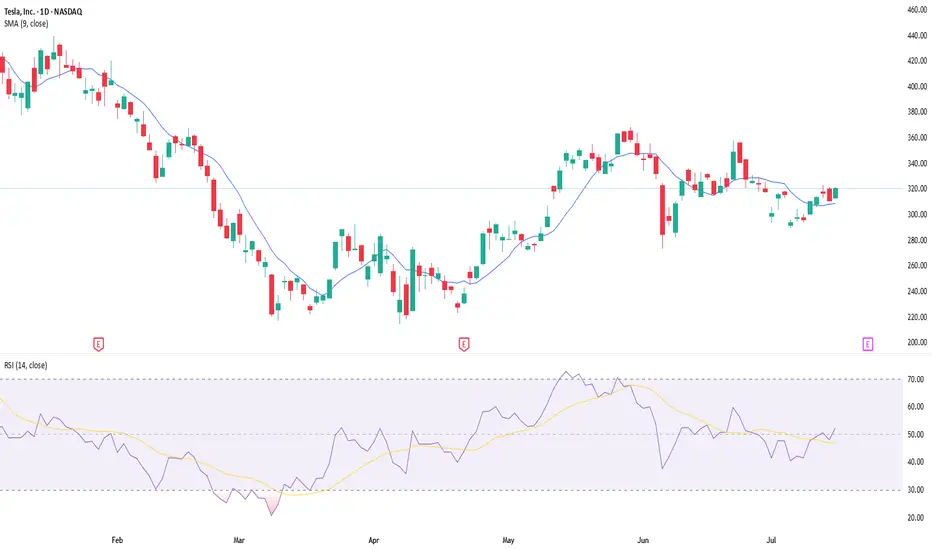
Tesla could make a move here... (July 13, 2025)Tesla's 2 Day chart looks bullish here with the RSI, let's talk about it!

Quick Update : TSLABullish Crossover on the hourly chart at the bottom of the channel.
The action of the last hours is weak as can be seen by the lack f volume.
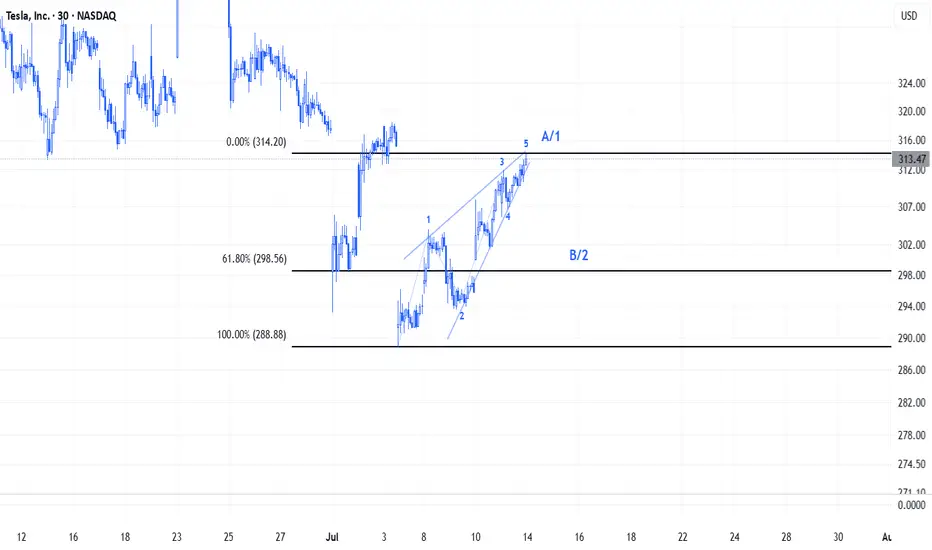
TSLA Elliott Waves We can clearly see that a Leading Diagonal is formed on TSLA's chart.Leading Diagonal usually occurs on Wave A or Wave 1.After this chart pattern, a correction often follows reaching nearly the 61,2% fib levels of the Diagonal
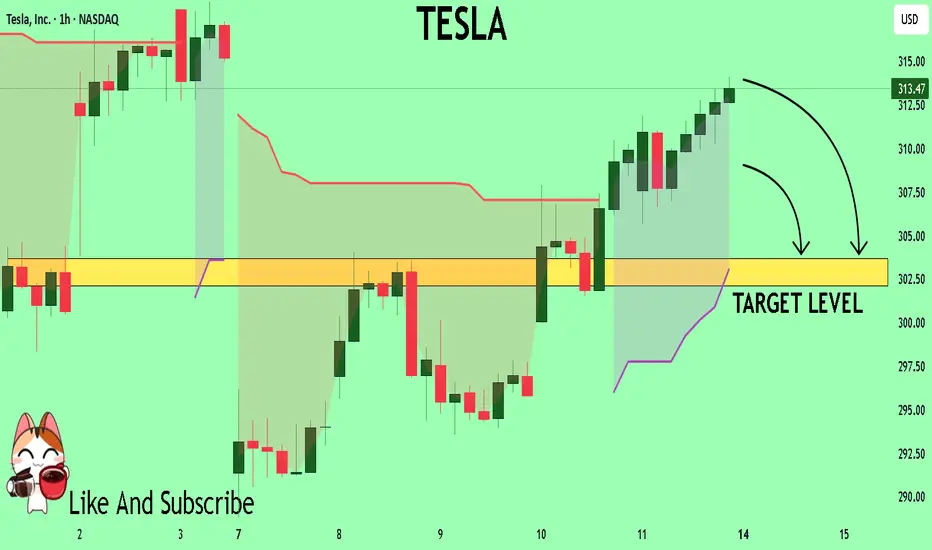
TESLA My Opinion! SELL!
My dear friends,
Please, find my technical outlook for TESLA below:
The price is coiling around a solid key level - 313.47
Bias - Bearish
Technical Indicators: Pivot Points Low anticipates a potential price reversal.
Super trend shows a clear sell, giving a perfect indicators' convergence.
Goal - 303.67
About Used Indicators:
The pivot point itself is simply the average of the high, low and closing prices from the previous trading day.
Disclosure: I am part of Trade Nation's Influencer program and receive a monthly fee for using their TradingView charts in my analysis.
———————————
WISH YOU ALL LUCK