V divergenceV has been looking to make a trend reversal and it seems the market hiccup September 20 was the catalyst
- V is confirmed to be in a bullish divergence
+ the chart shows two recent lower low's
+ slow stochastic shows higher lows
+ five EMA crossed 200 EMA
- Fibonacci retracement shows price target at $238.68
+ prior resistance is $238.10
V is on a strong up. There are a few resistance levels along the way to collect profits and get better entries.
** for some reason my trend line on my Stochastic Slow did not show but if you look you can see the higher low's
4V trade ideas

$V weekly updatedLooking for $237 next week to close remaining positions. Other calls were at +102% : )

V Buy ideaVisa currently on the bottom line of the downtrend (white lines) and wicked on the 50 weekly MA on september 17th. Depending on market sentiment, we may have found V bottom. I keep V on watch for a long term buy with earnings coming end of October. V is currently undervalued based on my personal DCF. Full reversal over 228 !

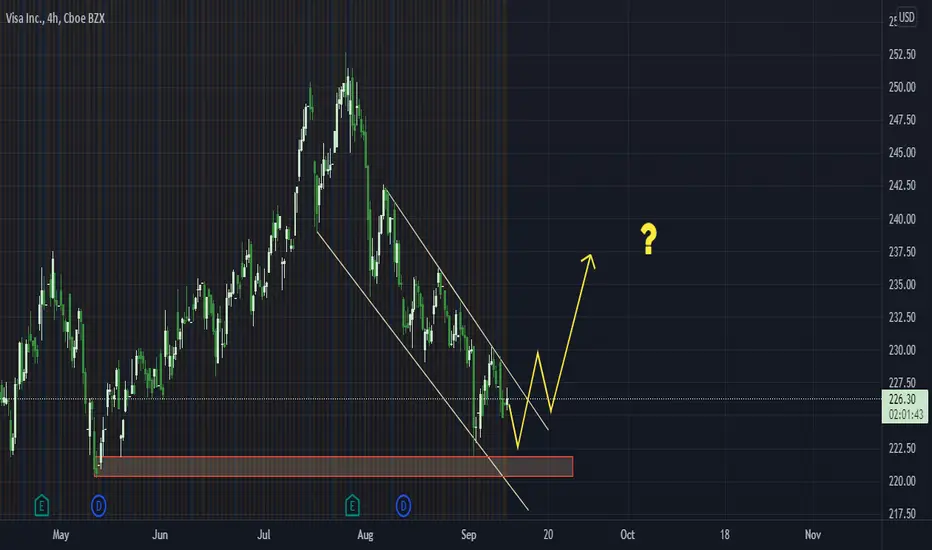
1H - Double BottomVisa is due for a reversal, this might be it. On the hourly chart there is a very loosely identified double bottom. The second bottom is slightly lower than the first, this isn't ideal but it might not matter. I'm watching for a breakthrough of the critical resistance noted on the chart.

strategy for V friday 09/17/2021(V buy price 226.00)
(V sell price 224.00)
This is the trade of the day in case anyone has any questions about my strategy only price and volume. This price that I use are the institutional prices, it is where the market or the stock has to move. simple, but not easy

Visa [LONG]Looks like a good initial entry on Visa - still potential move to downside but at a long term risk to reward i'm comfortable with.
Positive divergence on RSI along with key fib levels and weekly EMA support.
** NOT INVESTMENT ADVICE **

Visa Bull FlagMentioned Visa a few days back. I think this looks like it is setting up to move higher. Visa: LONG.

Visa Not Looking So HotMore on this later, but the chart indicates weakness. That said, I am not sure what to make of the bear wedge just yet. Does this lead the entire market lower? Do we go sideways for a little while and then take off higher?
For now, really interested in the price action at $214 and will continue to monitor.

Short on visa INC. in D1Take visa INC. in the correction and place the SL above the previous high
to close signal wait for ichimoku signal ( 5 tenkan sen cut 26 kijun sen ) in H4

Visa: Potential reversal5th wave downward should have finish theoretically. Expecting the support to hold and send the price upward.
V looks to put money in your walletV just came out of an double top trend and it looks to have a strong reversal
- In the past, V has respected the midline of the pitchfork as a resistance level
+ Fibonacci extension have resistance level at 245.28
+ According to pitchfork that would be around October 8
- V tends to respect the 4.618 fibonacci line
+ It bounced off it perfectly as a support level
+ At that same point V bounced off the 200 EMA - that indicates low risk high reward
- Using a fast moving MACD (5,35,5), the MACD line just crossed the signal line
+ The RSI is bouncing from 31.57 - the last time the RSI was that low was January 27, and afterwards was a pretty strong trend
5 hours ago
Comment: If V falls then its support level is

$V Analysis & Key Levels - REQUEST - I hold no position$V Analysis & Key Levels - REQUEST
Ok, Radu5, so $V does not typically stay under the 180 EMA (Purple) for too long. The average is around 10 days. (22 days if you count the crash of 2020 in March.)
And so far it looks like the 180 EMA is trying to be support but I think it will break under just looking at the MacD . The MacD is under zero and as long as it’s under zero it’s in the bear zone. Again… it doesn’t seem to stay there very long.
SO… if you’re going to add to your position, do it at the support levels only (Green lines and numbers)
Once you’re back above the 180 EMA and the 35 EMA you’ll be back where you want to be. Once it’s above the 35 EMA you’ll be above the 0 on the macD and then just hold for as long as the MacD stays above 0.
I don’t know what indicators you use but if you just add 35 EMA , 180 EMA and a MacD that should be enough to let you know where to enter and where to exit a trade.
I hope this helps.
—————
I am not your financial advisor, but I will happily answer questions and analyze to the best of my ability but ultimately the risk is on you.
Red = Resistance
Green = Support
Blue = trendlines
Have fun, y’all!!

V: Triple BounceVisa has been bouncing clearly on ema 200 and also on bull trend line, 3 times! Very clean and Rebound. Bounced off a major support level at $220 beautifully. Visa has been trading at a very rich valuation, over 40x earnings and 20x sales. Its been selling off recently, down about 10% from all time highs. MACD is bouncing to positive and there is a V bounce at RSI.
Revenue growth has been strong despite the pandemic and the company continues to make acquisitions to lead the fintech sector.

V looks prime for callsV just came out of an double top trend and it looks to have a strong reversal
- In the past, V has respected the midline of the pitchfork as a resistance level
+ Fibonacci extension have resistance level at 245.28
+ According to pitchfork that would be around October 8
- V tends to respect the 4.618 fibonacci line
+ It bounced off it perfectly as a support level
+ At that same point V bounced off the 200 EMA - that indicates low risk high reward
- Using a fast moving MACD (5,35,5), the MACD line just crossed the signal line
+ The RSI is bouncing from 31.57 - the last time the RSI was that low was January 27, and afterwards was a pretty strong trend

Visa Bullish AFNotice the tight bullish channel that Visa trades between, look for $226 this to bounce off of support.

Time to VISA (V)In early august, Visa crossed the EMA 200 and began a dangerous descending situation. In September 2nd, the stock dropped near support ($221) but it didn't cross the line, good news for all investors. Now the stock has confirmed the ascending trend raising up from the support. I'm in at $227.5.
Special atention the next days, when it can cross up the EMA 200 and try to raise a new max.
What do you think about this Stock?
Thank you!
Cheers and nice trade!

$V LONG #VISACheck out 3 green points on chart ...
rsi and 200ma support
the previous like before story
DISCLAIMER

Visa**V** - Visa
You know we had that massive move downward on Visa last week, so we may have it reverse and retrace here on that candle to the upside. Always keep alerts on both trigger just in case.
Calls above $227.30
Below below $223.35
$SPY, $V #PRESSIT

$V Sellers ExhaustionThis week bulls need to defend the AVWAP level at 222.47
Sellers may be exhausted here and a reversal is implied looking at historic similar volume and price action. However, break below could see 215/210 zone as next level of strong support. Would be backing up the truck and loading longs if we get a chance that low.

Long Visa - a pullback created a buying opportunityHealthy pullbacks in companies like Visa are fairly hard to come by. Wave trend points toward oversold. 200sma nearby for support, but historically cant always hold up so I've adjusted my stop accordingly. This is a long term idea for me, maybe selling 40 percent at the target and letting the rest ride. Not financial advice


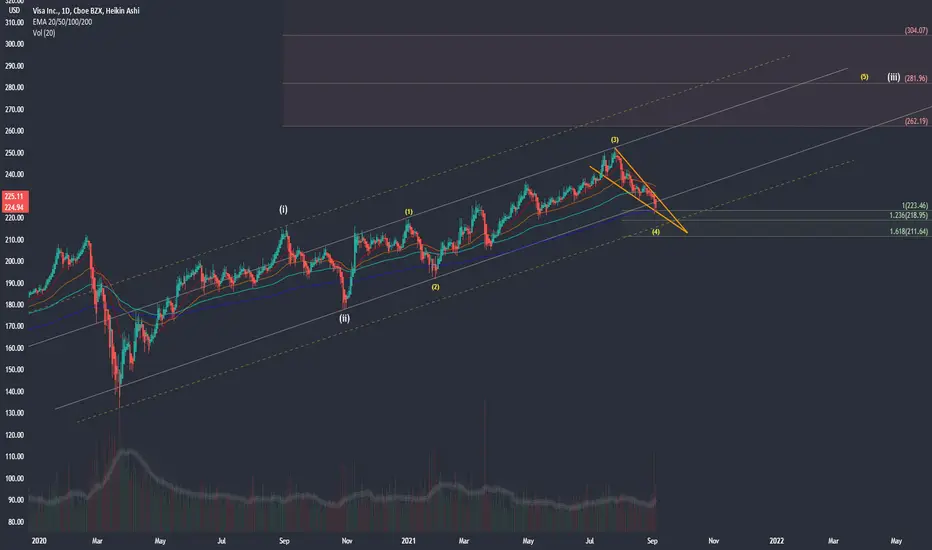
VISA - WAITING FOR BUY SIGNAL#VISA gave us a nice pullback here in minor wave 4 and now I am waiting for the buy signal for completion of minor wave 5 and major wave 3. We can see in the chart that we typically get a small bounce off the 200 EMA but in the past, they have pulled this below 200 EMA only to jerk it back up. Green box is my buyzone inside this falling wedge. Awaiting buy signal using volume candles and fib levels provided.