4V trade ideas

Anti-competitive allegation (boo) - $235+ target 2021 (yay)What a juicy entry into Visa.
I have worked closely with Visa, and these are some of the big points I think will work in their favour:
> Right where the stock was before the pandemic crash in March 2020. What?
> Olympic year -- Olympic years are good years for VISA as a TOP partner of the International Olympic Committee. Sure, we are a bit worried about how will the Olympics really look this year -- things seem a bit messy in Japan, but, if Japan can somehow get it together with the vaccines and protocol in time for the Games allowing some tourists in, this could be a good year with definitely stronger anticipated earnings for Sept/Oct earnings call.
> Travel and spend -- VISA's main revenue source isn't your domestic spend. Sure, the pandemic has perhaps even surprised VISA, as they reported positive earnings with online transactions and local spend -- but once those boarders open, the spend during international travel is where the bulk of the revenue will emerge from. I feel (and I could be wrong as who knows how safe management wants to play it) -- VISA will have fairly positive guidance during the May earnings report, which will be a big catalyst for the stock to jump and set all-time-high. If not then, I would still hold a position for 2021, because as things get better and people travel, they carry Visa in their pocket.
> Cryptos 'r' us + Dividend -- Few months ago VISA announced a Bitcoin based loyalty points program as a new product in select markets. VISA doesn't go "all in", but that's why I like VISA as a less risky yet growth-like stock. It can make strong moves upward, but, also keeps paying a tasty dividend.
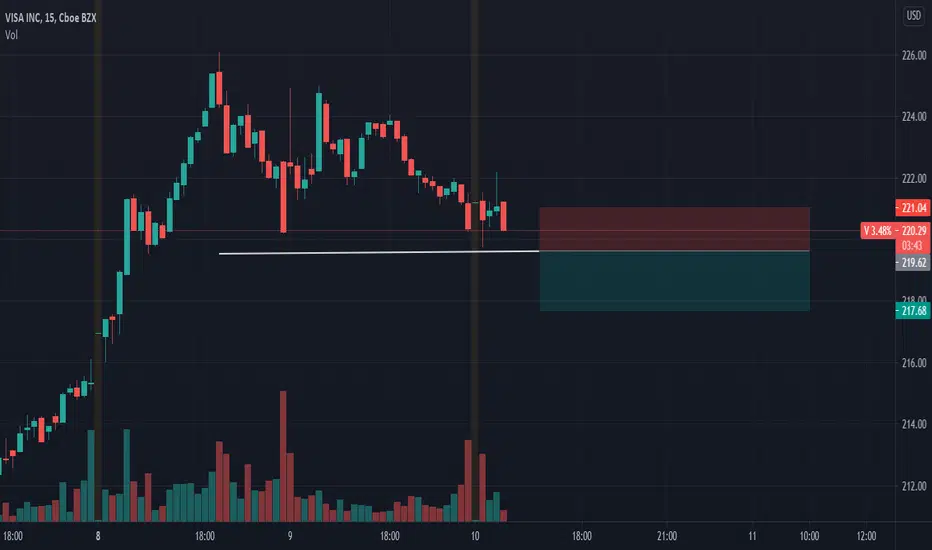
I had de-risked by taking profits on VISA a few weeks ago. I did miss most of the rally we saw last week, but profit is profit and they still paid me the dividend. I have been looking for a re-entry when I felt the stock cools and a pattern becomes more obvious.
BUT WAIT...
While this dip is super tempting, I am not going all in just yet. VISA dropped so sharp on allegations of anticompetitive practices, as the department of justice investigates claims that VISA channeled transactions over their own (more expensive) networks for retailers, rather than giving them options to transfer through other networks (which is their legal right and possibly cheaper). What this means is that investors don't like the shock, and decided to take profits. What I will watch for is how the narrative develops over the coming week. If the market is generally recovering and the VISA news has no major follow up, great. If there is more news, we could even get down to $190s. I don't expect the stock to break that support.
Good luck traders!


V - Price target $250V - the breakout attempt failed. Could bounce off from the lower trend line.
Best case - $250
Bad case - $192
Worst case - $181
———————————————————
How to read my charts?
- Matching color trend lines shows the pattern. Sometimes a chart can have multiple patterns. Each pattern will have matching color trend lines.
- The yellow horizontal lines shows support and resistance areas.
- Fib lines also shows support and resistance areas.
- The dotted white lines shows price projection for breakout or breakdown target.
Disclaimer: Do your own DD. Not an investment advice.


Big wedge on $VVisa has been forming a big wedge since the COVID crash back in March 2020. I'm expecting this to break up, but it can go either way. This is something to keep an eye on as a break would likely be fueled by news and would be massive.

Found Support?Looking for a long play here after the sell off. 209-210 area has been previous support/resistance in the previous month.


Is Visa About to ‘Charge’ Higher?Visa broke out to new highs last week. Now it’s pulling back and trying to make a higher low.
The first bullish signal was on February 24, when the 21-day exponential moving average (EMA) rose above the 50-day simple moving average (SMA). That’s a sign of intermediate momentum turning more bullish.
Next, consider the $220 level. It was resistance at the end of 2020 and late last month. Now the credit-card company is trying to turn it into support.
Taking a longer-term view at the weekly chart, we see a consolidation pattern between $180 and $220 that started last May as the market rebounded from the Covid crash. It’s interesting that V remained pretty much trapped below old highs during that period, even as other stocks broke out. That’s especially true of the broader Technology bucket.
But this year , the shoe’s on the other foot. Big tech names like Apple are drifting as V breaks out. A quick scan on TradeStation showed that only one-fifth of XLK’s members have made new 52-week highs in the last two weeks. V is one of them -- along with Intel, Cisco Systems and Corning.
This isn’t a surprise because V is more geared toward a cyclical recovery in the economy than many other tech stocks. Again, technical analysis is miles ahead of the fundamentals.
TradeStation is a pioneer in the trading industry, providing access to stocks, options, futures and cryptocurrencies. See our Overview for more.


VISA INC 4 HOUR- BUY
- PRICE CLOSED BEARISH ABOVE 8 & 14 MOVING AVERAGE GIVING US AN UPWARD BIAS
- BEARISH PIN BAR ALSO CONFIRMS THAT BUYERS WERE STEPPING IN BEFORE MARKET CLOSE CONFIRMING THAT PRICE IS ON A PULLBACK


Interesting divergence in Visa Visa printing a rising wedge on the monthly chart. Divergence is interesting as the RSI is tracking lower with the stock moving higher.
Interesting and would welcome others thought?
My thought would be that with reopening a break above the wedge would signal a long entry, but the divergence x rising wedge worries me. Is this a sign for the wider market also?

VISA. Ascending Triangle on Weekly. 3:1 RRR.NYSE:V is breaking a year long ascending triangle on the weekly time scale. Measuring by the height of the triangle, about $80, from the top of the triangle gives us a target of $296. This is 35% potential profit from the current price of $219.
Taking the recent swing low as a guide, we can set our stop loss at $189.
The triangle is not considered broken upwards until we see next week's candle trading above current week's candle, given that this week's close is above the triangle.
Unfortunately I can't give a time window for this move.
From a fundamental point of view, I suspect that Visa benefits from the Fed's increased interest rates. But I would need more research to understand precisely the magnitude of such effect.

V, likes making those v'sTried playing back in late DEC. Wasn't ready yet, looking good now...but hasn't been easy.


V could breakout of year-long consolidation soon. Visa may be ready to break resistance around this price which it has stayed under since feb 2020. It may be ready to continue higher. Not financial advice. DYOR.

V/Visa is great!!!!The stock price has been in a huge ascending triangle for a long time, like TSLA/Tesla.
If the price can resist for few days over the resistance, it will be a great point to enter and make great amount of profit.

