VISA - V - Elliott wave analysis - sell set upV - VISA - It is within double zigzag down cycle. It has completed W and X wave and Y is in ABC zigzag. wave A down was completed and B wave is in progress. Sell when B wave completed near 203 zone with stops above 208 level for target below 190.
Give thumbs up if you really like the trade idea
4V trade ideas


V - VISA - Elliottwave analysis Welcome guys,
CycleWave is the top author sharing trade ideas based on EW analysis since last five months on the global stocks, currency pairs, cryptos, future indices and commodities. You can follow us to get more trade ideas/analysis.
V - It has completed (X) wave in zigzag ABC. The down move was impulse A wave and expecting B wave correctio, which might be choppy. Thereafter C wave down will start moving down to complete the (Y) wave.
Give thumbs up if you really like the trade idea.

$V reversal bounce on middle line of trend channel$V reversal bounce on middle line of trend channel and RSI 40 touched on 2H timeframe
Buy: $199.55
Target: $203.77 (+2.07%)

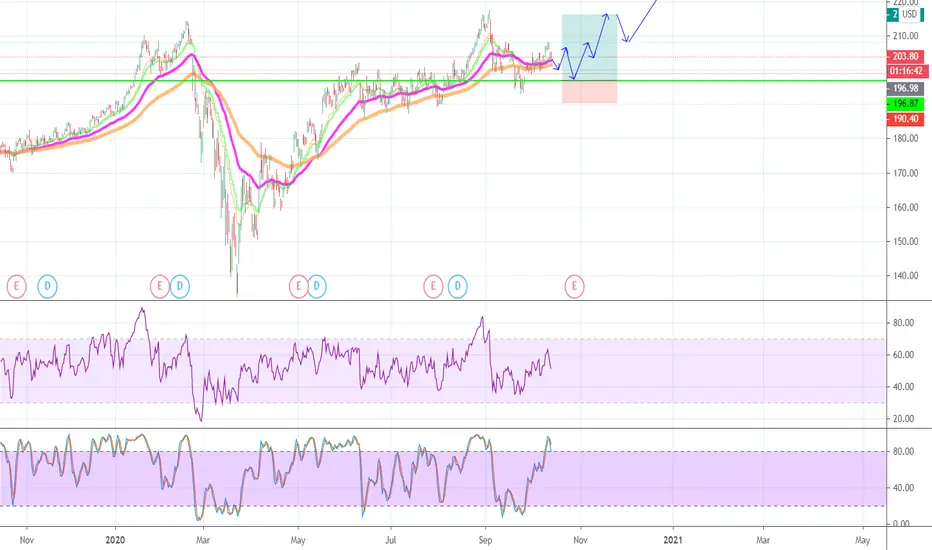
V - Entry ahead?Short update on Visa! NYSE:V
In the last days we might have formed a solid Wave 1-2.
Right now i am watching the market carefully to place a long entry, stay tuned!
===================================================================================================================
If you have questions related to a specific stock or the Elliot Wave theory, feel free to contact me.

V - What's going to happen?Hello and good morning dear Visa Investors! NYSE:V
For the first time i will publish a detailed analysis on one of the biggest Dow30 Companies... Visa!
Visa saw very strong growth since the market crash in march, along with all other tech companies it easily surpassed its previous ATH.
I could successfully identify the past price movements and elliot wave structures.
Right now i am looking for a solid 1-2 structure and the start of Wave3 !
I will announce an entry if both confirmations are given!
===================================================================================================================
If you have questions related to a specific stock or the Elliot Wave theory, feel free to contact me.

nice company/chart requestwe have made money on it before :) id wait for a top trendline break then enter some calls! earnings seasons coming ? ;)

Visa path and directionHello everyone
This is my VISA idea for Daily time frame
watch key notes for more detail on chart
for any question feel free to ask :) good luck

visa harmonicwe are looking at a bearish harmonic on the watch for a short.
trade at your own risk...

Watching for a breakout or breakdownAscending triangles formation.
Looking to see a breakout or breakdown.


V 10062020 daily trade idea Visa has been in range during the last week, but the points of this range are weaks in boths sides of the auction, eventhough, today´s session is showing us an opening above range so if we get acceptance above 203,27 we can look to repair 10012020 poor high at 205,2

VISA INC INTRADAY TRADE IDEA M15TARGET FOR VISA INC IS 204.66
OPEN POSITION FOR LONG
PUT - TP IN 204.50
PUT - SL IN 203.11
--- HAVE A GOOD TRADES ---

$V Visa Joins the Fintech Rally
VISA has reclaimed the 50ma as support after a sharp decline with the market in September.
As earnings approach we expect a run up into the event as VISA continues to benefit from the
surge in ecommerce due to Covid.
MACD has just completed a bullish crossover
Histogram is positive
RSI rising and room to run higher.
Old channel may act as resistance to any rally as will the previous high.
Price target $215

Cup and HandleNo rising wedges noted,. Monthly candle shows this may pull back a bit more.
The handle was inside a rectangle and I hope it is not going back in to the rectangle
Was in a channel up as well. A channel up can also become bearish at the top and a channel down can become bullish when it finally reaches the bottom and breaks up and out of that channel down.
Strong S at 185.85ish
V has broken out but did not hold on to it
Maybe 2nd time around it will
V also has a busted ascending triangle in the chart (when an ascending triangle breaks to the down side it is called a busted A triangle)
Struggling at the top but I do not think Visa as a company and payment source is going anywhere
Chart is very bullish and if it breaks the recent high and holds on, it will be above the A triangle again and the trendline of that triangle will provide S which is at 200ish. The handle Low (HL) and the Mid Cup (MC) also provide support
Probably just a matter on time
NV is very high. Earnings 10-24 estimated
Not a recommendation

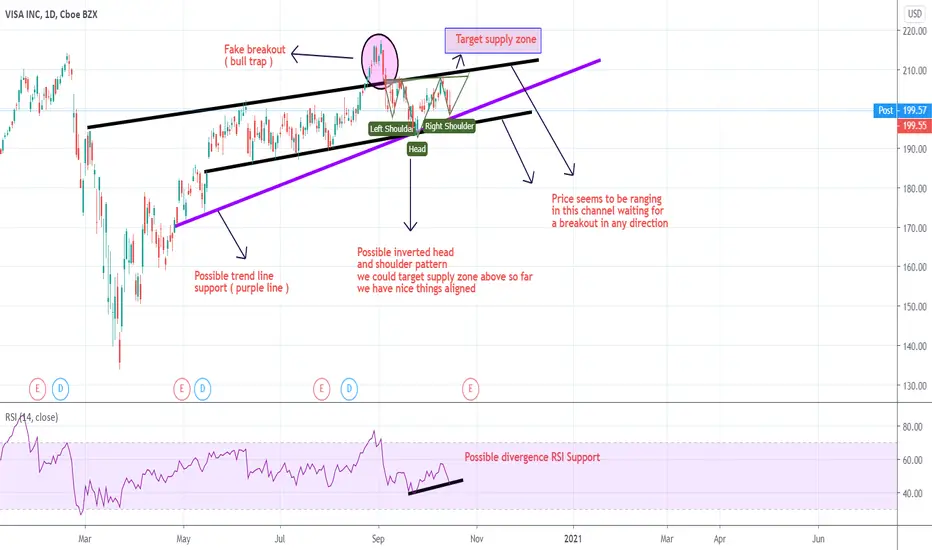
visa is a trust worthy investmentvisa is definitely something you would want to add to your portfolio if you aim to invest in the years to come, great return with a strong bullish trend since 2017.
as of now for quick profit seekers or intra-traders, we would not recomend taking any entry on this stock.
with the fear of a second wave that is closer to get confirm any day, you might want to invest into paypal more that you would on visa.
best regards, David Senior trader at Richmonstocks Paris france.

Short on open: 200.45
Real-Time Algorithmic Trading Signals. All trades are based on a Geometric HMM.
The Ingenuity Trading Model is a Geometric Hidden Markov Model with specific inputs related to Price, Time, Volume , and Volatility .
Our Algorithmic Trading Model offers real-time buy or sell signals with specific entry and exit prices. This affords you the freedom to successfully trade across all markets and market regimes. We are not interested in biased economic research or opinions on the latest Wall Street narratives. We do not trade based on conventional financial analysis. Our signals prove the power of taking a more scientific approach to trading the market.


upward breakout?New to trading and trying to get feedback, let me know what you think!
Visa is in a descending triangle, which I understand is a neutral, but support is consistent at $195+ since before pandemic. So it should climb?
