4V trade ideas

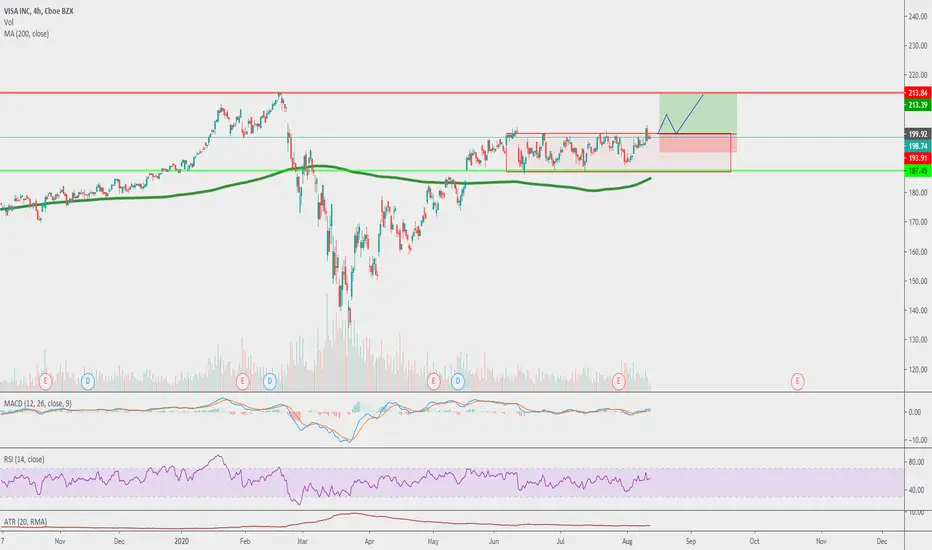
V break out from consolidation in play, but need confirmationA rising wedge appears to have formed inside the two month flattish consolidation channel.
Touching upper bound
Should we see a break out, measured move to 215; Conversely, should support be breached first, target 193/4 but expect the consolidation channel to hold
Risk award skewed towards upside, but waiting for ES1! to resolve here first before a major next leg move in V
Current position: Flat
Disclaimer: These should be seen as the commentator's Notes to Self. Hopefully educational but aiming for entertaining. No legal or financial liabilities should be pursued from these materials.

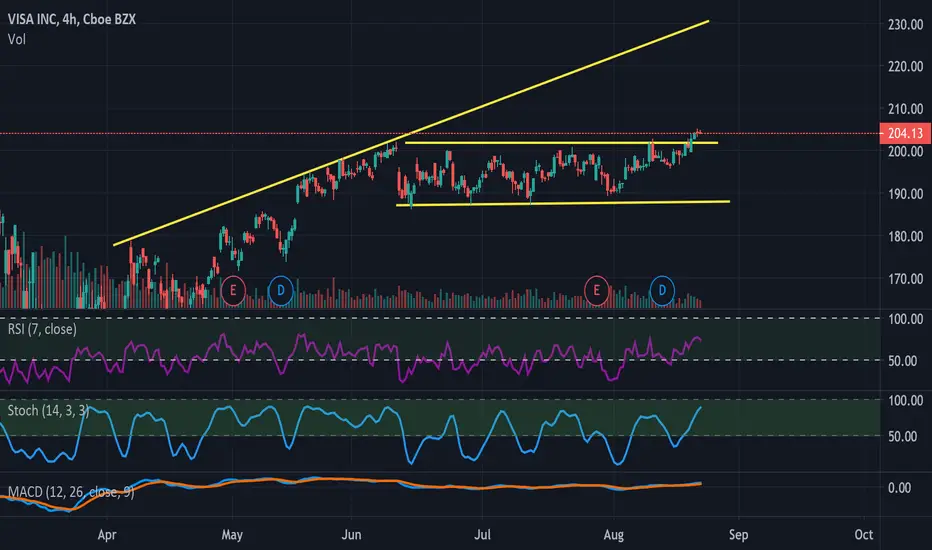
Visa long setupVisa is consolidating in a range. Nice setup for a trend continuation breakout-retest long trade scenario. RR: 1:2
V - 11.08% Potential Profit - Corridor BreakoutCorridor Breakout out of a 2-month correction, support confirmed multiple times on the 5 min.
Target price set at a new potential resistance line.
- Historical uptrend
- RSI + Stoch well above 50
- MACD above Signal
Suggested Entry $203.08 (Limit) or $205.71 (Stop)
Suggested Stop Loss $199.27
Target price $227.91
Note that I tend to adjust stop losses in order to secure profits early and preserve capital. This means that the target price is going to be achieved as long as there are no strong pullbacks that trigger my new adjusted stop loss.

Cup and HandleV has broken up from rectangle .
Cup and handle and looks like she is ready for take off. break out not far away
Targets 2 are longterm targets
Not a recommendation

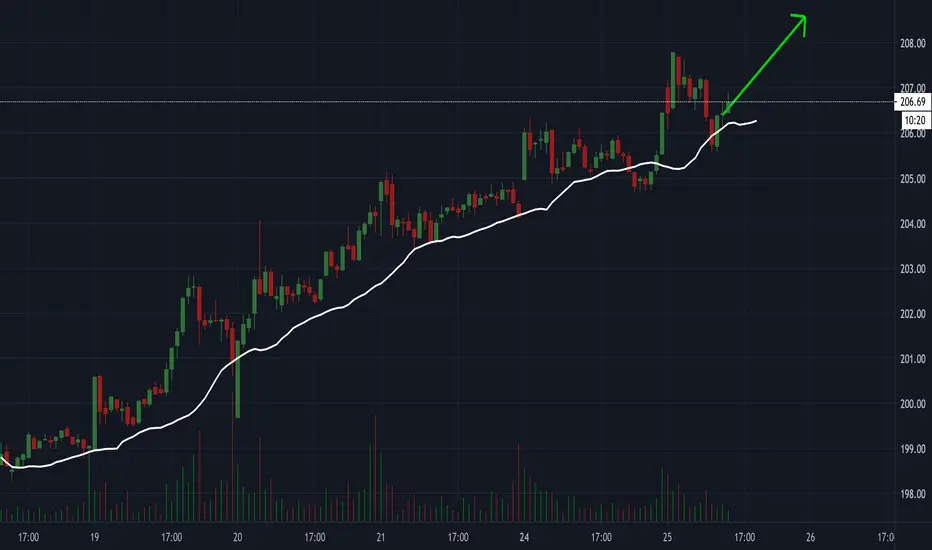
$V VISA Major Breakout Underway
VISA hits a new ATH and has very strong momentum and sentiment behind it, the societal change
to a cashless online payment society is the beginning of a new phase of growth for VISA and its peers.
I have taken a close look at possible Fibonacci targets to aim for in the breakout.
Long term - $284 for wave target.
medium term - $250 key psychological level.
Short term- $220-$225 to confluence of Fibonacci expansion & extension targets .
Some caution is needed as breakout often require a backrest & indicators are extended.
PLEASE, PLEASE take time to give us a like.

Mid- long term play.If you take a look at the chart, you might discover that the current chart of Visa has some similarities with AMD before the breakout.
Visa is trading in a channel right now, support level: 187.33, resistance level: 200.59
My plan for Visa looks like the following: Limit buy: 187
>Stop loss: 177.68
>Take profit: 213.86

VISA, Solid Breakout Of Channel, Aiming Targets To Reach!Hello Traders Investors And Community,
Welcome to this analysis where we look at VISA 4-hour timeframe perspective, the recent events, the current formational structure, what to expect next times, and how possible entries with the ongoing price-action can look like. The stock has shown some significant steps and meaningful confirmations recently which I detected are important factors for further developments.
Looking at my chart you can watch there that the stock just broke above this huge ascending parallel channel marked in blue, this breakout occurred with heavy volatility and solid upside movements, the next times we can expect the upper boundary once more to be tested and confirmed as it is marked in my chart, there is a high possibility given that this support holds sustainable as there is also coming the 60-EMA in black together with the upper boundary forming a coherent support cluster in this range. When the stock bounces up from there we can expect the upside targets to be reached which are lying at the 215 level in the chart when the stock approaches these levels it is important what it will do further if it just moves on bullish or there is a correction when not bigger pull-back showing up visiting lower levels in the range.
Overall the stock established some decent bullish structures here which have a good and appropriate potential to confirm further bullishness and follow up with higher highs, therefore it is important that the stock manages to hold the range and don't falls below the 200-EMA which will firstly invalidate the bullish case, nevertheless as there is a strong volume in this level the possibility for a bearish breakdown is quite marginal.
In this manner, thank you for watching, support for more market insight, all the best!
"Astonishing claims require astonishing results."
Information provided is only educational and should not be used to take action in the markets.

V - We Have a 1:3 R/R HereA close above 102 could signal a run back to all time highs around 215. My trade info is on the chart.
I hope we profit TOGETHER! If you found this to be insightful or helpful, please show appreciation by hitting that like button. If you want more ideas I invite you to follow as well! I try to be here for all of my followers with any questions they might have. Feel free to shoot me a DM or comment below to start a conversation!

Visa IncNYSE:V
Hey, traders.
I suggest we take a look at some interesting long paper.
What's on the chart:
1. A strong mirror level, formed on January 15th.
2. The level is confirmed several times by taps and false breakouts.
3. Since June 23, we start consolidating under the level.
4. After the false breakout on July 23rd, the paper did not go down.
5. After another false breakout on August 11, we did not go down again, and the paper was moving up.
6. On August 19 and 20, there were breakups. We're out of the channel, and I'm expecting volume realization.
According to my trading strategy today, I expect the bar to get fixed and to go long.

V - SOS rally + a backup action to conclude re-accumulation?Context: Trading range between 185-202 was formed since June 2020 after the buying climax.
Structure: Currently undergo SOS rally breakout the resistance. A backup action is expected as a test. After that, major SOS rally or a markup phase is to be expected.
Bias: Bullish
Key levels: Support: 202, Resistance: 209
Tactic: Potential long upon a reversal and breakout from the backup action.

VISA (V) BUY OR LONG , TARGET UP TO $240VISA , about to confirm the " RECTANGLE " pattern at $ 202, target the pattern up to $215, but when it crosses
the $215 zone the potential to go to $240 is huge, I will update it regularly, but buy it first here and TP $215.
V buy : $202
V target 1 : $215
V target 2 : $240 +-2
Stop loss : 8%
Wish you a good deal!

keep it or double your investment !VIsa INC Next Week
Big Traders In The World Entred This Market As Buyers
This Market Will Rise Strongly In The Next days
I advais You To Keep it in the portfolio
Or BUY Or Double Your investment


V - Ready to breakout ?Closing above 200 for the first time since 11 June after 3 attempts
Bounce above EMA20 and sloping up.
Well supported by EMA50
FiFT +ve indicating BULL is in control.
ATOM is BUY indicating chances of breakout is high
Note : MA is having similar pattern but MA is already breakout.
Rst 214.
Sprt 190.
Rounding Bottom Targets: 240, 260, 290
Fundamental
Last 3 months analyst price target is 243 (Align to rounding bottom first target)
Analyst Consensus : 18 Buy, 2 Hold


VISAPossible downtrend. It has reached a key resistance level which has been retested multiple times in the past. Right now, it attempted to cause a breakout but failed due to 2 strong bearish candlesticks. The price also did not break thru the previous false breakout of 202.89.
What I think will happen is that the price will retrace back to the key support level for now. Will decide my position again depending on the next candlestick after it reaches the support - if it goes bear or bull.
Based on the larger time frame, it has been trading in a horizontal channel since May. However, I can see an ascending triangle forming as well hence possible retracement before a bullish continuation. We should wait for further confirmation/go long on retest
Do drop me a like and share with me your analysis!

Visa Inc (V) attempts channel breakout Visa Inc.’s (V) earnings are forecast to grow 14.35% per year according to a dozen or so analysts, despite returning 11.6% over the past year, which is 6% shy of the US Market. Ongoing occasions have been satisfying for Visa as its income have ascended notwithstanding the market's profit going into invert. It appears that many are anticipating that the organization should keep challenging the more extensive market affliction, which has expanded financial specialists' eagerness to settle up for the stock.
Watch for a break above channel (A) resistance at (1) for a re-test of Feb ‘20 highs (213/215s) with 221.00 in extension. Below channel support (lower A) negates this bullish outlook.

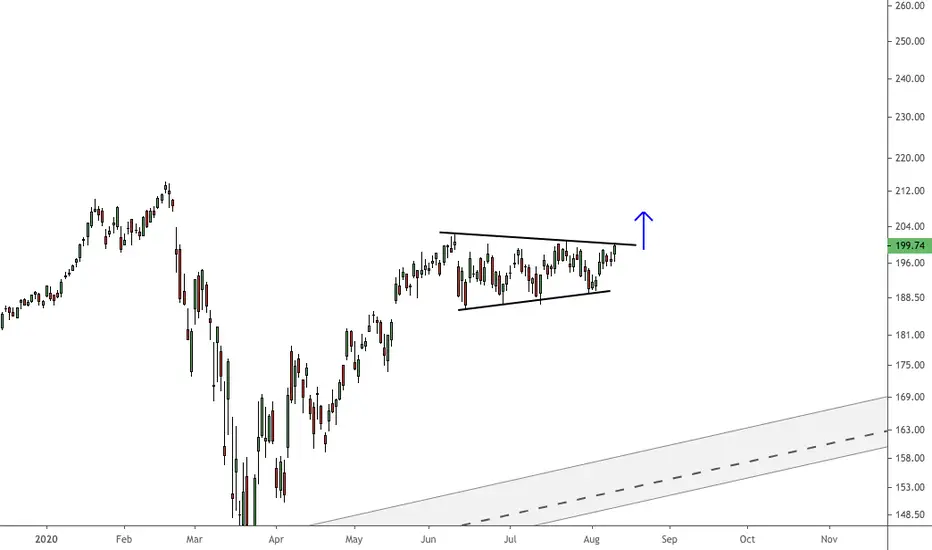
$V pending breakout$V looking to possibly break out of its long lasting range. Should we break out, watch for a gap fill to the marked price target.
