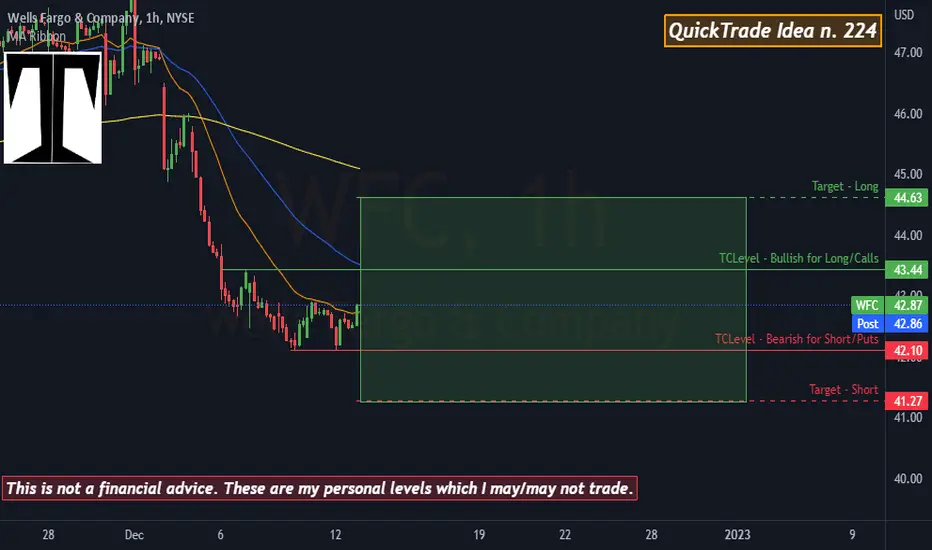
QuickTrade Idea n. 224I am Bullish above $43.44 with target at $44.63
I am Bearish below $42.1 with target at $41.27
4WFC trade ideas
#WFC to 37$?Hello dear Traders,
Here is my idea for #WFC
Price closed below yellow line (previous month low)
Price closed in 15 Minute chart below purple trigger line -> Enter Trade.
Targets marked in the chart (black lines)
Invalidation level marked with red line
Good luck!
❤️Please feel free to ask any question in comments. I will try to answer all! Thank you.
Please, support my work with like, thank you!❤️

WFC , will support hold?Closing on uptrend support (White lines)
And horizontal support around 46$.
If we close below 46$ a full blown reversal could be under way

Wells fargo & companyHello everyone, a potential more than 80% than the market will marke PULLBACK until level 32USD
NYSE:WFC

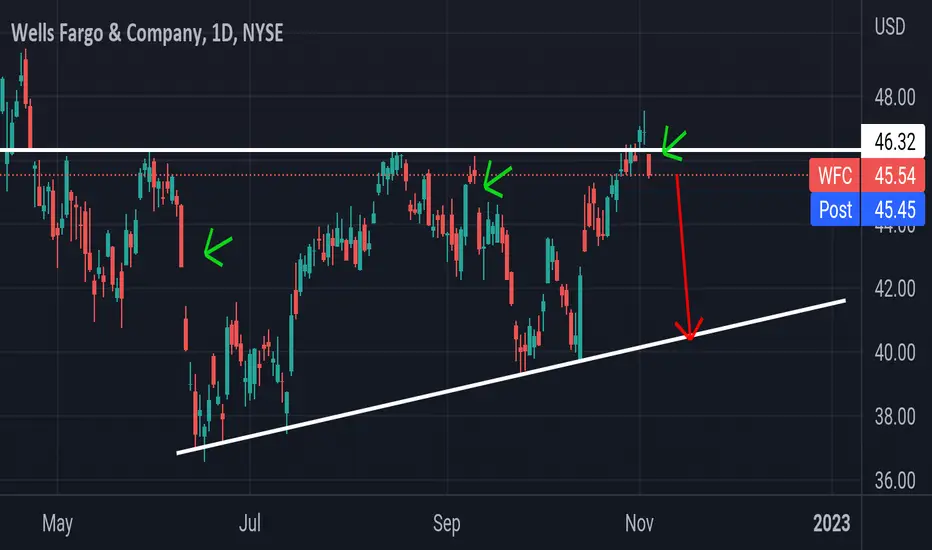
WFC Falling window Falling window 🕯.. Bearish..
I highlighted the previous ones with green arrows
First target 42$ gap close.
My final target is support trendline
Grab some time if you want to ride the whole wave down, could take a couple of weeks . 11/18 minimum.
QuickTrade 144 : WFCLong
looking for a continuation
Short
Looking for a test of the 250 h after this huge move up.

WFC potential head and shouldersWFC potential head and shoulders will look for entry if we break above moving average 200

WFC monthly bearish hammer WFC monthly bearish hammer ABC or wave 3 of downward doesn't matter at this point. Stop loss above the hammer. Be ready to move take profit as we go.

Short idea #14- Still too high upI think WFC is setting up to be a very safe short with decent reward opportunity. I am simply waiting on SPY to get a little higher to ~389 to short this name. I see no reason why this name would continue to hold up, and I suspect it falls through November.

WFC at resistance Posted another idea that XLF is at resistance..
WFC won't break out if XLF reverses
Downside target 40$
Upside target 50$


WFC reversal.Gapped up with the rest of the banks on earnings but had some stiff resistance on weekly 50/200 EMA.
Selling pressure was significant along with daily candle structure.
4hour RSI you will see Bearish divergence .
Short entry - Below Yellow trendline or 43$.
First target -42$ gap close or blue line.
Second target - White tredlndline or 40$

Earnings watch 10/14/22Earnings watch 10/14/22
WFC
MS
UNH
PNC
JPM
C
USB
FRC
Do your own due diligence, your risk is 100% your responsibility. This is for educational and entertainment purposes only. You win some or you learn some. Consider being charitable with some of your profit to help humankind. Good luck and happy trading friends...
*3x lucky 7s of trading*
7pt Trading compass:
Price action, entry/exit
Volume average/direction
Trend, patterns, momentum
Newsworthy current events
Revenue
Earnings
Balance sheet
7 Common mistakes:
+5% portfolio trades, capital risk management
Beware of analyst's motives
Emotions & Opinions
FOMO : bad timing, the market is ruthless, be shrewd
Lack of planning & discipline
Forgetting restraint
Obdurate repetitive errors, no adaptation
7 Important tools:
Trading View app!, Brokerage UI
Accurate indicators & settings
Wide screen monitor/s
Trading log (pencil & graph paper)
Big, organized desk
Reading books, playing chess
Sorted watch-list
Checkout my indicators:
Fibonacci VIP - volume
Fibonacci MA7 - price
pi RSI - trend momentum
TTC - trend channel
AlertiT - notification
tickerTracker - MFI Oscillator
www.tradingview.com

WFC (POTENTIAL BUY/SELL LEVELS) ***BEARISH SENTIMENTJust my basic MONTHLY charting.
I have marked what I see as the POSSIBLE bottom (support).
I see overall DOWNTREND.
I have marked my potential BUY/SELL LEVELS for LONGS/SHORTS/CALLS/PUTS.

WFC Ascending TriangleWFC in an ascending triangle, going to wait for it to break through, can play both sides after waiting for confirmation.
Price targets are highlighted in blue key levels. NYSE:WFC

WFC daily bullish hammer at double bottom retestWFC daily bullish hammer at double bottom retest has to be quick till earnings and countertrend. Stop loss below hammer, take profit to size of last retracement.

Short term short on Wells Fargo. WFCThis is very short term. Closed on the downward impulse, bouncing off the 5th wave origin. Down we go, it's like ping pong in here.
We are not in the business of getting every prediction right, no one ever does and that is not the aim of the game. The Fibonacci targets are highlighted in purple with invalidation in red. Confirmation level, where relevant, is a pink dotted, finite line. Fibonacci goals, it is prudent to suggest, are nothing more than mere fractally evident and therefore statistically likely levels that the market will go to. Having said that, the market will always do what it wants and always has a mind of its own. Therefore, none of this is financial advice, so do your own research and rely only on your own analysis. Trading is a true one man sport. Good luck out there and stay safe.

Analysis-Big probability of an uptrendAs you see on the chart we will have a big probability of an uptrend because we have the breakout with force the vwap indicator and also the breakout of the resistance line. In addition, the resistance line and the support line converge.Thanks.

Wells Fargo on the way down to $30Wells Fargo is in a clear downtrend, we should see a retest of $30 in a few weeks.

WFC - Brink Of CollapseWFC looks like its about to collapse here with this expanding correcting ascending channel breaking to the downside followed by today's bounce that looks like a last short squeeze before headig down.
Hitting long term resistance and also topped 0.786 from previous thrust candle.
I just entered a first position and have a second at the top of the gap.
Stop above top.
Not advice.

Interest running out on $WFC-RECAP🔸️Ticker Symbol: $WFC timeframe: 1 Hour 🔸️3X Bear Pattern 🔸️Investment Strategy: Short
TECHNICAL ANALYSIS: I posted this short position on the 18th.. it took only two days to play out; and those who took this trade doubled their investment. Not only did we have a divergence on our money momentum, which was moving out of the market, but we had a rejection on the extended linear regression channel, and a swing failure pattern at our 1-hr supply level on 17 Aug. This was a perfect setup, with a risk/ reward at 8:1. Everyone in the group took major profit using these indicators!
🔔 Follow for daily stock, crypto and forex technical analysis .
⚠️ Trading is risky, and I understand nothing is guaranteed. Proper risk management should be in place at all times to minimize losses. Please consult a financial advisor before trading. All Inclusive Trading LLC is not a financial advisor and may not be held liable for any losses which may occur.

WFC Run or FallOverall indications, WFC is looking bullish. Currently trading at 45.35 I believe will have a nice run up to 46.49 to 47.50. Currently Trading above the 200, 50, and 20 EMA. Our Trendsi Indicators shows bullish momentum and I don't see WFC slowing down just yet. Come Monday I see a nice push towards or pass 46.49 area before retracing back down to the 45 range to act as a support. I would love to hear your thoughts and feed back. Any critiques and criticism is always welcome.

Interest running out on $WFC🔸️Ticker Symbol: $WFC timeframe: 1 Hour 🔸️3X Bear Pattern 🔸️Investment Strategy: Short
TECHNICAL ANALYSIS: $WFC is about retest 46.26 for the third time this week, and with the overall market looking weaker, I am looking for short positions on this ticker. Money momentum making lower high's, and price "stuck" at the low $46's and every time money momentum gets into this red band, more often than not we get a rejection. Now time for that gap fill from last week!
