WELLS FARGO- BEARISH SCENARIOThe bank earnings season continues with Wells Fargo. The San Francisco-based bank is expected to earn $0.80 per share on revenue of $17.5 billion, or less than a year ago quarter.
Re-test of the resistance is expected followed by a deep dip to the $ 33 support level.
Risk Disclosure: Trading Foreign Exchange (Forex) and Contracts of Difference (CFD's) carries a high level of risk. By registering and signing up, any client affirms their understanding of their own personal accountability for all transactions performed within their account and recognizes the risks associated with trading on such markets and on such sites. Furthermore, one understands that the company carries zero influence over transactions, markets, and trading signals, therefore, cannot be held liable nor guarantee any profits or losses.
4WFC trade ideas

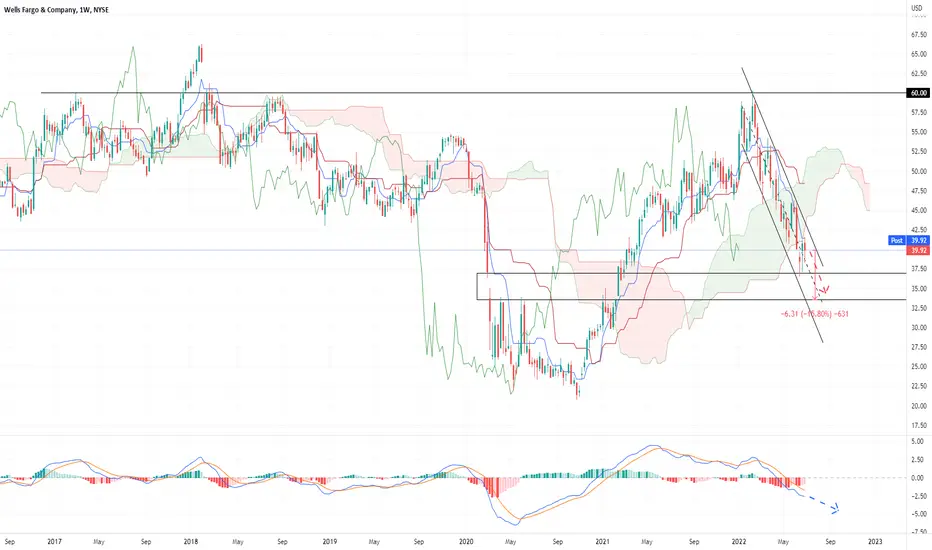
Wells Fargo share to discount -15.8%, WFC $33.50Wells Fargo stock chart on a week time scale highlights a bearish setup, that on a micro-level has been confirmed by the downward revised guidance issued by the bank.
In terms of the chart, becomes possible to see how both weekly candles have shaped a hanging man, with resistance at the Tenkan line, in a downtrend channel already where the stock price trendline,
has already confirmed the sell signal below the IKH Senkou A/B cloud.
Wells Fargo's stock price trendline should drift lower on $37>$33.50


Same idea on $WFC as with $CI'm with Dr. Burry on this on. This financial crisis will really hit the banks.

Looks Bearish at Face Level but something +ve may be cookingAlthough the chart looks quiet bearish at face level, it actually may be bottoming. Looks like a bullish descending wedge is in motion. Also with rate hikes in picture, WFC is the most to benefit of all banks.
With the 5/23 Chase investor meeting where they said increased their performance targets (reversing their commentary from Jan) - which indicates they don't think a recession (or at least not like past recessions) is going to impact consumer spending patterns - translating to a bullish outlook for banks
Cash 23%
PG 13%
AAPL 11%
QCOM 10%
AMD 9%
MSFT 8%
NVDA 8%
CTRA 6%
MRVL 3%
GOOGL 3%
NASDAQ:FORD 3%
WFC 3%
Disclaimer: My opinion on stocks are mine alone and not to be taken as Investment advice.

WFC Up Channel, BreakoutWFC has found support at the 2.618 Fib level (circle)
Price has found its place above of an upward channel that can be drawn
A downtrend can also be seen which hits the low point

WFC: Reversal H&SMain Pattern: Reversal Top H&S
Short on 26 April
ALL ENTRIES on weekly charts made during the week are anticipatory, MUST BE confirmed at the weekend

$WFC with a Bullish outlook following its earnings #Stocks The PEAD projected a Bullish outlook for $WFC after a Negative over reaction following its earnings release placing the stock in drift C with an expected accuracy of 72.73%.
Wells Fargo Reversing? Wells Fargo
Short Term - We look to Sell at 52.76 (stop at 54.67)
Preferred trade is to sell into rallies. There is scope for mild buying at the open but gains should be limited. Bespoke resistance is located at 52.00. The bias is still for lower levels and we look for any gains to be limited.
Our profit targets will be 46.89 and 44.53
Resistance: 52.00 / 55.00 / 60.00
Support: 46.00 / 43.00 / 40.00
Disclaimer – Saxo Bank Group. Please be reminded – you alone are responsible for your trading – both gains and losses. There is a very high degree of risk involved in trading. The technical analysis, like any and all indicators, strategies, columns, articles and other features accessible on/though this site (including those from Signal Centre) are for informational purposes only and should not be construed as investment advice by you. Such technical analysis are believed to be obtained from sources believed to be reliable, but not warrant their respective completeness or accuracy, or warrant any results from the use of the information. Your use of the technical analysis, as would also your use of any and all mentioned indicators, strategies, columns, articles and all other features, is entirely at your own risk and it is your sole responsibility to evaluate the accuracy, completeness and usefulness (including suitability) of the information. You should assess the risk of any trade with your financial adviser and make your own independent decision(s) regarding any tradable products which may be the subject matter of the technical analysis or any of the said indicators, strategies, columns, articles and all other features.
Please also be reminded that if despite the above, any of the said technical analysis (or any of the said indicators, strategies, columns, articles and other features accessible on/through this site) is found to be advisory or a recommendation; and not merely informational in nature, the same is in any event provided with the intention of being for general circulation and availability only. As such it is not intended to and does not form part of any offer or recommendation directed at you specifically, or have any regard to the investment objectives, financial situation or needs of yourself or any other specific person. Before committing to a trade or investment therefore, please seek advice from a financial or other professional adviser regarding the suitability of the product for you and (where available) read the relevant product offer/description documents, including the risk disclosures. If you do not wish to seek such financial advice, please still exercise your mind and consider carefully whether the product is suitable for you because you alone remain responsible for your trading – both gains and losses.

WFC 2d2u on the weekInside 4 hour for the continuation? Banks may push this week as earnings season kicks off. Closed above the trigger to keep the 2u in force.

wfc bullishwfc is at the strong support line
so you can entered to a buy position with carefull postion sizing
still not late to get in
but be carefull. we got earning coming next week
but it seems earning would not be bad
wfc is a big bank with cheap stock price compare to JPM.

ABC Bullish/Earnings 4-14 BMOStrange I know and I do not blame you if you call me crazy! Earnings are next week on Thursday.
Banks have been on the bad news side of things as of late like almost everything else )o:
If this goes below 45.77 before next Wednesday afternoon, then I am not getting in and plan to watch before earnings.
I need a bank in my IRA.
Possible stop below 45.76
No recommendation.

Doji buy signalBuy signal with the main up trend, very well placed Doji candle after a nice pullback move...

Wells Fargo: Changing the Trend? Wells Fargo - Short Term - We look to Sell at 51.31 (stop at 53.31)
Preferred trade is to sell into rallies. 20 1day EMA is at 51.20. Bespoke resistance is located at 51.00. The bias is still for lower levels and we look for any gains to be limited.
Our profit targets will be 46.00 and 44.53
Resistance: 51.00 / 55.00 / 60.00
Support: 46.00 / 43.00 / 40.00
Disclaimer – Saxo Bank Group. Please be reminded – you alone are responsible for your trading – both gains and losses. There is a very high degree of risk involved in trading. The technical analysis, like any and all indicators, strategies, columns, articles and other features accessible on/though this site (including those from Signal Centre) are for informational purposes only and should not be construed as investment advice by you. Such technical analysis are believed to be obtained from sources believed to be reliable, but not warrant their respective completeness or accuracy, or warrant any results from the use of the information. Your use of the technical analysis, as would also your use of any and all mentioned indicators, strategies, columns, articles and all other features, is entirely at your own risk and it is your sole responsibility to evaluate the accuracy, completeness and usefulness (including suitability) of the information. You should assess the risk of any trade with your financial adviser and make your own independent decision(s) regarding any tradable products which may be the subject matter of the technical analysis or any of the said indicators, strategies, columns, articles and all other features.
Please also be reminded that if despite the above, any of the said technical analysis (or any of the said indicators, strategies, columns, articles and other features accessible on/through this site) is found to be advisory or a recommendation; and not merely informational in nature, the same is in any event provided with the intention of being for general circulation and availability only. As such it is not intended to and does not form part of any offer or recommendation directed at you specifically, or have any regard to the investment objectives, financial situation or needs of yourself or any other specific person. Before committing to a trade or investment therefore, please seek advice from a financial or other professional adviser regarding the suitability of the product for you and (where available) read the relevant product offer/description documents, including the risk disclosures. If you do not wish to seek such financial advice, please still exercise your mind and consider carefully whether the product is suitable for you because you alone remain responsible for your trading – both gains and losses.

no digital assets?Wells Fargo is lacking behind in offering digital assets to the consumers such as the flexibility of other modern silver and gold spending accounts.

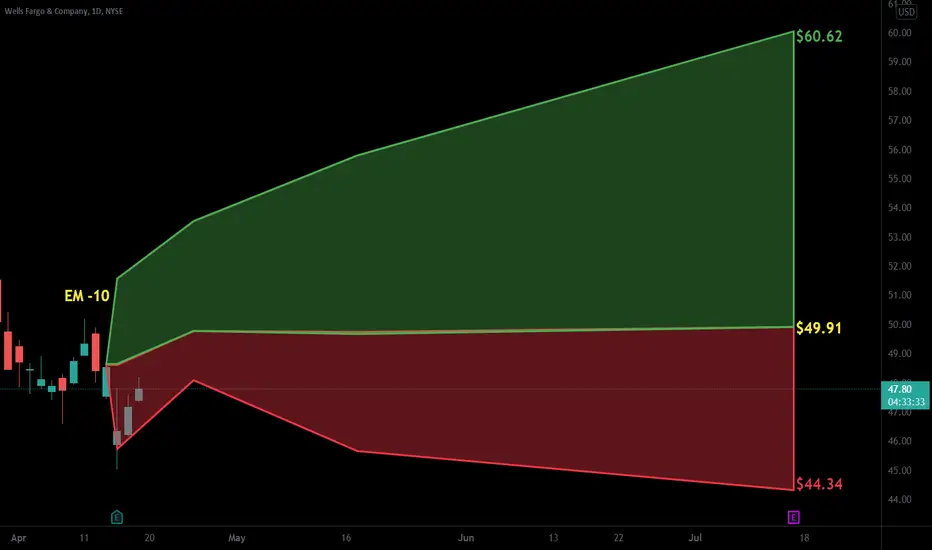
Correction seems finished in WFCEntry: 50-52
Stop loss: daily candle closing below 50
Reward/Risk: 4
Target range: 60-61
Time Frame: 4-6 wks
Possible gain: 15%
Possible loss: 3.75%
Position size: 5 % of trading capital
You can see the most important support(green line) and resistance (red line) levels.
Best,
Dr. Moshkelgosha M.D
DISCLAIMER
I’m not a certified financial planner/advisor, a certified financial analyst, an economist, a CPA, an accountant, or a lawyer. I’m not a finance professional through formal education. The contents on this site are for informational purposes only and do not constitute financial, accounting, or legal advice. I can’t promise that the information shared on my posts is appropriate for you or anyone else. By using this site, you agree to hold me harmless from any ramifications, financial or otherwise, that occur to you as a result of acting on information found on this site.

$WFC Key levels, Analysis & TargetsWFC Key levels, Analysis & Targets
Time frame D1 Bearish Divergences in MACD & RSI Indicator

WFC is looking bullish for short termWFC is on a bull trend mode following the trend also it going to make a new high ahead of Ukraine and Russia issue.

Wells Fargo at 61.8% Fibonacci RetracementWells Fargo - Short Term - We look to Buy at 51.28 (stop at 49.63)
Preferred trade is to buy on dips. Previous support located at 51.00. We have a 61.8% Fibonacci pullback level of 51.49 from 46.04 to 60.30. The medium term bias remains bullish. Expect trading to remain mixed and volatile.
Our profit targets will be 56.06 and 59.10
Resistance: 57.00 / 60.00 / 65.00
Support: 51.00 / 47.00 / 40.00
Disclaimer – Saxo Bank Group. Please be reminded – you alone are responsible for your trading – both gains and losses. There is a very high degree of risk involved in trading. The technical analysis, like any and all indicators, strategies, columns, articles and other features accessible on/though this site (including those from Signal Centre) are for informational purposes only and should not be construed as investment advice by you. Such technical analysis are believed to be obtained from sources believed to be reliable, but not warrant their respective completeness or accuracy, or warrant any results from the use of the information. Your use of the technical analysis, as would also your use of any and all mentioned indicators, strategies, columns, articles and all other features, is entirely at your own risk and it is your sole responsibility to evaluate the accuracy, completeness and usefulness (including suitability) of the information. You should assess the risk of any trade with your financial adviser and make your own independent decision(s) regarding any tradable products which may be the subject matter of the technical analysis or any of the said indicators, strategies, columns, articles and all other features.
Please also be reminded that if despite the above, any of the said technical analysis (or any of the said indicators, strategies, columns, articles and other features accessible on/through this site) is found to be advisory or a recommendation; and not merely informational in nature, the same is in any event provided with the intention of being for general circulation and availability only. As such it is not intended to and does not form part of any offer or recommendation directed at you specifically, or have any regard to the investment objectives, financial situation or needs of yourself or any other specific person. Before committing to a trade or investment therefore, please seek advice from a financial or other professional adviser regarding the suitability of the product for you and (where available) read the relevant product offer/description documents, including the risk disclosures. If you do not wish to seek such financial advice, please still exercise your mind and consider carefully whether the product is suitable for you because you alone remain responsible for your trading – both gains and losses.

dip before the rip ✅wfc saw another rejection at the strong trend resistance zone, should head back to 51-53 area before the next leg higher.
like and follow for more! 🔥

WFC BearIm coining this pattern as the tipping beaker.
With current tensions abroad and the futures market leading the way, we should be on track for a Mcap reset.
Peep MACD and RSI bearish divergence. With RSI crossover already occurring.
Target 47.89 then 43.41 which is fib 50 level. From there we should see if we'll go lower or higher.
Good luck fellow chartist

Wells Fargo Escapes Consolidation RangeWells Fargo began 2022 with a surge to new multiyear highs. Now after a pullback, the bank is showing signs of continuation to the upside.
First, notice the consolidation between $42 and $52 in the second half of 2021. It made WFC’s January 4 jump above that range a potentially significant breakout.
Second, consider the hammer candlesticks on January 24 and 25. Other financials slid below their 50-day simple moving average (SMAs) those same sessions. Buyers defended WFC above that line, showing its relative strength within the sector.
Speaking of the relative strength in the sector, WFC’s 70 percent gain in the last 12 months ranks highest among members of the SPDR Financial ETF .
Next, last week’s bounce occurred above the November high. Old resistance became new support.
Finally, WFC has more recently held its 21-day exponential moving average (EMA). Its 8-day EMA also remained above the 21-day EMA during all of January’s broader market pullback.
TradeStation is a pioneer in the trading industry, providing access to stocks, options, futures and cryptocurrencies. See our Overview for more.
Important Information
TradingView is not affiliated with TradeStation Securities Inc. or its affiliates. TradeStation Securities, Inc., TradeStation Crypto, Inc., and TradeStation Technologies, Inc. are each wholly owned subsidiaries of TradeStation Group, Inc., all operating, and providing products and services, under the TradeStation brand and trademark. When applying for, or purchasing, accounts, subscriptions, products and services, it is important that you know which company you will be dealing with. Please click here for further important information explaining what this means.
This content is for informational and educational purposes only. This is not a recommendation regarding any investment or investment strategy. Any opinions expressed herein are those of the author and do not represent the views or opinions of TradeStation or any of its affiliates.
Investing involves risks. Past performance, whether actual or indicated by historical tests of strategies, is no guarantee of future performance or success. There is a possibility that you may sustain a loss equal to or greater than your entire investment regardless of which asset class you trade (equities, options, futures, or digital assets); therefore, you should not invest or risk money that you cannot afford to lose. Before trading any asset class, first read the relevant risk disclosure statements on the Important Documents page, found here: www.tradestation.com .
