WMT ShortWalmart is one of the important stocks for measure CPI. I think with tight stop it will interesting to be bearish on WMT
4WMT trade ideas

$WMT with a Bullish outlook following its earnings #Stocks The PEAD projected a Bullish outlook for $WMT after a Positive Under reaction following its earnings release placing the stock in drift A with an expected accuracy of 85.71%.

WMT Backtesting Long Term SupportShort WMT here. Long term support is broken and being backtested. Tough to break thru once out. SImilar to CVS and other DOW stocks.

Walmart gap fill, will go down with a thrill?As we look at the Walmart chart we see a strong rally due to "earnings" but will the strength of the bulls last? I've been bearish on stocks for months now, expecting another swipe of the lows, or possibly even a new low in the coming weeks/months. Walmart is no exception to this outlook, we see a LARGE gap left behind from the last dump and now we're seeing a nice push up in the form of a bear flag that could lead to much lower prices. Below I will post a chart of the weekly chart for Walmart, it looks like it fell out of multi-year parabolic trend support, and is now retesting it as resistance. I believe Walmart will see much lower prices going into the new year, I'll be keeping an eye on how this develops.
Remember, stay calm, level-headed, and don't follow the crowd, only the charts.

Pain Ahead!Don’t get me wrong, the company is fabulous and earnings was rock solid in this economy but rallies end in euphoria. In my opinion so far the distribution is completed and the price is going to fall.
Do you remember Amazon when it was around 3.5K and we had beats and 4K price targets everywhere?
The same situation is happening right now as consumers suffer due to inflation.
Monthly RSI has made a curve and is going toward oversold situation over time.
My target is 105$ :)
Obviously not a Financial Advice.

WMT Simple Chart AnalysisWe do emphasize this before for breakout monitoring. If things go smoothly, it might retest 160 area.

Walmart expected move?Walmart resolution for the coming month is thoroughly examined without mathematical physics, but follows the range of trajectory from physics, put 2 crosses each simulating it's x-axis and y-axis, you can trace the time it takes for market makers to dilute the price of a stock if the companies don't follow it's projected position, walmart could, but not saying it would, follow a 40% decline the next 15-20 trading days. This analysis is purely speculative, following 11/15/22 is their earnings day, and their success on earnings can change the direction of Walmart at the market maker's discretion, concluding this analysis to be taken at grain of salt, and NOT *financial advice*, always follow anyone's thesis with due diligence.
profit taking 1: 135
profit taking 2: 129
profit taking 3: 115 } Aggressive shorting
profit taking 4: 105 } Aggressive shorting
profit taking 5: 95 } Aggressive shorting
profit taking 6: 84 } Aggressive shorting

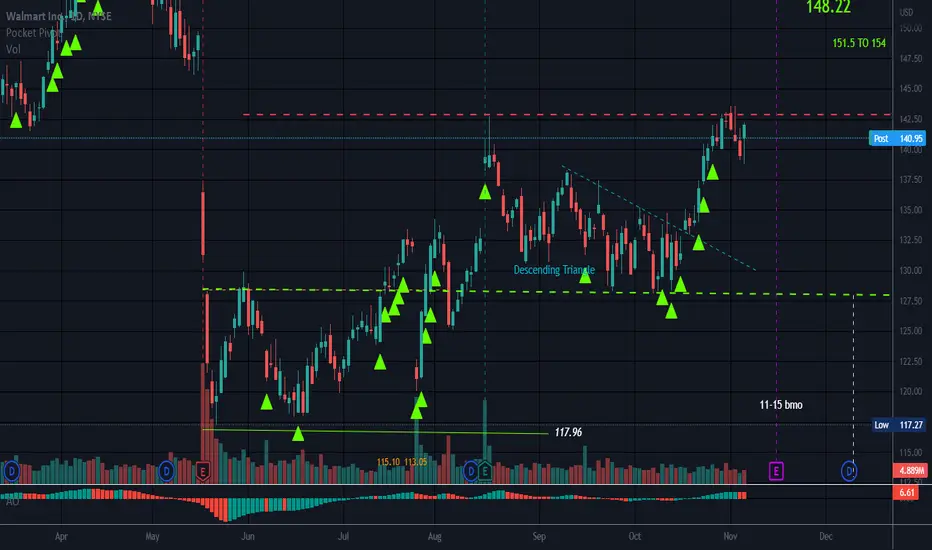
RectanglePrice broke upward from a Descending Triangle.
The top trendline of the Rectangle held so far as resistance.
Earnings on the 15th before market open.
No recommendation.
Walmart: A Christmas CarolAre you channeling your inner Santa Claus or Ebenezer Scrooge this year? Heading into November, we're not hearing the christmas bells just yet. Although the Walmart stock looks like its heading to the Northpole at $153.66, we expect a correction in between $145.22 and $153.66. Ideally, there'll be a turnaround heading below the support at $117.27. After pulling a Scrooge on us, the correction should be completed in the grey target zone between $116.49 and $105.01 before it moves back north.
The secondary scenario brings much more christmas cheer with a 40% chance, that the course exceeds the $153.99 with Rudolph guiding the way instead of dropping down south.

WMTSurprised to see this back up where the Waltons sold. I'm trying short here again. Stop above today's high. Still think this is just forming a massive bear flag.

WMT weekly bearish hammerOrder SELL WMT NYSE Stop 127.41 LMT 127.41 will be automatically canceled at 20230401 01:00:00 EST
WMT weekly bearish hammer. B wave or 3 wave it's going down. Stop loss above pivots.

Is Walmart Squeezing Toward a Breakout?Walmart has squeezed into a tight range after a big drop in the spring. Now some traders may be looking for a potential breakout.
The main pattern on today’s chart is the falling trendline along the highs of April, August and September. WMT remained consistently below this resistance until yesterday.
Second is the $128 level, where prices bounced in late September and early October. If these turn into monthly lows, they could represent a potential double-bottom on the weekly chart.
Speaking of the weekly, WMT just completed a bullish inside week.
Next, Tuesday’s positive close established prices back above the 50-day simple moving average (SMA).
This chart includes our 2 MA Ratio custom script and Bollinger Bands Width. 2 MA Ratio shows that the 8-day exponential moving average (EMA) has crossed above the 21-day EMA, which could be a positive sign for short-term momentum.
Bollinger Bands Width also shows a tight volatility squeeze as WMT compressed into a narrowing range. That may create the potential for increased movement if prices start to expand.
TradeStation has, for decades, advanced the trading industry, providing access to stocks, options, futures and cryptocurrencies. See our Overview for more.
Important Information
TradeStation Securities, Inc., TradeStation Crypto, Inc., and TradeStation Technologies, Inc. are each wholly owned subsidiaries of TradeStation Group, Inc., all operating, and providing products and services, under the TradeStation brand and trademark. You Can Trade, Inc. is also a wholly owned subsidiary of TradeStation Group, Inc., operating under its own brand and trademarks. TradeStation Crypto, Inc. offers to self-directed investors and traders cryptocurrency brokerage services. It is neither licensed with the SEC or the CFTC nor is it a Member of NFA. When applying for, or purchasing, accounts, subscriptions, products, and services, it is important that you know which company you will be dealing with. Please click here for further important information explaining what this means.
This content is for informational and educational purposes only. This is not a recommendation regarding any investment or investment strategy. Any opinions expressed herein are those of the author and do not represent the views or opinions of TradeStation or any of its affiliates.
Investing involves risks. Past performance, whether actual or indicated by historical tests of strategies, is no guarantee of future performance or success. There is a possibility that you may sustain a loss equal to or greater than your entire investment regardless of which asset class you trade (equities, options, futures, or digital assets); therefore, you should not invest or risk money that you cannot afford to lose. Before trading any asset class, first read the relevant risk disclosure statements on the Important Documents page, found here: www.tradestation.com .

#Long WMTSymmetric triangle found with breakout from top
TP set as per back of the triangle
SL set below the bottom slope


Wal-Mart (WMT) Appears Prime for a Run to the Upside!Wal-Mart Appears Prime for a Run to the Upside!
Patterns Identified- ABCD and an Inverse head & shoulders pattern on Wal-Mart's (WMT) daily chart!
I expect a break of the neckline over the next few sessions. We popped above the trendline today and came back inside the triangle. Also we closed slightly below the zone (see screenshot below).
My next entry on Wal-Mart will be above 135 or after we break and hold above the upper trendline.
Short % of float 1.09 (as of October 1, 2022).
Bias-Bullish
Peace in Love,
MrALtrades00

$WMT Bullish Pattern$WMT has been trending since May 2022 crash. It seems to currently be putting in a bullish flag and pennant pattern. Let see if it can go to resistance of the 200EMA at $134. It may pull back with /ES and then climb. Let's see where it goes.

Breakout/false breakout coming?!The WMT has just touched its daily resistance for the fourth time.
Stocks tend to break out shortly after the fourth time.
The fact that the graph shows a "bull flag" strengthens my previous statement.
In addition, the MACD has-had a weak bearish momentum, while the broader market had a big bearish momentum.
However, the RSI continues to show a downward trend.
Moreover, today's candle is weak while the broad market is rising.
It seems to be rejected by the daily resistance.
My assumption is that, there will be a sudden shift in one direction or the other.
It will be due to a breakout or a false breakout.
If you are asking me, a "straddle" might be the best way to play it.
Support: 132.06, 129.79, 125.86
Resistance: 135.88, 142.08, 145.91


Could WMT be starting its death drop?Here I have market off major zones where price tends to retrace too before a major change of direction. You may also notice the rising wedge headed back that has already started playing itself out. This move will happen over a short period of time. I say this because once enough selling pressure has been established, buyers will fearfully close their longs causing price to move lower which will of course attract more sellers leaving the price only to do one thing...

WMTNasty close to this week unless something unexpected happens between now & the close to push it up $2. The downtrend in this name began in April/May with the false breakout that ended with a sharp decline. Since then it's been in a bear flag that is breaking down this week. Below $130.50 could get ugly imo. Ultimately looking for sub $90s next year. Remember Waltons sold at $140. If they don't want it, I don't want it.

Walmart triangleThis chart of retail giant Walmart shows price is currently heading towards a possible inflection point between up and down trend in this triangle pattern.

Walmart Inc weekly analysis.Hello ladies and gentlemen, according to my graphical analysis Of The Walmart Inc , there is a high probability decline in the coming weeks!

WMT weekly bearish hammer at local high with great volumeWMT weekly bearish hammer at local high, ABC or wave 3 downward doesn't matter at this point. Probably will move stop loss back higher if needed. Pretty confident it goes lower. BE ready to move take profit lower as we go and trend is confirmed. Train your holding muscle.
