Short wait for set-up observed EURSEK Hello Traders,
Short observed for eursek, we need to wait for the set up formation.
R:R approx 1 to 4+
Your reflections on my analysis I highly honor.
Thank you.
EURSEK trade ideas

Long longterm EURSEK outlookHello Traders,
Long long-term EURSEK.
I will be honored for your reflections on my analysis.
Thank you.

EURSEK - LongRetracement on psychologial 10.00 level breakout. CB ha no intention of raising rates, deep negative real rates and problems on the housing market. Retracement has reached 50% fib level @ 9.86.
Go Long @ 9.8960
Take Profit @ 10.16
Stop Loss @ 9.85

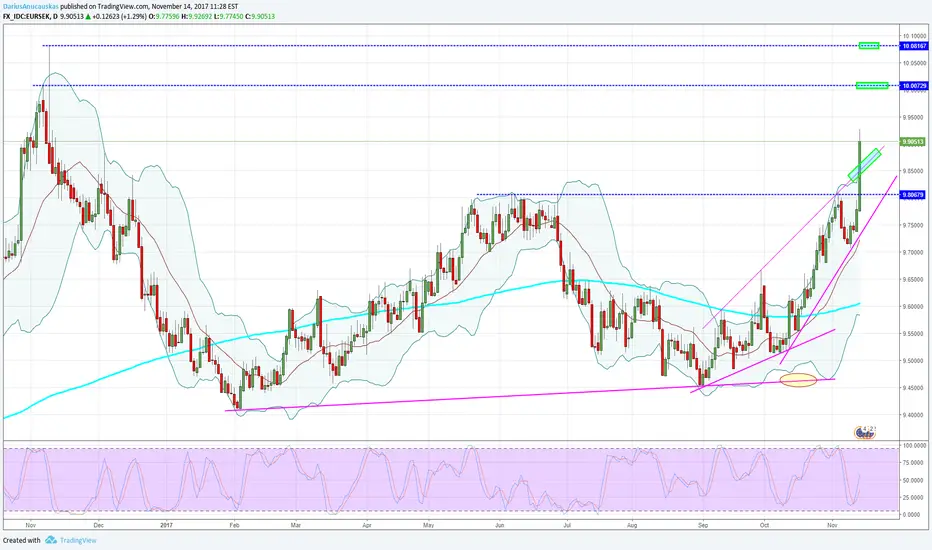
EURSEK - Daily - Exaggeration.Honestly, somebody really wanted to take out all the SELLers.
This move is such an exaggeration that WOW!
I believe that even though tomorrow there could be some more BUYing, still eventually it will have to come and re-test the strong resistance line, that was broken today and has become a potential support for the future price moves.
This level was 9.80679 (this year's high), which now will be a good support.
On the upside, we have the old 10.00729 and 10.08167 levels, which were the top highs for the past 7 years. Last time those levels were met were in 2010. So now EURSEK is on it's way to hitting those levels again.
Don't get me wrong, overall I think we will definitely see those high targets, but not before re-testing that support line that was created today. That's why I am making a call towards the SELL side first and then after I am becoming more bullish.
Happy trading and keep an eye on the price action!

EUR/SEK 1H Chart: Euro tests 200-hour SMAFollowing a five-week appreciation against the Swedish Krona in an ascending channel, the common European currency has formed a channel in the opposite direction and is thus gradually moving lower.
The pair reached a 2017 high last week when the rate reversed from the 9.8044 area. This suggests that a decline in both medium and long term is a likely option.
The rate is currently testing the upper line of the junior channel—an area which is likewise reinforced by the 200-hour SMA. From this perspective, the rate should rebound from the this resistance and edge lower. However, given the steepness of the descending channel, this formation is unlikely to hold for long.
Technical indicators flash mixed signals, but the overall tendency seems to point southwards. The rate might go as low as the monthly PP circa 9.67 during the following trading sessions prior to making a minor recovery.

EURSEK 240 MINS SELL SETUPSell Setup :)
Keep It Simple, Keep It Unique :)
Happy Forex Trading :)
Happy Profit Making :)


EURSEK SHORT (WEEKLY) - correction of earlier long ideaI had given a vague head and shoulders pattern that suggested a long that was visible on the daily chart. The stochastic indicator which usually affirms the directional bias in some cases for me was not in agreement. So I had to dig deeper rather than just relying on the said vague head and shoulder and am convinced EURSEK will go down to 9.33 BEFORE trending LONG.
The exact pattern (completed pattern) can be found on the EURJPY weekly chart. The fib ratios are the same, the difference is that the pattern on the EURJPY is inverted.


EUR/SEK 1D Chart: Channel in TriangleBy large the slow moving low volatile EUR/SEK pair has been slowly moving in an ascending channel pattern on the daily chart. However, it has experienced a distinct spike in the second half of September, which in general is a cause for caution.
Meanwhile, on a larger scale the currency exchange rate has formed a massive scale triangle pattern. The tip of the triangle is located almost at the 9.50 mark and in the year of 2018, which means that the triangle might hold for a long time. Although one should watch for possible breakouts near its borders.
In regards to shorter term trading, the pivot points and the daily simple moving averages are a good guide.


Buy the eursekGuys,
This is the trade i got this morning. for a potential pull back on the 1 hour chart
Success
RandR

EUR/SEK going down on all scalesThe common European currency recently reached the upper trend line of a junior descending pattern against the Swedish Krona. Due to that reason the pair can be considered at a significant crossroads for short term traders.
If the pair passes the resistance, which is a lone one, it would surge first to the 100-hour SMA at the 9.50 mark and later on to the resistance cluster located from the 9.5110 mark to the 9.5165 level.
On the other hand the rate might fall and search for support in the 55-hour SMA at the 9.4825 level. In addition, if the 55-hour SMA continues to decline, it will be strengthened by the weekly S1 at the 9.4796 level.

EURSEK - Daily - Karlsson is getting stronger... For now.Because, at the moment, I am a believer in the Euro weakening, I think it's a great opportunity for all other currencies to recover against it. This opportunity might not last for too long, but certainly is something to keep in mind for the time being.
I think it is clear that it will try to touch the closest upward trend line. That's only if there won't be any ridiculous statements from the ECB or "Sverige".
In the mean time, I am looking for it to touch that trend line and then we will have re-evaluate the situation. Maybe it will become a strong support and it will bounce from it higher. Personally me, I doubt that, because the ideal area for the bounce would be the even lower bubble on the lower trend line. But hey, what I want is not taken into consideration by the market.
As always, keep an eye on the price action!

Bearish butterfly completeButterfly pattern completion point at 9.59240
Take profit target #1 9.56000 Take profit target #2 9.54000
Stop loss 9.59300


possible cypher patterncypher pattern projection complete around 9.60240
RSI complex structure completed 9.47530 followed by impulse structure completed at 9.44905
take profit target 9.60200
stop loss 9.49100 right below MA 20
trade execution after breakout past 9.51000
please comment if you see any contradiction!

Bullish Gartley in fruitionTracking back over my previous trade on 4h chart
Potential Bullish Gartley pattern completion between points 9.31250-9.35420
RSI complex structure completed at point 9.50720 anticipating impulsive retest around point 9.32230
Completion of 1.27AB=CD pattern around 9.31250
Update with TP & SL ensuing completion of Gartley
Comment if you have any contradicting trade information please!


Bear Trend resumes for EURSEKMinor resistance at 9.5575. Price action failed to break and close above that level even after last week's non-starter from Mario and Yellen. Look for trend resumption and therefore trade as follows:
Sell Limit: 9.5270
Stop Loss: 9.5580
Take Profit: 1:3 Risk reward ratio
Of course, look to win more than you lose.

EURSEK H4 LongThe Euro against the Swedish Krone is showing a false breakout through support level and a successive rejection afterwards at the same support level, which to me indicates that price can go higher from here. In addition it could very well be that the sellers that are trapped now have set their stops above the consolidation area at 9.55, which would mean a fast trip to 9.60 once the 9.55 level has been taken out.

