EURSGD trade ideas


EURSGD potential bearish reversalon DAILY: EURSGD is sitting around a resistance zone in blue so we will be looking for objective sell setups on lower timeframes.
unless price breaks it upward aggressively, then a bullish movement till our next resistance in purple would be expected.
on H1: this pair formed an objective trendline in red, and it is now forming a double top pattern.
So we are waiting for a momentum candle close below our last swing that forms around our red trendline to sell EURSGD.
meanwhile, EURSGD would be overall bullish.


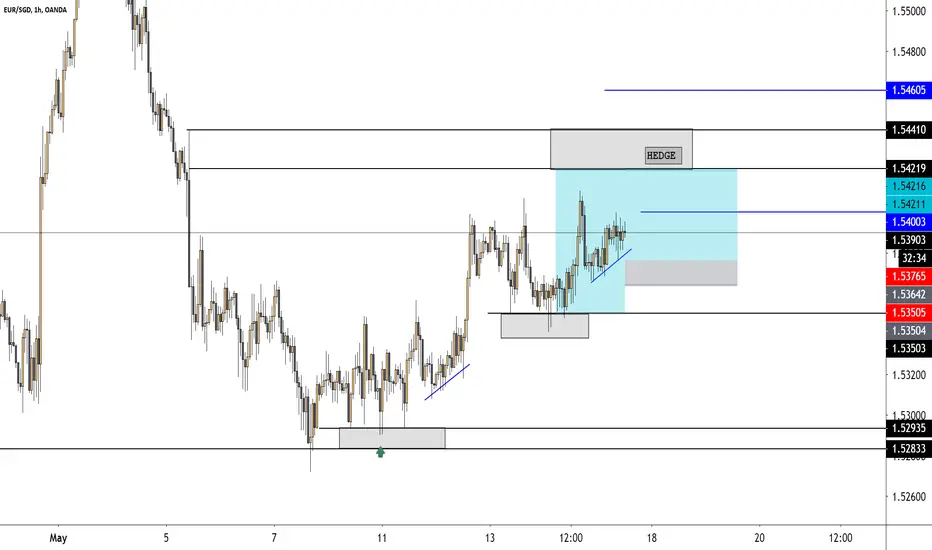
EURSGD Broke Dynamic Resistance 🦐EURSGD Broke Dynamic Resistance and Now the price is retesting the recent structure.
According to Plancton's strategy we can set a nice long
–––––
Here is the Plancton0618 technical analysis, please comment below if you have any question.
The ENTRY in the market will be taken only if the condition of Plancton0618 strategy will trigger.


Divergence TradePrice has been on a steady bullish move and it has recently lose steam. I treat this trades as a counter trend small moves. Trade at your own risk.

Sluggish Rise to Fall. EURSGD Short Idea.Price has reached Strong Resistance level which is also, on weekly perspective, a Fibo 38,2 (Swing Low to Swing High). Prices have been kind of sluggish lately and has a bullish tendency. For now i am waiting for a tiny Pullback to that "Red Box" with short bias. Depending on Price Action and result of retest i'll short or leave EURSGD. Stop Loss above previous High and Take Profit on the "Anticipated Daily Fibo 50,0" which is also a key support level (Could be coincidence). GL.

EURSGD TRADE SHORT IDEAEURSGD has been caught in a range so i will like to see price break our mini zone before going short...


EURSGD potential reversalEURGD is currently sitting around a strong supply zone in red.
price is currently trading inside our blue channel, and also formed an objective head and shoulders.
we are waiting for a momentum candle close below our blue neckline to sell this one.
we also have divergence on MACD adding more confluence to our setup.


EURSGD:Inverse Head and Shoulders1.Inverse Head and Shoulders
2. TP1 =104 pips
TP2=185 pips
Please don't forget to FOLLOW , LIKE and COMMENT ...If you like my analysis:)
Thank you and Good Luck!


EURSGDGood afternoon all, I am currently long on this currency pair as I see going up towards the previous resistance level set on the 1st of May.
Reasons to consider buying:
1. Price is currently above the 50 MA
2. Price broke through the Resistance level and came back to re test possibly turning it into a new support.
3. Did price form a bullish flag?
Always do your own analysis before opening any trades and be sure of using proper risk management.