EURUSDHello Traders! 👋
What are your thoughts on EURUSD?
EURUSD has broken support level and its ascending trendline, indicating a possible shift in short-term market structure and growing bearish pressure.
In the short term, we expect a pullback toward the broken support/trendline zone.
If price fails to reclaim this level, a continued move lower toward the next identified support zone is likely.
As long as price remains below the broken structure, the short-term outlook stays bearish.
Don’t forget to like and share your thoughts in the comments! ❤️
EURUSD trade ideas
EUR/USD - Daily Chart (Wedge Breakout) (16.07.2025) The EUR/USD Pair on the D1 timeframe presents a Potential Selling Opportunity due to a recent Formation of a Wedge Pattern. This suggests a shift in momentum towards the downside in the coming Days.
Possible Short Trade:
Entry: Consider Entering A Short Position around Trendline Of The Pattern.
Target Levels:
1st Support – 1.0956
2nd Support – 1.0625
💡 Fundamental & Sentiment Context
Euro under pressure amid renewed concerns over EU‑US trade friction .
The USD is strengthening, supported by safe‑haven flows amid tariff uncertainties.
🎁 Please hit the like button and
🎁 Leave a comment to support for My Post !
Your likes and comments are incredibly motivating and will encourage me to share more analysis with you.
Best Regards, KABHI_TA_TRADING
Thank you.
Disclosure: I am part of Trade Nation's Influencer program and receive a monthly fee for using their TradingView charts in my analysis.

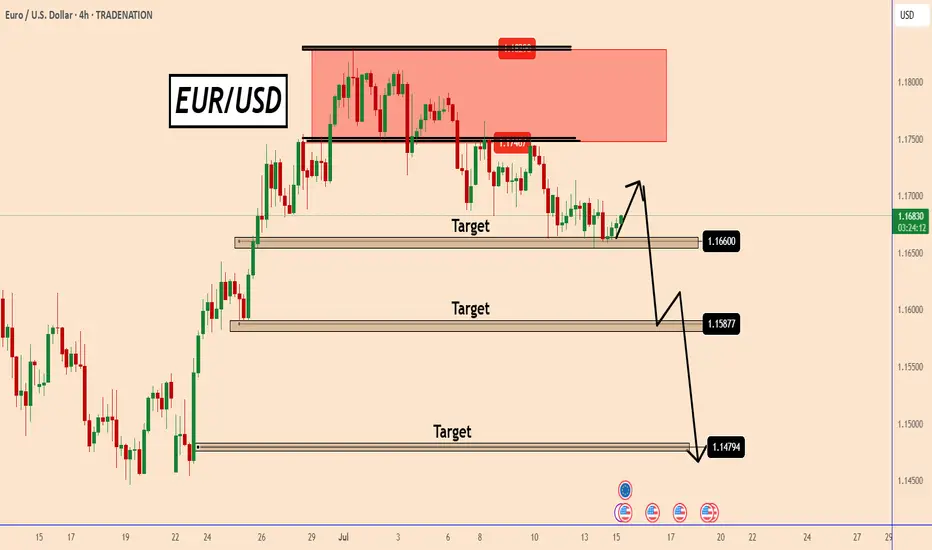
EURUSD - Parallel channel in play!The following chart offers a closer look at the current structure of the EUR/USD pair on the 4-hour timeframe. Price action has been respecting a well-defined bearish parallel channel, which has provided clear boundaries for both resistance and support. Based on the ongoing reaction to these levels, we outline both bullish and bearish scenarios that could unfold in the coming sessions.
Bearish Parallel Channel
Since June 30, EUR/USD has been consistently moving within a downward-sloping bearish parallel channel. Each attempt to break above the upper boundary of the channel has been rejected, while the lower boundary continues to act as dynamic support. This sustained rejection from the upper trendline confirms the strength of the bearish momentum currently at play. The pair remains structurally weak unless a clean breakout to the upside occurs, accompanied by strong bullish confirmation.
Bullish Scenario
A potential bullish reversal could materialize if EUR/USD manages to hold above the 4-hour Fair Value Gap (FVG) located between 1.1620 and 1.1600. This zone may provide the necessary support for the bulls to step in. If the price maintains strength within or just above this FVG and buyers begin to show dominance, a rebound toward the upper boundary of the channel could occur. A successful breakout above the channel could then trigger a stronger rally, possibly targeting the 1.1750–1.1800 region, marking a clear shift in short-term momentum.
Bearish Scenario
Conversely, if the pair fails to hold the 4-hour FVG between 1.1620 and 1.1600 and closes a strong bearish 4-hour candle below this zone, the market may be setting up for further downside. This would suggest a rejection of the FVG as resistance and open the path for a drop toward the lower end of the channel. Interestingly, this area also aligns with a previously established larger 4-hour FVG. A move into this deeper FVG could present a more favorable zone for a longer-term bullish reversal, as it offers a stronger liquidity pool and potential demand area.
Final Thoughts
The EUR/USD pair is at a critical juncture. Price is hovering near a key support zone within a bearish channel that has defined its movement for several weeks. Whether bulls can hold this support and break above the channel, or bears take control and push it lower toward the broader 4-hour FVG, will determine the next major directional move. Traders should closely monitor price action around the 1.1620–1.1600 level for clues on the likely breakout direction.
--------------------------
Disclosure: I am part of Trade Nation's Influencer program and receive a monthly fee for using their TradingView charts in my analysis.
Thanks for your support. If you enjoyed this analysis, make sure to follow me so you don't miss the next one. And if you found it helpful, feel free to drop a like and leave a comment, I’d love to hear your thoughts!

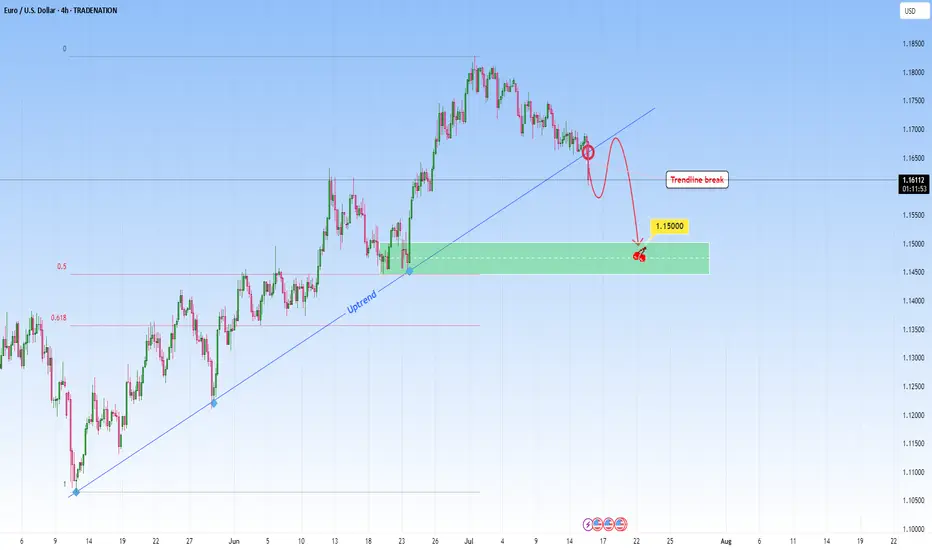
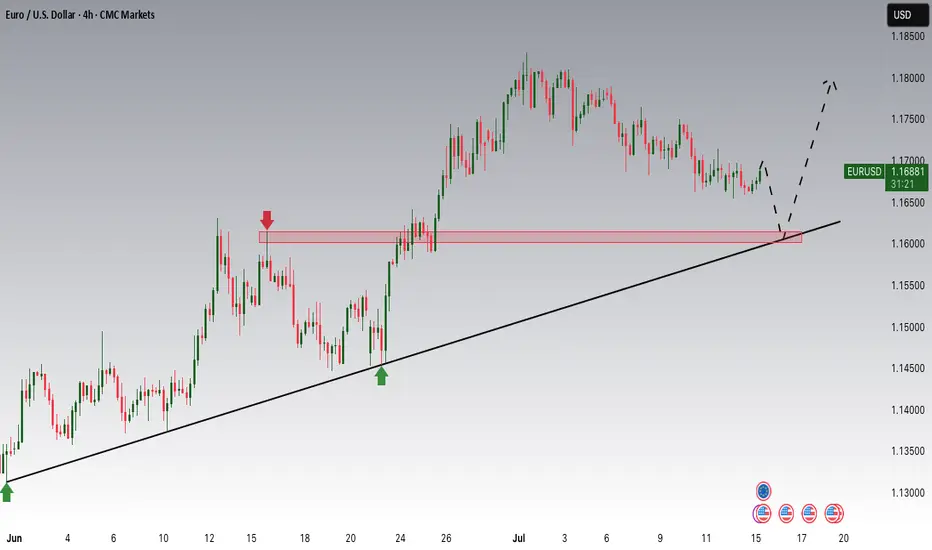
EURUSD: Sell Opportunity after Trendline breakEURUSD was in a steep uptrend but it might stop with this recent break through the uptrend. A break like this one on a strong trendline that had multiple touches, indicates either a potential reversal or major pause in the trend. This candle that broke the trendline signals the first hint of structural change.
I will be waiting for a retest and look to get involved in a short setup.
Ideally, what I look for in retests is to be met with a confirming candle. This would confirm the sellers have taken over and validate the change from uptrend to potential downtrend or consolidation phase.
My target would be around 1.1500.
Just sharing my thoughts for the charts, this isn’t financial advice. Always confirm your setups and manage your risk properly.
Disclosure: I am part of Trade Nation's Influencer program and receive a monthly fee for using their TradingView charts in my analysis .
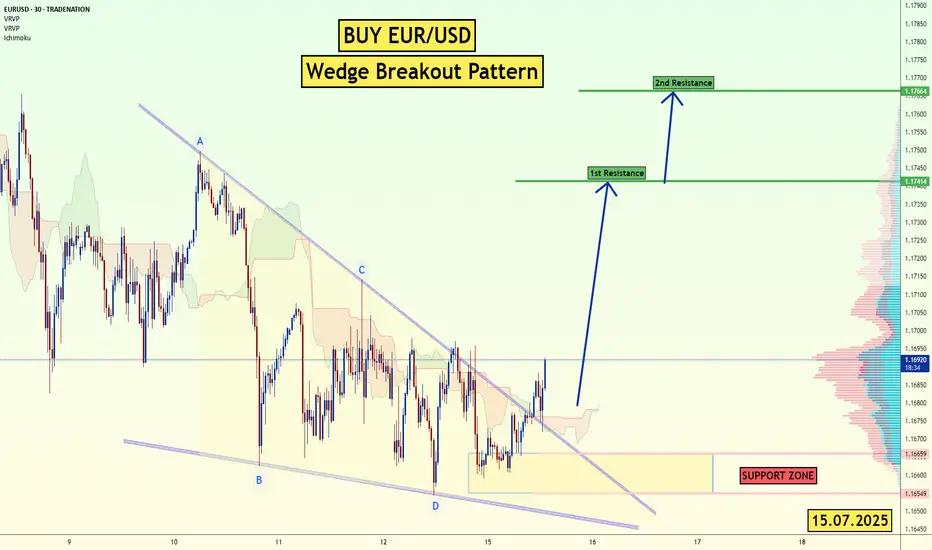
EUR/USD - Wedge Breakout (CPI- Today) 15.07.2025 The EUR/USD pair on the M30 timeframe presents a Potential Buying Opportunity due to a recent Formation of a Wedge Breakout Pattern. This suggests a shift in momentum towards the upside and a higher likelihood of further advances in the coming hours.
Possible Long Trade:
Entry: Consider Entering A Long Position around Trendline Of The Pattern.
Target Levels:
1st Resistance – 1.1741
2nd Resistance – 1.1766
🎁 Please hit the like button and
🎁 Leave a comment to support for My Post !
Your likes and comments are incredibly motivating and will encourage me to share more analysis with you.
Best Regards, KABHI_TA_TRADING
Thank you.
Disclosure: I am part of Trade Nation's Influencer program and receive a monthly fee for using their TradingView charts in my analysis.
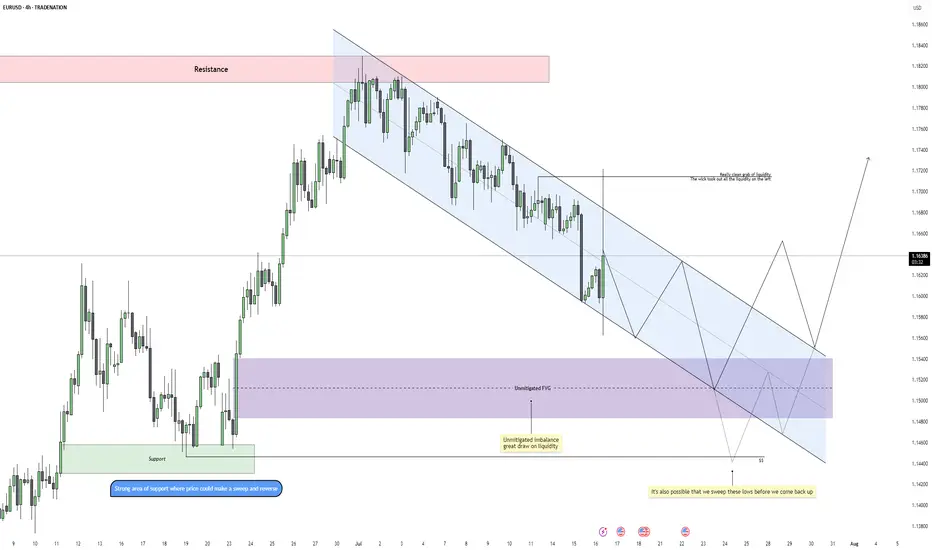
EURUSD – Bearish Rhythm ContinuesEURUSD is currently moving within a well-defined descending channel on the 4H timeframe, maintaining a consistent pattern of lower highs and lower lows. This confirms that bearish order flow remains intact, especially after the recent rejection from the upper boundary of the channel. The previous move up was largely a liquidity grab, taking out short-term highs before swiftly reversing, which adds confluence to a continuation lower.
Liquidity and Imbalance Zones
After sweeping some upside liquidity near 1.1670, price left behind a clean set of equal lows and an unmitigated fair value gap (FVG) sitting below, acting as a magnet. The purple zone marks this FVG, which is likely to be the next area of interest for price as it aligns with the midpoint of the channel and previous demand. Below that, there’s also a clear support region with resting liquidity, giving price a solid reason to reach deeper before reversing.
Projected Path and Channel Dynamics
As long as we remain inside the current bearish channel, we should expect price to respect the internal structure and continue pushing lower. The expectation is for price to trickle down through lower highs and lower lows, tapping into the FVG and potentially sweeping the lows beneath it. The projected internal path mimics this staircase-style movement down before any potential reversal can happen.
Reversal Zone and Bullish Scenario
If price does sweep the lows around 1.1450 and fills the imbalance cleanly, this would create ideal conditions for a bullish reversal. A reaction from this zone could lead to a break of the channel structure, initiating a shift in market sentiment. The upside target, in that case, would be the clean area around 1.1700 where previous liquidity was removed but not yet retested.
Short-Term Expectation
In the short term, the path of least resistance remains bearish. The most probable scenario is a continuation down into the FVG and potential liquidity sweep before we see any meaningful upside. Any premature breakout from the channel without first collecting this liquidity would be viewed as a weak move lacking proper fuel.
Conclusion
EURUSD remains technically bearish while inside the descending channel. Liquidity has been taken on the upside, and the path is now open to target unmitigated imbalances and resting lows. A full sweep into the FVG area could provide the setup for a clean reversal, but until then, trend continuation is favored.
Disclosure: I am part of Trade Nation's Influencer program and receive a monthly fee for using their TradingView charts in my analysis.
___________________________________
Thanks for your support!
If you found this idea helpful or learned something new, drop a like 👍 and leave a comment, I’d love to hear your thoughts! 🚀
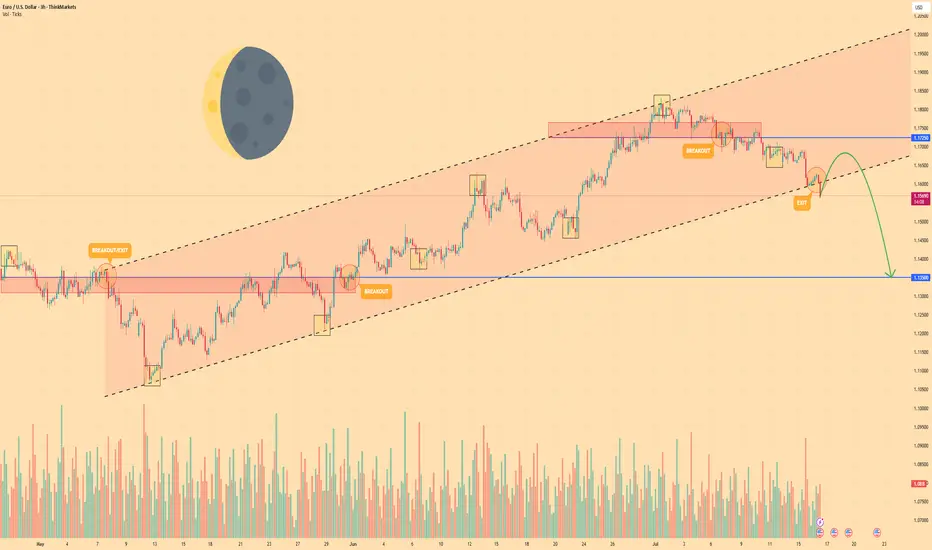
Euro may fall to support area and then start to growHello traders, I want share with you my opinion about Euro. The price previously moved inside a wedge formation, where it tested the buyer zone and showed a strong reaction from this area. After that, the pair broke out upward and started to trade inside an upward channel, building momentum and forming a clear bullish structure. Later, the price created a pennant pattern, often considered a continuation signal. But before continuing the upward trend, I expect the Euro to first exit from the pennant and decline toward the support area. This zone was previously resistantce, and now it may turn into a strong support. Now the price is trading near the pennant resistance, but I don’t expect a breakout right away. The market needs to correct before it resumes the uptrend. Once the price reaches the current support level or slightly lower, it may find demand again and bounce. That’s why I expect the Euro to retest the support zone and then grow further toward TP 1 - 1.1850 points. This target aligns with the upper border of the upward channel and would complete the continuation move after the pennant breakout. Given the previous structure, bullish momentum, and patterns on the chart, I remain bullish after the correction and expect the price to rise from the support zone. Please share this idea with your friends and click Boost 🚀
Disclaimer: As part of ThinkMarkets’ Influencer Program, I am sponsored to share and publish their charts in my analysis.

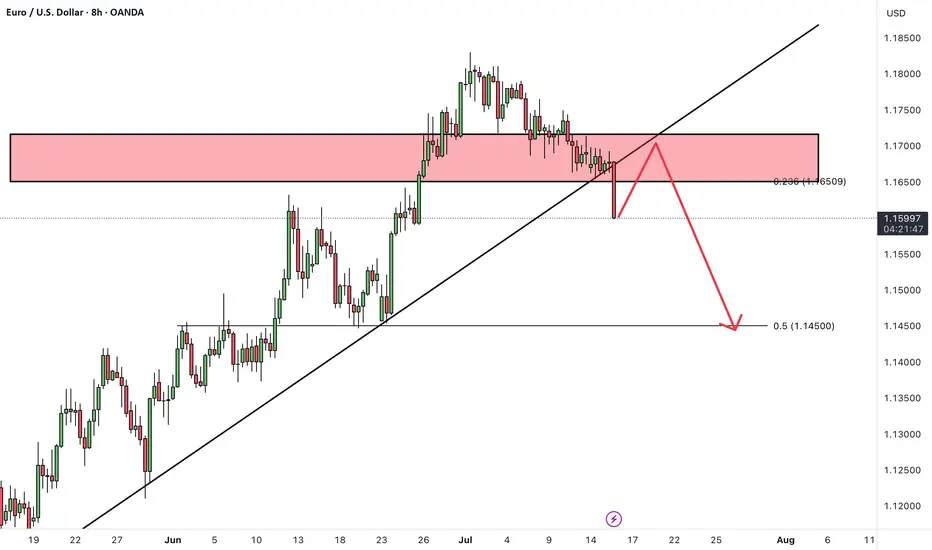
EURO - Price can continue to decline in falling channelHi guys, this is my overview for EURUSD, feel free to check it and write your feedback in comments👊
For a long time, the price was moving within a large ascending wedge, showing a gradual upward trend.
However, buyers failed to maintain momentum, and the price made a decisive breakout below the wedge's support line.
Following the breakout, the instrument established a new structure, a local falling channel, and has been trading within its boundaries since.
Currently, the price is in a corrective upward move, approaching the key resistance area of $1.1630 - $1.1660.
This zone is significant as it aligns with a previous support level and the upper boundary of the current falling channel.
I expect that the price will face rejection from this resistance area and will then continue its decline towards the channel's support line, targeting the $1.1465 level.
If this post is useful to you, you can support me with like/boost and advice in comments❤️
Disclaimer: As part of ThinkMarkets’ Influencer Program, I am sponsored to share and publish their charts in my analysis.

EURUSD: Consolidation Phase Nearing the Main Trend!!Hey Traders, in today's trading session we are monitoring EURUSD for a buying opportunity around 1.16100 zone, EURUSD is trading in an uptrend and currently is in a correction phase in which it is approaching the trend at 1.16100 support and resistance area.
Trade safe, Joe.
123 Quick Learn Trading Tips - Tip #7 - The Dual Power of Math123 Quick Learn Trading Tips - Tip #7
The Dual Power of Math: Logic for Analysis, Willpower for Victory
✅ An ideal trader is a mix of a sharp analyst and a tough fighter .
To succeed in the financial markets, you need both logical decision-making and the willpower to stay on track.
Mathematics is the perfect gym to develop both of these key skills at the same time.
From a logical standpoint, math turns your mind into a powerful analysis tool. It teaches you how to break down complex problems into smaller parts, recognize patterns, and build your trading strategies with step-by-step thinking.
This is the exact skill you need to deeply understand probabilities and accurately calculate risk-to-reward ratios. 🧠
But the power of math doesn't end with logic. Wrestling with a difficult problem and not giving up builds a steel-like fighting spirit. This mental strength helps you stay calm during drawdowns and stick to your trading plan.
"Analyze with the precision of a mathematician and trade with the fighting spirit of a mathematician 👨🏻🎓,
not with the excitement of a gambler 🎲. "
Navid Jafarian
Every tip is a step towards becoming a more disciplined trader.
Look forward to the next one! 🌟
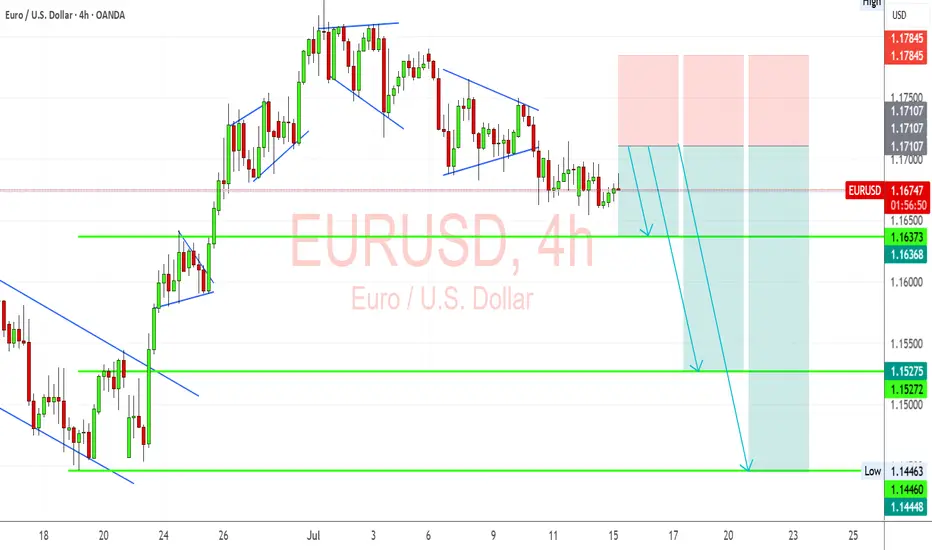
EURUSD Bearish Ahead as US Resilience Meets Eurozone FragilityEURUSD has shifted into bearish territory, pressured by growing divergence between a resilient US economy and a struggling Eurozone. The pair recently rejected the 1.1700 zone, forming multiple bearish structures on the 4H chart. With sticky US inflation, Trump’s renewed tariff agenda, and a dovish ECB, EUR/USD appears poised for a deeper move toward 1.1527 and possibly 1.1445 in the coming sessions. This setup is both technically and fundamentally aligned, but key event risk remains.
🔸 Technical Structure (4H)
Clear rejection from the 1.1700–1.1710 zone.
Bearish pennants and wedge patterns confirm continuation lower.
Downside targets:
🔹 First: 1.1637
🔹 Second: 1.1527
🔹 Final: 1.1445
Risk zone: Above 1.1785 (invalidates short bias if broken cleanly).
🧭 Key Fundamentals
🇺🇸 Dollar Strength: Sticky inflation, stable labor market, and geopolitical risk all favor USD demand.
🇪🇺 Euro Weakness: ECB dovish tone persists amid weak data, soft PMIs, and stagnating growth.
Yield Spread: US-Euro real yield spread supports further EUR/USD downside.
Tariff Pressure: Trump’s 50% tariff plan and tensions with the EU weigh on EUR.
⚠️ Risks to Watch
A surprise dovish pivot from the Fed.
Weak US CPI or disappointing retail sales.
Major risk-on flows that trigger broad USD weakness.
New EU fiscal stimulus or Germany/France recovery surprises.
📆 Key Events Ahead
🇺🇸 US Core CPI – A hot print supports USD strength.
🇺🇸 Retail Sales & Powell testimony – Watch tone on rate cuts.
🇪🇺 German ZEW Sentiment, Eurozone HICP inflation – Weak readings would further drag EUR.
🔄 Leader or Lagger?
EUR/USD is a lagger to GBP/USD, often following UK-driven USD moves.
Acts as a leader for EUR/JPY, EUR/AUD, EUR/CHF – weakness here cascades across EUR crosses.
Tracks broad USD sentiment – dovish Fed pricing boosts EURUSD, while rate hike fears drag it.
✅ Summary: Bias and Watchpoints
EUR/USD is bearish below 1.1700 as economic divergence, sticky US inflation, and rising geopolitical tensions favor the dollar. ECB policy remains soft, offering little support to the euro. Key risk lies in a dovish Fed pivot or softer US data. Watch US CPI and Powell for clues. This pair is likely to lag GBP/USD moves, but will lead EUR crosses lower if the downside momentum continues.
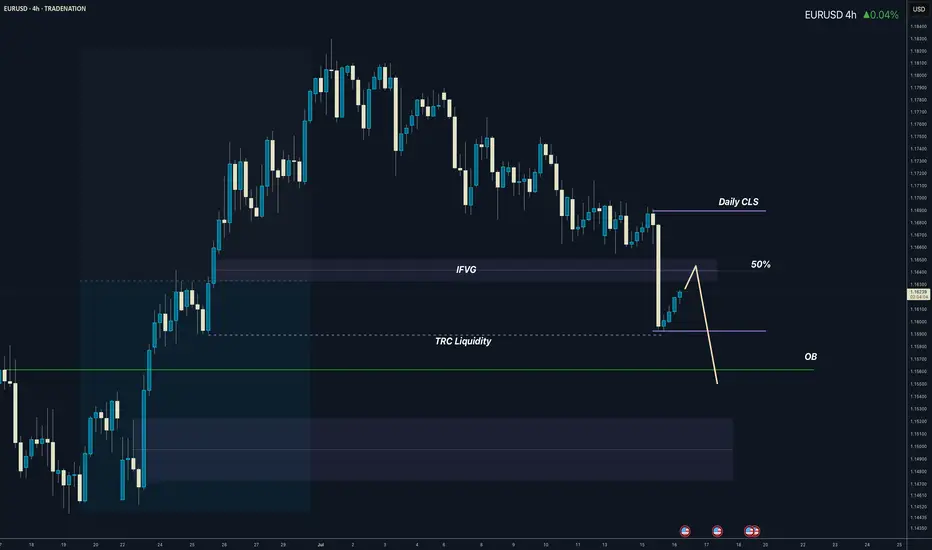
Daily CLS I Model O I CLS low will be visited...Yo Market Warriors ⚔️
Fresh outlook drop — if you’ve been riding with me, you already know:
🎯My system is 100% mechanical. No emotions. No trend lines. No subjective guessing. Just precision, structure, and sniper entries.
🧠 What’s CLS?
It’s the real smart money. The invisible hand behind $7T/day — banks, algos, central players.
📍Model 1:
HTF bias based on the daily and weekly candles closes,
Wait for CLS candle to be created and manipulated. Switch to correct LTF and spot CIOD. Enter and target 50% of the CLS candle.
For high probability include Dealing Ranges, Weekly Profiles and CLS Timing.
Analysis done on the Tradenation Charts
Disclosure: I am part of Trade Nation's Influencer program and receive a monthly fee for using their TradingView charts in my analysis.
Trading is like a sport. If you consistently practice you can learn it.
“Adapt what is useful. Reject whats useless and add whats is specifically yours.”
David Perk aka Dave FX Hunter
💬 Comment with requests for analysis, just post instrument. I will answer with my opinion.
EURUSD will continue to growIt is clear that EUR has broken through the support line, but I don't think the fall will continue. I expect growth to 1.19

#EURUSD: Still Extremely Bullish! Let's see how it goes! EURUSD is currently making minor correction and it is likely to reverse in coming days. We have to area from where price could reverse from. we advise you to read the chart and also do your analysis before making any decision.
Like and Comment For More!
Team Setupsfx_

Hellena | EUR/USD (4H): LONG to the resistance area 1.18280.The previous idea was aimed at updating the maximum of 1.18280, but the correction turned out to be too deep.
Therefore, I am proposing a new idea. I believe that wave “3” has formed, and now we should see the completion of the correction in wave “4,” after which I expect to see an upward movement in wave “5.” My target is at least the high of wave “3” — the resistance area of 1.18280.
As for the correction, I think it could reach the 1.15459 area, but I recommend working with pending orders.
Manage your capital correctly and competently! Only enter trades based on reliable patterns!

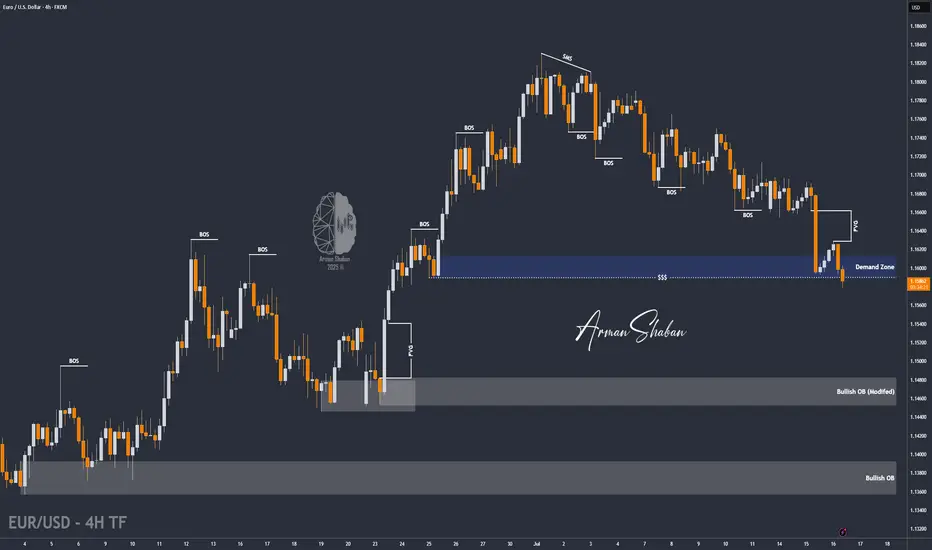
EURUSD: The Logic of Institutional Capital UnveiledThe trend is your friend... until it isn't. While EURUSD remains in a clear global uptrend, the short-term picture is far more deceptive. Before you jump into a long position, it's crucial to understand the bearish order flow that has taken control on the 4H chart.
This idea isn't about fighting the trend, but about having the patience to join it at the right, high-probability moment. Let's dive in.
The most liquid forex asset, EURUSD , continues its global uptrend as long as the price does not close decisively below the daily structure's BOS level at 1.14458. On its ascent, the pair met resistance from a monthly supply zone , from which it began a daily structure correction. This correction was paused by a demand zone and the 61.8% Fib level.
While this might seem like a sufficient support point to consider long positions, let's look at the context on the 4H structure to see why I believe the correction will go deeper.
The 4H structure shows a clear bearish order flow that began from the aforementioned monthly supply zone. We see this order flow manifest as the price consecutively rejects from order blocks #1 and #2 ( they have fulfilled their role and should no longer be considered — any manipulation zone becomes deactivated after its first mitigation ). It would have seemed logical for the price to then reject from OB #3 , where I was personally expecting a counter-trend short trade upon its mitigation, especially after the 4H structure had broken down (BOS 4H).
However, the price doesn't always behave as we expect ; it dropped to the demand zone, leaving behind a 4H FVG. This left OB #3 still technically valid. But the sharp squeeze on July 16th reached the 4H FVG, rebalancing it and thus invalidating OB #3 as a Point of Interest (POI) for large capital. This is because the price was already delivered close to it, and with a high probability, the "Whale" closed its losing hedged long positions there, having no reason to return the price. The sharp upward squeeze on July 16th also served to sweep liquidity from the high marked with an 'x'.
These two factors — the FVG mitigation and the liquidity sweep — confirmed the continuation of the bearish order flow and indicated that the price is likely to continue its corrective move towards the next support levels. Let's examine them in more detail.
~~~~~~~~~~~~~~~~~~~~~~~~~~~~~~~~~~~~~~~~~~~~~~~~~~~~~~~~~~~~~~~~~
Two Potential Long Scenarios
SCENARIO 1: Entry from the Daily Order Block
The first level for a potential reversal is the 78.6% Fibonacci retracement level from the daily structure, in conjunction with a daily order block .
► Setup Condition: Price must reach this level, mitigate the order block, and hold above the 78.6% Fib level. An entry will require LTF confirmation (a BOS or the beginning of LTF order flow).
► Invalidation: A break of the 78.6% level with the price closing below it.
Note: I consider the scenario of breaking this level quite probable due to the weakness of this daily order block — it did not sweep any liquidity when it was formed. Thus, it may itself act as liquidity, activating the second long scenario.
SCENARIO 2: Entry after a Deeper Liquidity Sweep
This scenario becomes valid if the first one fails.
► Setup Condition: A liquidity sweep below the daily structure's break level (BOS D) , which simultaneously corresponds to reaching the 50% Fib level from the weekly structure . This confluence strongly reinforces the setup if this level (at 1.14480) holds. Since this is a weekly level, it must not be broken by the bodies of daily candles closing below it.
► Invalidation: A daily candle close below this level. In that case, we can confidently assume that the uptrend is changing and start looking for short positions.
~~~~~~~~~~~~~~~~~~~~~~~~~~~~~~~~~~~~~~~~~~~~~~~~~~~~~~~~~~~~~~~~~
The principles and conditions for forming the manipulation zones I show in this trade idea are detailed in my educational publication, which was chosen by TradingView for the "Editor's Picks" category and received a huge amount of positive feedback from this wonderful, advanced TV community. To better understand the logic I've used here and the general principles of price movement in most markets from the perspective of institutional capital, I highly recommend checking out this guide if you haven't already. 👇
P.S. This is not a prediction of the exact price direction. It is a description of high-probability setups that become valid only if specific conditions are met when the price reaches the marked POI. If the conditions are not met, the setups are invalid. No setup has a 100% success rate, so if you decide to use this trade idea, always use a stop-loss and proper risk management. Trade smart.
~~~~~~~~~~~~~~~~~~~~~~~~~~~~~~~~~~~~~~~~~~~~~~~~~~~~~~~~~~~~~~~~~
If you found this analysis helpful, support it with a Boost! 🚀
Have a question or your own view on this idea? Share it in the comments. 💬
► Follow me on TradingView to get real-time updates on THIS idea (entry, targets & live trade management) and not to miss my next detailed breakdown.
~~~~~~~~~~~~~~~~~~~~~~~~~~~~~~~~~~~~~~~~~~~~~~~~~~~~~~~~~~~~~~~~~

EURO - Price may drop to $1.1350 support level Hi guys, this is my overview for EURUSD, feel free to check it and write your feedback in comments👊
Euro began its journey by breaking into a rising channel off the swing low near $1.1080, establishing a clear uptrend.
Within this channel, price carved out steady support along the lower trendline, touching $1.1350 before buyers stepped.
Mid-channel, two breakout attempts at $1.1550 and $1.1725 highlighted bullish conviction, yet both retreated back below resistance.
Simultaneously, two exit signals appeared near the upper trendline around $1.1765, showing that upward momentum was losing steam at key inflection points.
Currently, EUR is holding just below the channel base after a minor bounce, consolidating as traders weigh the next move.
I foresee a brief climb toward near $1.1670 before a renewed bearish thrust drives price back down to test $1.1350 level.
If this post is useful to you, you can support me with like/boost and advice in comments❤️
Disclaimer: As part of ThinkMarkets’ Influencer Program, I am sponsored to share and publish their charts in my analysis.
EURUSD is Nearing an Important Support!!Hey Traders, in today's trading session we are monitoring EURUSD for a buying opportunity around 1.15400 zone, EURUSD is trading in an uptrend and currently is in a correction phase is in a correction phase in which it is approaching the trend at 1.15400 support and resistance area.
Trade safe, Joe.

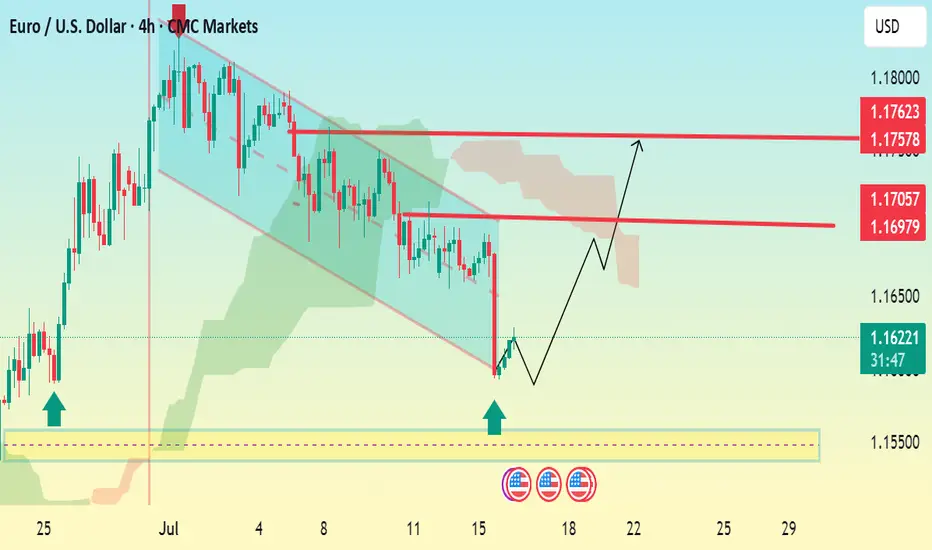
EUR/USD 4H Bullish Reversal Setup Analysis:The chart shows a falling wedge pattern, a typical bullish reversal signal.
Price has broken out of the wedge, suggesting a potential trend reversal to the upside.
Two strong demand zones (highlighted with blue arrows and yellow box) show strong buying pressure around 1.15500–1.15700.
The Ichimoku Cloud above indicates resistance, but a breakout above it would confirm continued bullish momentum.
Key Levels:
Current Price: 1.16171
Immediate Resistance: 1.16979
Next Targets (TP):
TP1: 1.17057
TP2: 1.17578
TP3: 1.17623
Support Zone: 1.15500 – 1.15700
Conclusion: If the price holds above the 1.15700 support zone and sustains momentum above the wedge breakout, expect bullish continuation toward 1.17500+. Ideal long setup on retracement with tight SL below 1.15500.
EUR/USD Flexing Strength- Is the Next Big Coming? EUR/USD Market Update – Bullish Setup at 1.16440
EUR/USD is trading around 1.16440, maintaining its bullish momentum in the current uptrend.
🔹 Current Price: 1.16440
🔹 Support Zone: 1.1600 – 1.1620
🔹 Resistance Zone: 1.1680 – 1.1700
🔹 Trend: Strong bullish structure with clear upward momentum
The pair is holding above key support and aiming for the next resistance at 1.1700. A breakout above this level could open the door to further upside. Traders watching for a retest near support or breakout entry above resistance.
🎯 Trading Plan:
Buy on dips above 1.1620 or wait for a confirmed breakout above 1.1680 with volume.
#EURUSD #ForexAnalysis #BullishSetup #ResistanceSupport #TechnicalAnalysis #PriceAction #TrendTrading #SmartTrader #FXSignals

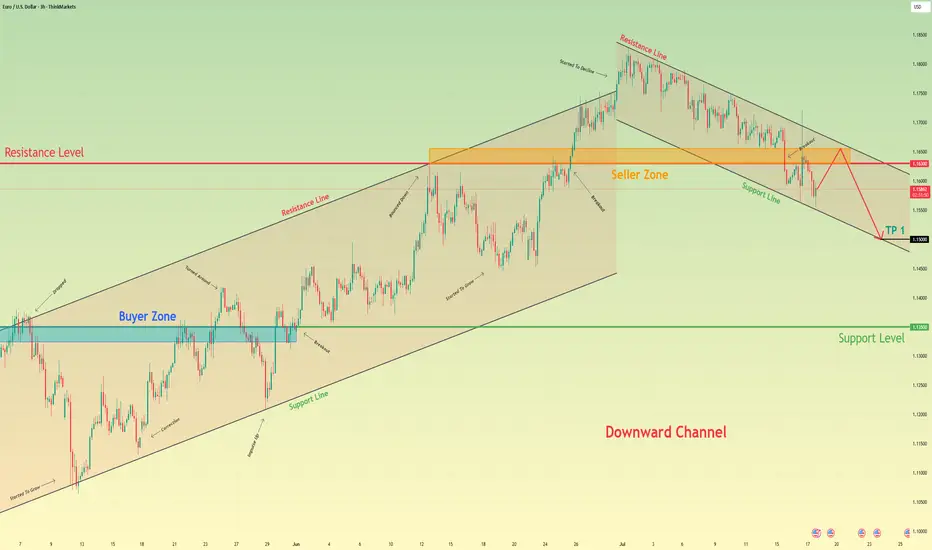
Euro may reach seller zone and then continue to fall in channelHello traders, I want share with you my opinion about Euro. The price pair has recently shifted its market structure, establishing a clear downward channel after breaking its previous uptrend. Before this breakdown, the price was consistently trading within an Upward Channel, repeatedly finding support in the buyer zone (1.1325–1.1350) and reversing upward. The bullish momentum eventually faded when the price failed to break the major horizontal resistance level at 1.1630. This failure triggered a strong bearish impulse, leading to a decisive breakout below the channel's support line and confirming a trend reversal. Currently, the price is making a corrective move up inside the newly formed downward channel, which appears to be a classic retest of the broken structure from below. I expect this upward move to stall as it approaches the heavy confluence of resistance formed by the channel's upper Resistance Line and the horizontal seller zone at 1.1630–1.1655. After testing this area, I anticipate a rejection and the beginning of a new bearish leg down. That's why I've set my TP at the 1.1500 level — it aligns perfectly with the support line of the current downward channel, making it a logical target for sellers. Please share this idea with your friends and click Boost 🚀
Disclaimer: As part of ThinkMarkets’ Influencer Program, I am sponsored to share and publish their charts in my analysis.
EURUSD: Bigger Bearish Move is PossibleEURUSD: Bigger Bearish Move is Possible
EURUSD is positioned to fall further from the bearish pattern it is showing. The market is hesitant to fall further after we get the CPI data today. The US is expected to report a growth of 2.7% vs. 2.4% last month.
The impact of the data is unclear in my opinion because the market is not paying much attention to the data, but it should definitely increase the market volume which is decreasing in these summer days.
You may find more details in the chart!
Thank you and Good Luck!
PS: Please support with a like or comment if you find this analysis useful for your trading day
Disclosure: I am part of Trade Nation's Influencer program and receive a monthly fee for using their TradingView charts in my analysis.
EUR/USD : Another Fall Ahead ? (READ THE CAPTION)By analyzing the EURUSD chart on the 4-hour timeframe, we can see that the price is currently breaking through the 1.16–1.158 zone. If it manages to hold below 1.159, we can expect further downside movement. The next targets for EURUSD are 1.15580, 1.154, and 1.148.
Please support me with your likes and comments to motivate me to share more analysis with you and share your opinion about the possible trend of this chart with me !
Best Regards , Arman Shaban