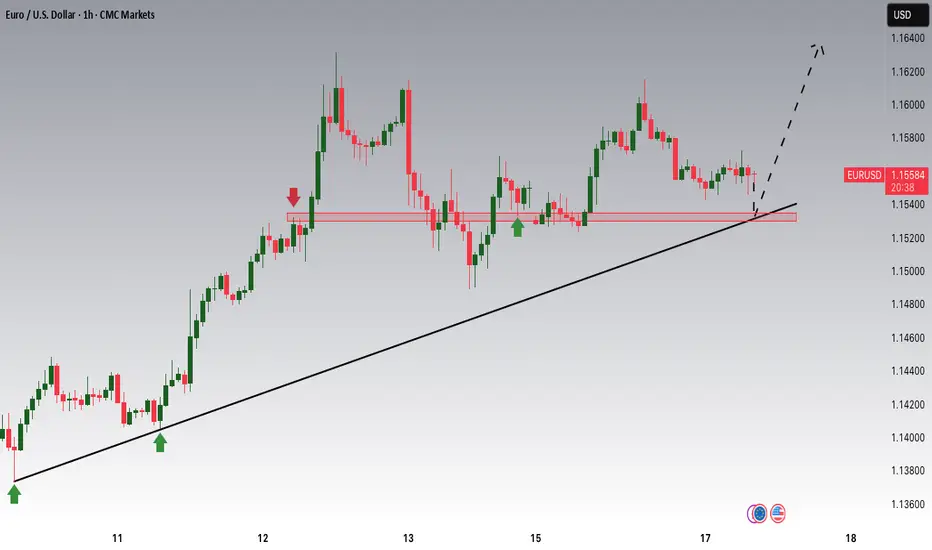
EURUSD Long Setup – Bullish Rejection from Demand ZoneEURUSD remains supported by strong eurozone fundamentals and broad USD softness. The pair has retraced into a key demand zone around 1.1490 and is showing signs of bullish rejection. With the Fed likely to pause further rate hikes and the ECB maintaining a steady tone, the bias favors further upside toward recent highs.
⚠️ Geopolitical tensions in the Middle East (Israel-Iran conflict) have introduced mild safe haven demand, but so far the USD has underperformed versus the euro, suggesting EUR remains relatively insulated.
Watch for confirmation and entries within the blue demand box.
🔍 Technical Analysis:
Structure: Clear uptrend with higher highs and higher lows. Price retraced to a well-defined 1H demand zone between 1.1490–1.1500.
Setup: Anticipating a bounce from the demand zone targeting the recent high near 1.1620–1.1630.
Entry Zone: 1.1490–1.1500 (bullish reaction area)
Target: 1.1620–1.1630 (previous supply zone)
Stop Loss: Below 1.1439 (recent swing low)
Risk-Reward Ratio: Approximately 1:2.5
🧠 Fundamental Context (as of June 16):
EUR Bias: Bullish – ECB has paused cuts; euro is resilient despite geopolitical headwinds.
USD Bias: Bearish – Fed is on pause; soft inflation data and geopolitical risks weigh on dollar strength.
Key Drivers:
Fed dovish tone (FOMC pause, lower CPI)
Strong EU resilience despite global tensions
CHF and JPY attracting safe haven flows over USD
📅 Key Events to Watch:
US Core PCE (next major inflation readout)
FOMC commentary and Fed speakers
Eurozone CPI and sentiment data
EURUSD trade ideas

EURUSD trades turn their eyes towards upcoming Fed Interest rateEUR/USD has been trading sideways after peaking above 1.1600 last week, as traders adopt a wait and see approach ahead of the Fed's interest rate decision due tomorrow morning (AEST). The pair is consolidating within a tight range, with the top end of the recent rally now being questioned amid growing uncertainty.
While the Fed is widely expected to leave its benchmark interest rate unchanged at 4.25%-4.50%, market participants will be closely watching for any revisions to the dot plot, as well as updates to the central bank's growth and inflation forecasts. The current projections suggest two rate cuts in 2025, but any deviation from that could trigger significant dollar volatility.
On the technical side, multi-year support near 1.1215 remains a critical level to watch on the downside. A break below could signal deeper bearish momentum.
Adding complexity to the EUR side of the equation are two key factors:
The ECB’s rate path, with the central bank seen approaching the end of its monetary easing cycle. Elevated geopolitical tensions, especially as Israel prepares further action against Tehran and the US weighs deeper involvement.
Any escalation in Middle East tensions could boost demand for safe-haven assets like the US dollar, potentially pressuring the euro further.
In the near term, EUR/USD remains in a holding pattern, with the Fed's tone and geopolitical developments likely to determine the next directional move.
"The forecasts provided herein are intended for informational purposes only and should not be construed as guarantees of future performance. This is an example only to enhance a consumer's understanding of the strategy being described above and is not to be taken as Blueberry Markets providing personal advice."

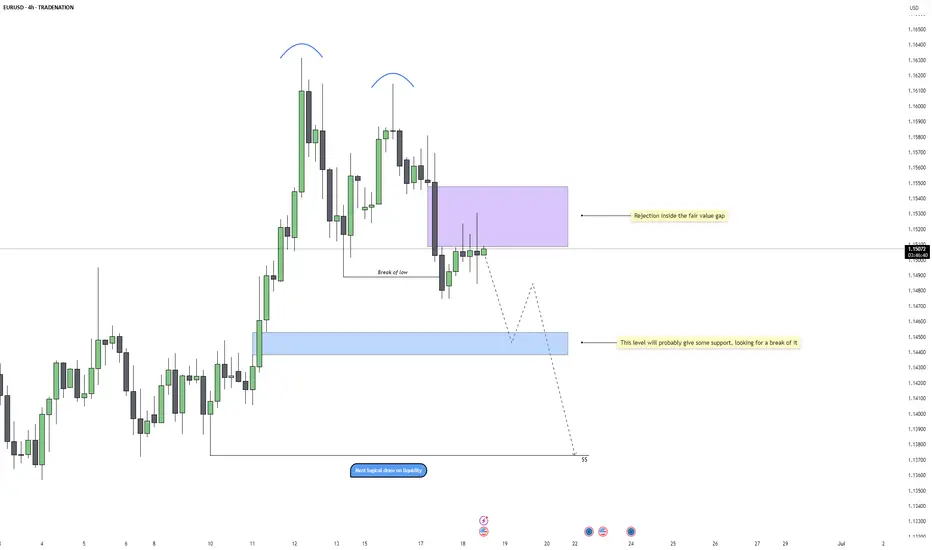
EURUSD - FVG Rejection and Bearish Continuation PlayEURUSD has been showing consistent bearish pressure on the 4H chart, with a clear shift in momentum after forming a double top near 1.162. That marked the beginning of a structural change, which was confirmed once price broke the most recent higher low. Since then, the market has transitioned into a bearish structure, with lower highs forming consecutively. This suggests that the bullish trend is over for now, and the market is more likely to seek liquidity below.
Rejection at Fair Value Gap
After the low was broken, price retraced back into a 4H fair value gap, which has now acted as resistance. This is typical smart money behavior, sweep liquidity, shift structure, then retest an imbalance before continuing lower. The wick rejection inside the purple FVG zone is a strong signal that this area is being respected and that sellers are defending it. The rejection aligns with the overall bearish market flow and suggests that the market has likely completed its retest.
Short-Term Support and Liquidity Target
The light blue FVG around 1.144 could offer temporary support, but the bias remains bearish. That level sits right at the midpoint of the recent bullish leg that was already violated, and while price may pause here, the more logical draw on liquidity sits deeper. Unless there’s a sudden shift in market structure or high-impact fundamental news, this area is expected to eventually give way.
Liquidity Below and Final Target
The cleanest and most obvious liquidity pool rests around the 1.137 zone. This is where price previously consolidated before initiating the impulsive move higher, and it remains unmitigated. If the current bearish structure holds, the market will likely target this area next. The path there might not be linear, we could see a short-term bounce off 1.144, but as long as price remains below the 1.153 FVG rejection, the bearish continuation remains valid.
Trade Expectation and Risk Context
This setup aligns well with typical displacement-retest-continuation behavior. The risk is clearly defined above the FVG rejection, and as long as lower highs continue forming beneath that zone, the bearish thesis remains intact. Key downside targets are 1.144 for partials, and 1.137 as the final draw on liquidity. This setup offers both precision and strong narrative confluence, ideal for swing or intraday positioning.
Conclusion
Price has shifted bearish on the 4H, confirmed by a break of structure and rejection from a clear FVG. As long as we remain below that imbalance, the market should continue hunting liquidity to the downside. 1.144 may act as short-term support, but the real magnet sits at 1.137. Patience and risk control will be key in riding this move effectively.
Disclosure: I am part of Trade Nation's Influencer program and receive a monthly fee for using their TradingView charts in my analysis.
___________________________________
Thanks for your support!
If you found this idea helpful or learned something new, drop a like 👍 and leave a comment, I’d love to hear your thoughts! 🚀
EUR/USD 4H CHART PATTERN.EUR/USD 4H chart, the chart analysis shows a bearish outlook after a potential rising channel breakdown. Here are the key bearish targets as shown:
---
📉 Bearish Targets:
1. First Target Zone (FVG Area)
Price Range: Around 1.1400 – 1.1350
This is marked as the Fair Value Gap (FVG) and could act as the first reaction/support zone.
2. Second Target Zone
Price Range: Around 1.1250 – 1.1200
Clearly labeled as “TARGET” in the middle of the chart.
3. Final Target Zone (Major Support)
Price Range: Around 1.1100 – 1.1050
Also labeled “TARGET” at the bottom. This aligns with a past support level and previous consolidation area.
---
🧭 Summary:
A breakdown from the rising channel is expected.
Price may drop first into the FVG zone (1.1350 area).
Then continue down to 1.1200.
Final support target sits near 1.1050.
Would you like me to help identify bullish invalidation or risk levels as well?

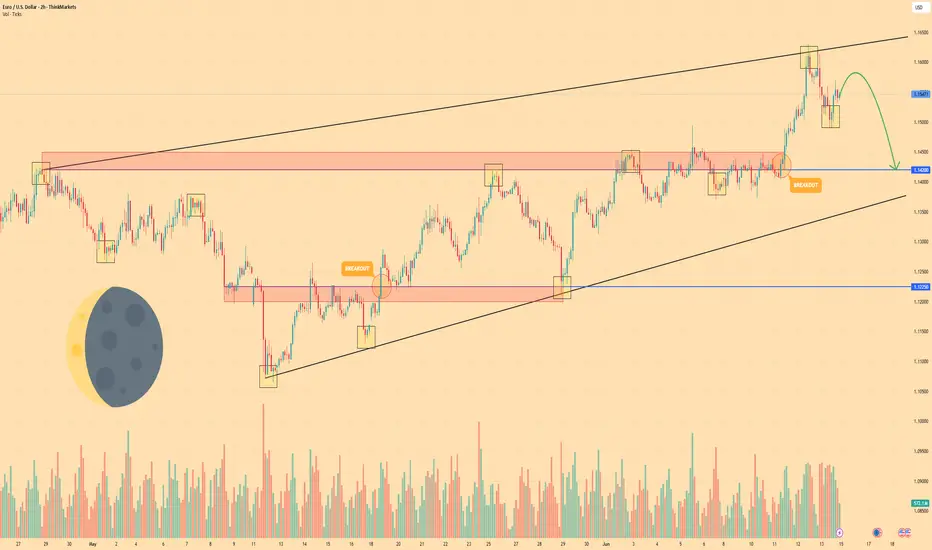
EURO - Pirce can make movement up and then drop to $1.1420Hi guys, this is my overview for EURUSD, feel free to check it and write your feedback in comments👊
After entering the wedge, Euro began to slow down, creating a tightening structure between support and resistance.
Price corrected toward the support line of the wedge, where it briefly paused and bounced with weak momentum.
The bounce triggered a breakout above local resistance, but buyers failed to hold the price at higher levels.
Soon after, the market reversed from the wedge’s upper boundary and began forming a bearish rejection pattern.
Now price trades just below the recent highs, showing fading demand and early signs of short-term reversal.
I expect Euro to move lower and reach the $1.1420 support level — my current target in this scenario.
If this post is useful to you, you can support me with like/boost and advice in comments❤️
Disclaimer: As part of ThinkMarkets’ Influencer Program, I am sponsored to share and publish their charts in my analysis.
#EURUSD:Expecting A Strong Bull Move, Two Entries | Two TargetsIn our previous analysis, we clearly stated that the price would remain bullish as the DXY had to plummet, and it did exactly that, rising by 450 pips from our last entry. Currently, we have two areas from which we can see the price reversing. The first one is nearby and has a higher risk compared to our second entry, which may be safer for some traders. We need a strong confirmation before making any significant decisions.
Good luck and trade safely. We wish you the best in your trading journey.
Team Setupsfx_

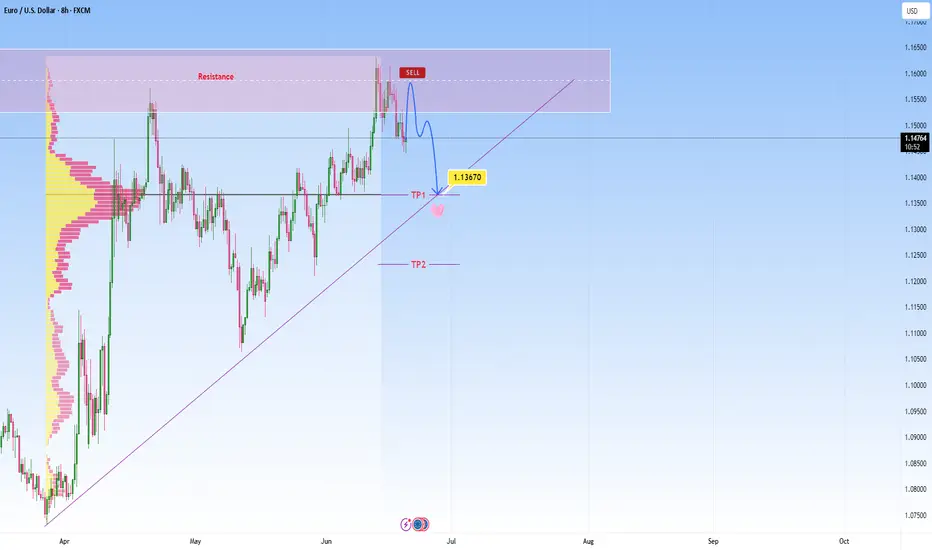
EURUSD heads towards resistance, short-term reversal expectedEURUSD has been in a strong uptrend, and we’re currently observing price action is reaching a notable resistance zone. I am watching for a reversal here as marked on my chart, not expecting a major move, but rather a short-term rejection with a downside target at around 1.13670 , which also aligns with the POC.
This is where it can become a decision point, either price finds support and bounces, or it breaks below, and that’s when we might see the move start to extend lower.
If we get a decisive breakdown through that ascending trendline, my next area of interest is marked as TP2. From there we can expect either potential accumulation or another reaction, depending on broader market sentiment at the time.
That said, we're navigating a complex backdrop currently:
The EU macro environment is under pressure, as weak economic data from Europe is contributing to cautious sentiment around the euro.
Meanwhile, a sustained USD bid continues, supported by stronger U.S. growth expectations, favorable yields, and persistent global demand. This further weighs on EURUSD.
Adding to the uncertainty, escalating tensions between Israel and Iran have rattled markets this week. This geopolitical risk could be pushing oil prices higher:
It’s important to note that if price convincingly rejects here and loses structure, especially with high volume and obvious bullish structure, this setup would become invalid. In that case, I would reassess and adapt
EURUSD: Bullish Move After BreakoutThe price action on EURUSD shows that it broke through a horizontal resistance level on the 4-hour chart.
Following the breakout, a local correction occurred, forming a bullish flag pattern.
As the NY session opened, the market rose and surpassed its resistance line, indicating a strong likelihood of continued upward movement.
The target is set at 1.1616.

EUR/USD.1h chart pattern.Based on My target EUR/USD 1H, the price has broken down from the ascending channel and formed a Double Top, confirming a bearish structure. Here's the analysis based on the marked zones:
Bearish Targets:
1. First Support / Target 1: Around 1.13500
This aligns with a previous structure level and is the first potential bounce zone.
2. Second Support / Target 2: Around 1.12000
This is a deeper support zone where price may head if the bearish momentum continues.
The structure also shows a clear CHoCH (Change of Character) which supports the downside bias.
Let me know if you want entry and stop-loss suggestions for this setup.

Euro can turn around and start to fall to support areaHello traders, I want share with you my opinion about Euro. Observing this chart, we can see how the price earlier dropped toward the 1.1360 support level and successfully broke it. Then we saw a short recovery move, but the price once again returned to the downside and retested the support line from below. After that, the market created a strong upward impulse, broke back above the 1.1360 level, and entered a phase of consolidation inside a range. This range held for some time, with price respecting both its upper and lower boundaries. Eventually, we saw a breakout from this consolidation, followed by another strong bullish impulse and a steady climb above the 1.1530 zone, where price is currently trading. However, the price has now approached a critical structure and is showing signs of weakening momentum. In my mind, the Euro may attempt one more small move up but then turn around and start declining toward the 1.1530 support level, breaking the ascending support line as well. That's why my TP is this support level, which coincides with the support area. Please share this idea with your friends and click Boost 🚀
Disclaimer: As part of ThinkMarkets’ Influencer Program, I am sponsored to share and publish their charts in my analysis.

EUR/USD - Eyes on the major resistance at 1.1540!Introduction
The EUR/USD currency pair has been trending downward on the 1-hour timeframe, indicating that bearish momentum is firmly in control. In this analysis, I will outline what to expect from the pair moving forward, and highlight the high-confluence zone that could offer a potential short setup. This area combines technical factors that suggest it may act as strong resistance if price retraces upward before continuing the downtrend.
Market Structure
On the 1-hour chart, the EUR/USD continues to form a series of lower highs and lower lows, which clearly confirms a bearish market structure. This consistent pattern reinforces that sellers have the upper hand, and that any short-term rallies are likely to be corrective in nature, not trend-changing. As long as this structure remains intact, the broader expectation remains bearish, with sellers likely to defend key resistance levels.
Fair Value Gaps on the 15-Minute and 1-Hour Timeframes
During the latest downward movement, the pair left behind two notable Fair Value Gaps, one on the 1-hour chart and another on the 15-minute chart. These imbalances are closely aligned, creating a strong confluence zone where price may face resistance if it moves back upward. The zone between 1.15400 and 1.15600 represents this overlapping FVG area. Because these gaps were formed by aggressive selling pressure, revisiting this level could trigger a bearish reaction, as traders look to re-enter short positions from a premium price.
Golden Pocket Fibonacci Retracement
Adding to this confluence, the Golden Pocket, the area between the 61.8% and 65% Fibonacci retracement levels, lies between 1.15407 and 1.15441. This zone is widely respected among traders due to its tendency to act as a reversal point in trending markets. The fact that it aligns so closely with both the 15-minute and 1-hour FVGs increases the likelihood of price reacting here. If the market retraces into this pocket, we could see renewed selling pressure, making it a valuable level to watch for short entries.
Point of Interest and Liquidity Zone
Within the latest leg down, there was a brief two-hour consolidation before the pair continued lower, leaving behind a distinct wick to the upside. This area is significant because it likely represents a point of interest where buy-side liquidity was grabbed. Many traders who entered shorts early may have placed their stop-losses above this consolidation high, creating a liquidity pool. This level, sitting inside the broader resistance zone formed by the FVGs and the Golden Pocket, adds another layer of technical significance. Price may move into this liquidity before reversing lower, offering a potential trap for buyers and an opportunity for sellers.
Downside Targets
If the price reacts to the resistance zone and resumes its downward movement, there are two logical targets to the downside. The first is 1.1485, which corresponds to the most recent swing low. The second target is 1.1475, which represents a deeper low and a stronger potential support level. These levels align with previous structure and could serve as key take-profit zones for traders holding short positions.
Conclusion
The EUR/USD remains in a well-defined downtrend, and several technical elements now converge between 1.15400 and 1.15600 to form a strong resistance zone. This area includes the 15-minute Fair Value Gap, the 1-hour Fair Value Gap, the Golden Pocket Fibonacci retracement, and a significant point of interest tied to liquidity. While the pair may not need to reach this zone before continuing lower, if it does, it is likely to act as a barrier to further upside. For traders looking to follow the dominant trend, this high-confluence area offers a potential entry point to the downside, with clear structure-based targets below.
Disclosure: I am part of Trade Nation's Influencer program and receive a monthly fee for using their TradingView charts in my analysis.
Thanks for your support.
- Make sure to follow me so you don't miss out on the next analysis!
- Drop a like and leave a comment!

EURUSD H2 Best Levels to BUY/SELL and Market Update🏆 EURUSD Market Update m20 short-term trade
📊 Technical Outlook
🔸Short-term: BEARS 1275
🔸1500/1540 short sell rips/rallies
🔸Mid-Term outlook: BULLS 1750
🔸bulls buy low 1250/1275 reload
🔸bulls exit at 1750 swing trade
🔸Price Target Bears: 1250/1275
🔸Price Target Bulls: 1750
🌍 Macro & Political Drivers
U.S. tax & spending concerns: The Congressional Budget Office now projects President Trump's tax‑and‑spending bill will raise deficits by about $2.8 trillion over the next decade. This massive debt addition is pressuring the U.S. dollar, as rising Treasury issuance and weaker fiscal confidence weigh on demand.
Geopolitical tensions: Escalation in the Israel–Iran conflict is pushing investors toward the safe-haven U.S. dollar. The DXY jumped to around 98.80 as President Trump’s remarks on Iran sent the EUR/USD down to approximately 1.1484.
EU developments: ECB officials, including Christine Lagarde, are doubling down on strengthening Europe’s financial infrastructure to elevate the euro as a viable alternative to the dollar — calling this a “global euro moment.”
Key resistance is around 1.1550–1.1575; downside support zones near 1.1450 and broader range 1.1360–1.1420 remain intact, though current levels suggest consolidation above the lower range. Strength from safe-haven flows could stall upward momentum.
📊 ECB Policy & Inflation Signals
The ECB cut rates by 25 bp last week to 2.0%, reinforcing the message that inflation remains subdued (1.9% in May) and prompting a data-driven, meeting-by-meeting decision approach.
ECB speakers stress “agile pragmatism” given global uncertainties, citing the euro’s ~10% rally year-to-date but cautioning amid rising oil prices and geopolitical risks.
⚡ What to Watch Next
Catalyst Outlook
U.S. yields & bond auctions More issuance tied to tax plans could steepen the curve and support the USD.
Middle East headlines Escalation may continue to offer dollar safe-haven benefits, pressuring EUR/USD.
EU economic data Inflation softness (e.g., France) could weaken ECB’s stance, re-pressuring the euro.
Technical levels Watch 1.1450 support—holds for possible rebound; resistance 1.1550–1.1575 for upside pressure.
✅ Summary
Current: EUR/USD around 1.1484, with bearish tilt amid risk aversion.
Bull case: Ongoing U.S. fiscal weakness, delayed tariffs, and ECB support for euro could cap downside.
Bear case: Safe-haven demand from geopolitical tensions, Fed‑ECB divergence, and technical breakdown through 1.1450 could push toward 1.1360.

EURUSD I Monthly CLS I KL -MOB I Model 1Hey, Market Warriors, here is another outlook on this instrument
If you’ve been following me, you already know every setup you see is built around a CLS Footprint, a Key Level, Liquidity and a specific execution model.
If you haven't followed me yet, start now.
My trading system is completely mechanical — designed to remove emotions, opinions, and impulsive decisions. No messy diagonal lines. No random drawings. Just clarity, structure, and execution.
🧩 What is CLS?
CLS is real smart money — the combined power of major investment banks and central banks moving over 6.5 trillion dollars a day. Understanding their operations is key to markets.
✅ Understanding the behavior of CLS allows you to position yourself with the giants during the market manipulations — leading to buying lows and selling highs - cleaner entries, clearer exits, and consistent profits.
📍 Model 1
is right after the manipulation of the CLS candle when CIOD occurs, and we are targeting 50% of the CLS range. H4 CLS ranges supported by HTF go straight to the opposing range.
"Adapt what is useful, reject what is useless, and add what is specifically your own."
— David Perk aka Dave FX Hunter ⚔️
👍 Hit like if you find this analysis helpful, and don't hesitate to comment with your opinions, charts or any questions.

Euro can reach resistance line of channel and make correctionHello traders, I want share with you my opinion about Euro. Previously, price was trading inside a downward channel, gradually declining from the resistance line while forming a series of lower highs and lower lows. During that phase, sellers were clearly in control, and every attempt to grow was met with pressure near the channel’s upper boundary. However, that trend shifted once the price broke through the resistance line, confirming the end of the bearish momentum and the start of a new upward structure. After the breakout, EUR entered an upward channel, supported by multiple bullish impulses and consistent reactions near the support line. Price continued to rise, pushing through the support area and current support level around 1.1420. This upward movement showed strong bullish conviction, especially after the clean breakout and consolidation inside the channel body. Now the pair has approached the resistance line of the rising channel, where previous impulses typically slowed down or reversed. Given the channel geometry and past market behavior, I expect Euro to react to this upper boundary and move downward. For this reason, I set my TP at 1.1325, which aligns with the support line of the upward channel. Please share this idea with your friends and click Boost 🚀
Disclaimer: As part of ThinkMarkets’ Influencer Program, I am sponsored to share and publish their charts in my analysis.

EUR/USD Elliott Wave Outlook – Expanded Flat Playing Out?EUR/USD appears to be unfolding a classic expanded flat correction for wave (4):
Wave A formed as a 3-wave zigzag
Wave B retraced beyond the start of A — a key trait of expanded flats
Now looking for a 5-wave C-leg decline toward the 1.1122 – 1.1002 area
Aligned with 1.0–1.618 extensions of A
RSI + MACD divergence adds bearish confirmation at the B top
Potential bullish reversal zone into late June / early July
As long as price holds below the B high (~1.1650), the bearish path in wave C remains in play.
📍 Target zone: 1.1122–1.1002
📈 Bias: Bearish short-term, bullish long-term (wave 5 up next)

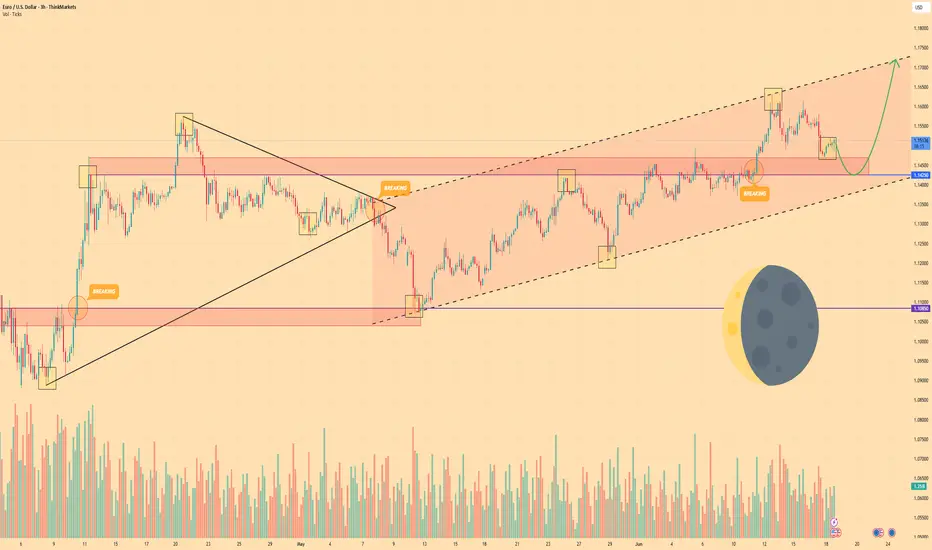
EURO - Price can correct to support area and then continue riseHi guys, this is my overview for EURUSD, feel free to check it and write your feedback in comments👊
Some days ago, price declined below support level and then started to grow inside a triangle pattern.
In this pattern, Euro broke $1.1085 level and even rose higher than $1.1425 level, but soon made a correction.
Later price exited from triangle and fell to support level, after which it started to grow inside rising channel.
Inside channel, price rose near support line and later reached $1.1425 level one more time, and some time traded close.
Soon, Euro broke this level and rose to resistance line of channel and then started to move down.
In my opinion, EUR can fall to support area and then continue to grow in channel to $1.1720 resistance line.
If this post is useful to you, you can support me with like/boost and advice in comments❤️
Disclaimer: As part of ThinkMarkets’ Influencer Program, I am sponsored to share and publish their charts in my analysis.
EURUSD Potential UpsidesHey Traders, in today's trading session we are monitoring EURUSD for a buying opportunity around 1.15300 zone, EURUSD is trading in an uptrend and currently is in a correction phase in which it is approaching the trend at 1.15300 support and resistance area.
Trade safe, Joe.
EUR/USD - Daily highs taken, now what?Introduction
The EUR/USD made a strong move higher today, establishing a clear uptrend on the 4-hour chart. With this latest push, it swept the daily liquidity above the previous high. The question now is whether the EUR/USD will continue moving higher or if there are opportunities for long entries at lower levels.
Liquidity Sweep
EUR/USD has taken out liquidity above the daily highs, where many stop losses are typically positioned. These stops have now been removed from the market. This area could potentially act as a support and resistance flip. However, if we see a 4-hour candle close below the previous daily high, further downside becomes likely.
Where Can We Look for Buys?
During the recent 4-hour move higher, significant progress was made. This upward movement created a daily Fair Value Gap (FVG) between $1.149 and $1.145. This FVG aligns perfectly with the golden pocket Fibonacci level, drawn from the swing low to the swing high. As a result, this zone forms a strong area of confluence for potential buy positions to target a retest of the highs.
Conclusion
Although we are currently breaking above the previous high, this move has yet to be confirmed as sustainable. Holding above this level is crucial. If a 4-hour candle closes below the previous high, it becomes likely that we will revisit the daily FVG and golden pocket Fibonacci zone.
Disclosure: I am part of Trade Nation's Influencer program and receive a monthly fee for using their TradingView charts in my analysis.
Thanks for your support.
- Make sure to follow me so you don't miss out on the next analysis!
- Drop a like and leave a comment!

EUR/USD: Euro Pops Above $1.16 in Four-Year High. What’s Next?The dollar wobbles, Trump talks tariffs, and the euro’s got its dancing shoes on.
The Euro Wakes Up, Stretching Its Legs at $1.16
Look who just rolled out of bed and decided to make a scene.
For the first time in four years, the euro has finally leapt out of its slumber and sprinted to $1.16 — all at the expense of the US dollar, which continues to shed value.
The FX:EURUSD isn’t just crawling higher. It’s flexing, fueled by dollar fatigue, political drama, and some very European stubbornness.
So what’s behind the move? Why is the euro soaring while the European Central Bank is actually cutting rates? And what’s the dollar doing? Let's unpack it all — one central bank, one tweet, and one inflation print at a time.
Trump’s Tariff Ping-Pong: Back On, Back Off
Let’s start with the one thing that never quite leaves the headlines: Trump’s trade policy.
Just when traders were catching their breath after some tariff reprieve on China, the market got pulled back into the mess. “WE ARE GETTING A TOTAL OF 55% TARIFFS, CHINA IS GETTING 10%. RELATIONSHIP IS EXCELLENT,” Trump posted on Truth Social late on Wednesday, reigniting fears that the trade war is getting heated up again. Especially after a US squad of negotiators touched down in London and walked away with some promising news .
Markets don’t love confusion. Investors especially don’t love a US trade policy that changes faster than the Nasdaq NASDAQ:IXIC during CPI week. This kind of noise erodes confidence in US economic leadership and — more importantly — in the dollar.
The world’s most important currency is starting to feel… less important, less relevant, and less reliable. And while it’s not collapsing, it’s definitely catching fewer friends at the FX party.
On the other side of the pond, the euro isn’t rising because Europe is crushing it (even though it’s doing pretty well against rival currencies, just check the forex heatmap ) — it’s rising because the dollar is slipping off its pedestal. So yes, the euro’s up. But this isn’t a standing ovation for Europe — it’s more of a polite shrug away from America.
US Inflation Creeps Higher — And That Means a Cut?
US inflation picked up to 2.4% in May but still left the door open for a cut by the Federal Reserve.
So what does the market do? It prices in a cut.
Lower rates mean lower yields on Treasuries, which means less incentive for global investors to hold dollars. And when the yield game turns dull, guess what gets more attention? Gold OANDA:XAUUSD — because if your asset doesn’t yield anything, at least let it be shiny.
ECB Cuts Again, and the Euro Still Rises?
Now here’s the riddle. The ECB last week cut its benchmark rate to 2% , hitting a two-year low. By all textbook logic, a rate cut should weaken the local currency.
Here’s why it’s rising instead:
Markets are forward-looking . The rate cut was expected and already priced in. What matters now is whether more cuts are coming (spoiler: not too many). Traders are betting the ECB is nearing the end of its easing cycle — and may turn neutral soon.
The Fed looks more dovish . Rate differentials still matter. Even if the ECB is cutting, the Fed is expected to cut more over the next 12 months. That narrows the gap between euro and dollar yields, making the euro more attractive in relative terms.
Eurozone data isn’t great — but it’s not falling apart either. While growth in the eurozone isn’t setting any records, it’s been just OK to support the currency. Inflation is cooling in line with ECB targets, unemployment remains low, and key sectors like manufacturing are showing signs of life.
Put it all together and you get a euro that’s rising despite rate cuts — a phenomenon that would make FX professors tear their hair out, but makes perfect sense when you zoom out.
Technicals: This Isn’t a Flash in the Pan
From a chartist’s perspective, the FX:EURUSD breakout above $1.16 was a big deal. That level had acted as resistance since November 2021. Now cleared, a flurry of algo buys and retail FOMO might fuel the next leg in either direction.
From the bulls’ perspective, momentum is picking up, and the euro looks poised to test $1.17–$1.18 if the dollar stays fragile (that said, keep your eye on any hot news coming out of the economic calendar ). RSI is not yet flashing overbought, and MACD is still screaming “more grounds to cover.”
Question is: How long can the euro dance before the music changes? And we’re asking you — share your thoughts on the euro-dollar pair and let’s see who gets it right!

EURUSD Under Pressure! SELL!
My dear friends,
Please, find my technical outlook for EURUSD below:
The instrument tests an important psychological level 1.1551
Bias - Bearish
Technical Indicators: Supper Trend gives a precise Bearish signal, while Pivot Point HL predicts price changes and potential reversals in the market.
Target - 1.1458
Recommended Stop Loss - 1.1608
About Used Indicators:
Super-trend indicator is more useful in trending markets where there are clear uptrends and downtrends in price.
Disclosure: I am part of Trade Nation's Influencer program and receive a monthly fee for using their TradingView charts in my analysis.
———————————
WISH YOU ALL LUCK

20.06.25 Morning ForecastPairs on Watch -
FX:EURJPY
FX:EURNZD
FX:EURUSD
A short overview of the instruments I am looking at for today, multi-timeframe analysis down to what I will be looking at for an entry. Enjoy!

Eurusd Short-term bearish EUR/USD is showing bearish momentum, breaking below key support with lower highs forming. Selling pressure is increasing amid a stronger USD outlook, favoring a short position.

EURUSD: Move Up Ahead?! 🇪🇺🇺🇸
EURUSD nicely respected the underlined key horizontal support.
A strong rejection from that and a formation of a bullish imbalance candle
indicate a highly probably bullish continuation next week.
Goal - 1.1608
❤️Please, support my work with like, thank you!❤️
I am part of Trade Nation's Influencer program and receive a monthly fee for using their TradingView charts in my analysis.
