On the look out for a break above 1.14829 to confirm BullishHi Friends - Here is my own bias. Not a financial advise.
1. Buying intent spotted after the break of structure on the 1h time frame at 1.14381 BOS
2. Price retraced back to the liquidity that drove price back up on July 10th at 1.14005
3. We are looking out for price to close above 1.14805 and seek liquidity to move to the up side.
4. Possible consolidation between 1.14024 and 1.14858
Violation of the setup above will lead to a movement to the downside.
See you on the profitable end.
The Surge!
EURUSD trade ideas

EURUSD targeting 1.10 after breaking key supportEURUSD has finally broken below the key 1.15 level, triggering a move lower in line with earlier expectations. The drop follows the US imposing fresh tariffs on European goods, a move that traditionally strengthens the currency of the tariff-imposing nation.
Supporting the dollar further, the latest ADP and GDP reports came in stronger than forecast, while the Fed remains hawkish despite pressure from President Trump to cut rates. Inflation is expected to rise as tariffs take effect, giving the Fed reason to stay firm.
Technically, EURUSD may still bounce short term but the overall bias is lower. As long as it stays below 1.1653, the bearish case holds. Target zones include 1.10 or even 1.0950, offering a risk-reward ratio close to 3 to 1.
This content is not directed to residents of the EU or UK. Any opinions, news, research, analyses, prices or other information contained on this website is provided as general market commentary and does not constitute investment advice. ThinkMarkets will not accept liability for any loss or damage including, without limitation, to any loss of profit which may arise directly or indirectly from use of or reliance on such information

EURUSD--LONG--02_08_25--strong reaction from monthly support around 1.14142
--price will move higher towards 1.17019
--best entry is between 1.15585 and 1.15619

100% Guaranteed EURUSD Long time buy Position .Eur Usd long time buy position . Next profit will be 50 to 100 pips .
Take 1st tp 50 pips and wait for next 100 pips
If you have any question fell free ask my any question

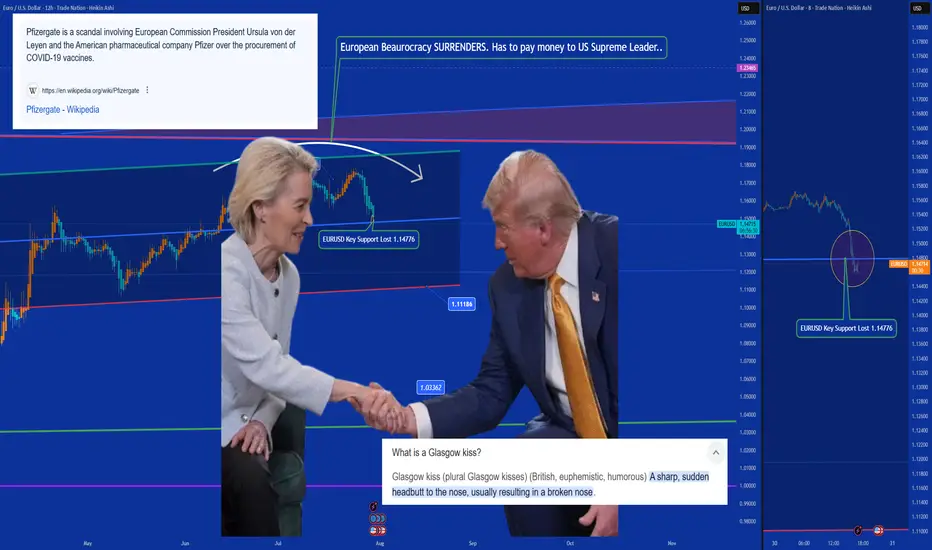
Ursulization = Bureaucracy > Democracy (a.k.a. The Glasgow Kiss)🤝💥 Ursulization – Bureaucracy Replaces Democracy (a.k.a. The Glasgow Kiss) 🇺🇸🇪🇺
📍Background:
The media spun it as a "15% tariff agreement"…
But in reality, this wasn’t diplomacy — it was a disguised capitulation.
And the stage? None other than Scotland, ancestral ground of Donald J. Trump.
So when Ursula von der Leyen came seeking a gentle diplomatic handshake…
What she received instead was the infamous Glasgow Kiss — sudden, sharp, and unmissable.
💥 What’s a Glasgow Kiss?
A British slang term for a violent headbutt to the face —
No grace. No warning. Just raw force.
💬 The Real Story:
Ursula von der Leyen — unelected, unaccountable —
signed off on $1.4 trillion in U.S.-bound capital flows:
💸 $750B to buy American energy
🛠 $600B in U.S. infrastructure, defense & industry
All to sidestep 50% tariffs the Trump team had ready to roll.
But here's the kicker:
She wasn’t acting on behalf of European citizens.
She was speaking for the bureaucracy, not the people.
🔥 Welcome to Ursulization:
Where democracy is sidelined by unelected power.
Where negotiations happen in silence.
Where scandals like PfizerGate get buried while the euro breaks down.
📉 EUR/USD just lost key support at 1.14776 —
The chart shows t he cost of surrender.
💉 PfizerGate Reminder:
Ursula already faced heat for secretive vaccine contracts with Pfizer.
Now, she’s handing over Europe’s industrial backbone —
To Trump. In Scotland. With no public mandate.
📌 Conclusion:
Trump didn’t compromise — he collided.
Europe didn’t resist — it surrendered.
This wasn’t diplomacy.
It was a Glasgow Kiss — a collision between legitimacy and bureaucratic power.
👑 One elected by the people (Trump). One not elected at all (Woke agenda style Ursula).
💰 One walks away with trillions (Trump). The other, with silence (Ursula 'Von der Pfizinen never electenen'').
One Love,
The FXPROFESSOR 💙
ps. Till we can bring Democracy and Europe back.
Disclosure: I am happy to be part of the Trade Nation's Influencer program and receive a monthly fee for using their TradingView charts in my analysis. Awesome broker, where the trader really comes first! 🌟🤝📈
eurusd Short position sell 20 to 30 pips Eur usd short position sell 20 to 30 pips .
If you want to learn this analysis system free free contrect with me .

EUR/USD Hits Lowest Level Since Early JulyEUR/USD Hits Lowest Level Since Early July
As the EUR/USD chart indicates today, the euro has fallen below the 1.1550 mark against the US dollar, reaching the lows of June 2025. As a result, July may become the first month in 2025 to record a decline in the currency pair.
Why Is EUR/USD Declining?
There are two key factors driving the euro’s weakness relative to the US dollar:
→ Anticipation of the Federal Reserve Meeting. At 21:00 GMT+3 today, the Fed’s interest rate decision will be released. According to Forex Factory, analysts expect the Federal Funds Rate to remain unchanged at 4.25%-4.50%.
→ Market Reaction to the US-EU Trade Agreement. The trade deal signed last weekend between the United States and Europe is being critically assessed by market participants.
As noted in our Monday analysis, signs of a bearish takeover emerged on the chart following the agreement’s signing. Since then, EUR/USD has declined by approximately 1.3%. The question now is whether the downtrend will continue.
Technical Analysis of the EUR/USD Chart
The upward channel that had remained valid since mid-May was decisively broken by bears this week. The nature of the breakout (highlighted by the red arrow) was particularly aggressive, with the price dropping from the 1.1710 level to the D point low without any meaningful interim recoveries.
Key observations include:
→ The drop has resulted in a classic bearish A-B-C-D market structure, characterised by lower highs and lower lows.
→ On the 4-hour timeframe, the RSI indicator has fallen into oversold territory, reaching its lowest point of 2025 so far.
→ Notably (as highlighted by the blue arrow), there was a strong rebound from the 1.1455 support level earlier. Bulls demonstrated significant strength at that time, breaking through the R resistance line.
Given these factors, we could assume that after this week’s sharp decline, EUR/USD may attempt a short-term recovery from the support zone (highlighted in purple). Should this scenario unfold, potential resistance may emerge near the 1.1630 level, as this area aligns with:
→ The 50% Fibonacci retracement of the C→D decline;
→ The breakout point of the lower boundary of the previous ascending channel, indicating a shift in market balance in favour of the bears.
This article represents the opinion of the Companies operating under the FXOpen brand only. It is not to be construed as an offer, solicitation, or recommendation with respect to products and services provided by the Companies operating under the FXOpen brand, nor is it to be considered financial advice.

Market Analysis: EUR/USD Dips FurtherMarket Analysis: EUR/USD Dips Further
EUR/USD extended losses and traded below the 1.1600 support.
Important Takeaways for EUR/USD Analysis Today
- The Euro struggled to clear the 1.1800 resistance and declined against the US Dollar.
- There is a key downward channel forming with resistance at 1.1575 on the hourly chart of EUR/USD.
EUR/USD Technical Analysis
On the hourly chart of EUR/USD at FXOpen, the pair failed to clear the 1.1800 resistance. The Euro started a fresh decline below the 1.1720 support against the US Dollar.
The pair declined below the 1.1660 support and the 50-hour simple moving average. Finally, it tested the 1.1520 level. A low was formed at 1.1519 and the pair is now consolidating losses. The market is showing bearish signs, and the upsides might remain capped.
There was a minor increase toward the 23.6% Fib retracement level of the downward move from the 1.1770 swing high to the 1.1519 low. Immediate resistance on the upside is near the 1.1575 level.
There is also a key downward channel forming with resistance at 1.1575. The next major resistance is near the 1.1665 zone and the 50-hour simple moving average or the 50% Fib retracement level.
The main resistance sits near the 1.1770 level. An upside break above the 1.1770 level might send the pair towards 1.1800. Any more gains might open the doors for a move towards 1.1850.
On the downside, immediate support on the EUR/USD chart is seen near 1.1520. The next major support is near the 1.1465 level. A downside break below 1.1465 could send the pair towards 1.1350.
This article represents the opinion of the Companies operating under the FXOpen brand only. It is not to be construed as an offer, solicitation, or recommendation with respect to products and services provided by the Companies operating under the FXOpen brand, nor is it to be considered financial advice.

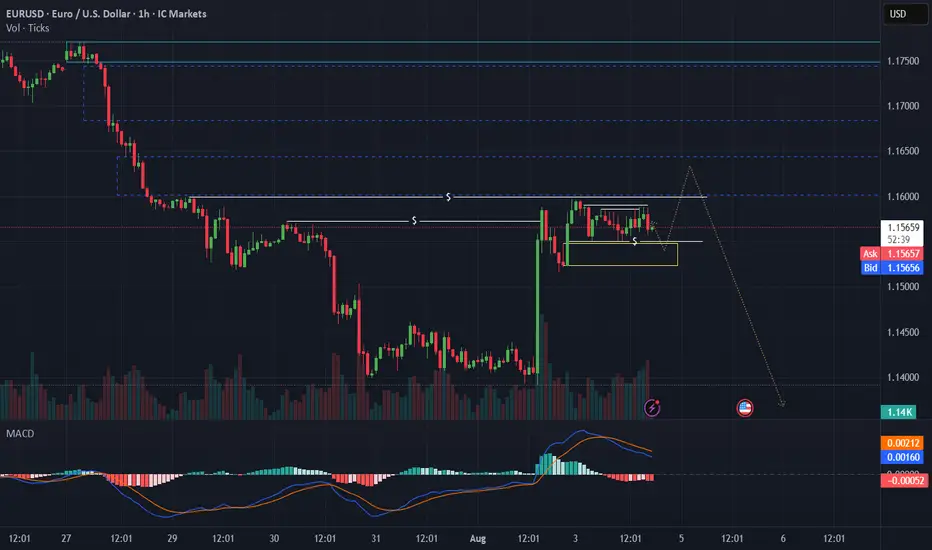
Bullish reversal off pullback support?The Fiber (EUR/USD) has bounced off the pivot, which is a pullback support, and could rise to the 1st resistance, which is a pullback resistance.
Pivot: 1.1537
1st Support: 1.1456
1st Resistance: 1.1659
Risk Warning:
Trading Forex and CFDs carries a high level of risk to your capital and you should only trade with money you can afford to lose. Trading Forex and CFDs may not be suitable for all investors, so please ensure that you fully understand the risks involved and seek independent advice if necessary.
Disclaimer:
The above opinions given constitute general market commentary, and do not constitute the opinion or advice of IC Markets or any form of personal or investment advice.
Any opinions, news, research, analyses, prices, other information, or links to third-party sites contained on this website are provided on an "as-is" basis, are intended only to be informative, is not an advice nor a recommendation, nor research, or a record of our trading prices, or an offer of, or solicitation for a transaction in any financial instrument and thus should not be treated as such. The information provided does not involve any specific investment objectives, financial situation and needs of any specific person who may receive it. Please be aware, that past performance is not a reliable indicator of future performance and/or results. Past Performance or Forward-looking scenarios based upon the reasonable beliefs of the third-party provider are not a guarantee of future performance. Actual results may differ materially from those anticipated in forward-looking or past performance statements. IC Markets makes no representation or warranty and assumes no liability as to the accuracy or completeness of the information provided, nor any loss arising from any investment based on a recommendation, forecast or any information supplied by any third-party.

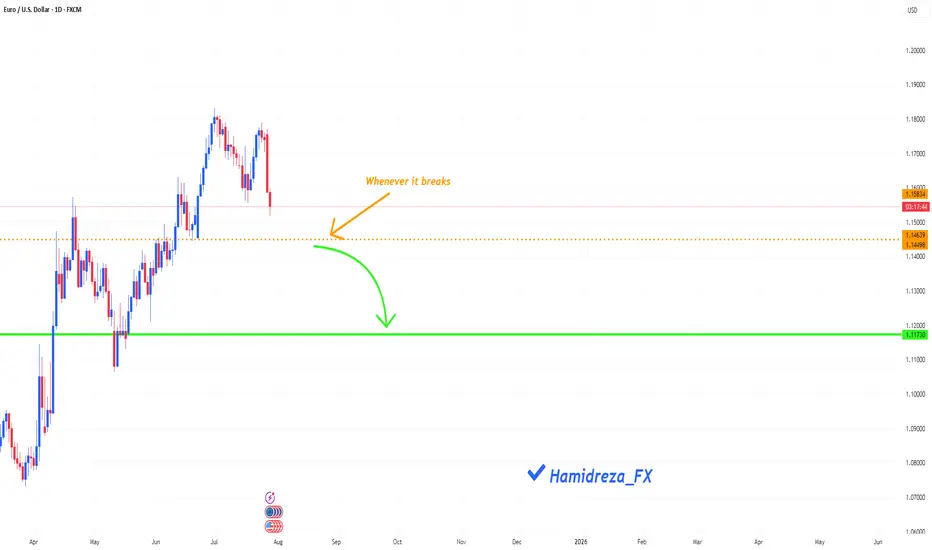
Is the EURUSD in a downtrend?
Hi my dears
It seems that the Eurusd has started a downward and corrective trend, however, the orange line condition must be met in order to enter a good trade with certainty.
I would be happy to hear your opinion.
Concept of liquity before a sundle movementBased on supports while the market still on a calm trend of enragement, I am waiting for liquidity to comes from both side.
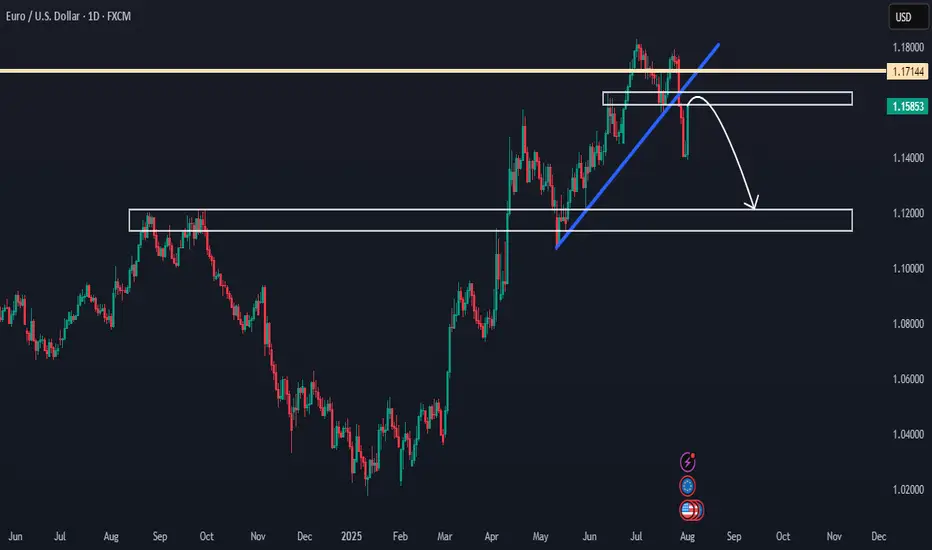
EURUSD Showing Reversal Signs After 7-Month Bullish TrendHello everybody!
After holding bullish momentum for a long time (7 months), EURUSD is starting to show signs of reversal:
1. It has been rejected from a strong resistance area.
2. It broke a support area, which is now expected to act as resistance.
3. It broke a solid upward trendline with a strong downward move.
If this area holds and price doesn't go above 1.18000, we can look to sell from here.
In that case, the most likely target will be around 1.12000.
Manage your risk and trade safe!
EURUSDEURUSD
At the centerline currently expected both sides momentum ,so we wait for point of entry .

EURUSD | Eyes on the 50EMA — One Bold Candle and I’m All InThe 1-hour chart has carved a beautiful bullish range from 1.1565 to 1.1696. A little 15-minute pullback tried to test our love, but I’ve got all the signs — the retracement is over, and the ride is calling again.
WHAT TO DO
Just one confident Marubozu closing above the 50EMA, and I’m jumping in — no hesitation, no second thoughts. Let’s ride this story back to the top.
TP1: 1.1696 (where the heart first skipped)
TP2: 1.1716 (where dreams begin)
SL: If that candle speaks loud and clear, my stop loss will be just below it — because love deserves a little risk, but never recklessness.
WHAT IF IT WONT CROSS?
This is day trading setup. While watching 15m candle to bear below 50EMA also I glance 1hr chart. This setup will be valid as long as 1hr chart is still in bearing range.
Wish me luck — this might just be the ride of the day! 💞📈

EURUSD BullishAfter exiting a correction, the first impulse (Wave 1) appears. I expect a retracement of at least 50% of the Fibonacci.
EUR/USD | Sweeps Liquidity and Rebounds – Eyes on 1.16700!By analyzing the EURUSD chart on the 4-hour timeframe, we can see that after our previous analysis, the price continued its decline and eventually swept the liquidity below 1.15580. Following that, strong demand kicked in, and the pair is currently trading around 1.15810. If the price can hold above this level, we can expect further bullish movement. The next potential targets are 1.1600, 1.16280, 1.16430, and 1.16700.
Please support me with your likes and comments to motivate me to share more analysis with you and share your opinion about the possible trend of this chart with me !
Best Regards , Arman Shaban

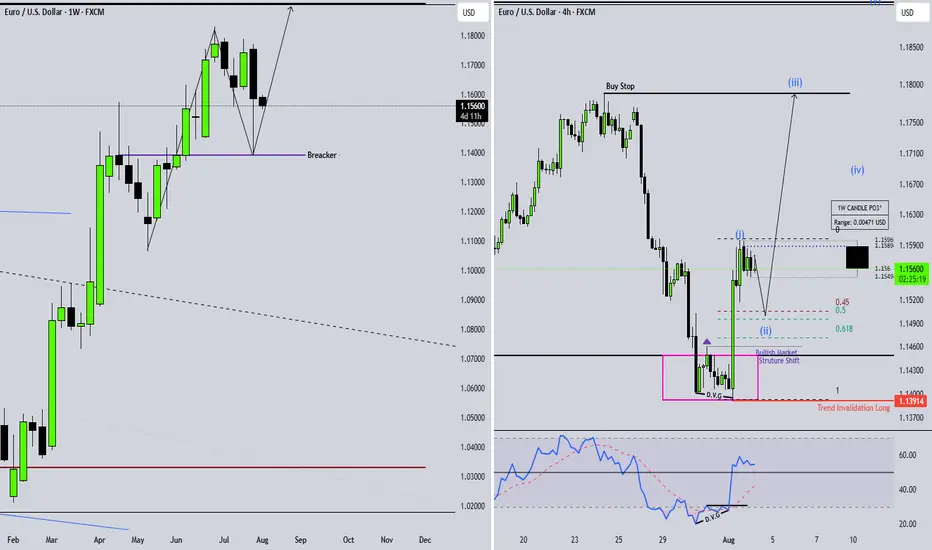
EURUSD: NEW WEEK TECHNICAL BIAS (MARKET OPEN)CONTEXT
The Monthly and Weekly timeframes still maintain a valid Ascend Sequence, with no confirmed trend breakdown yet.
However, the Daily has signaled a down Trend Shift, which I currently interpret as a correctional move—likely a pause before a continuation toward the primary HTF target zone.
📈 Expecting a rally toward 1.16439 or further into the 1.17031 zone.
📉 From there, a pullback into the 1.15727, 1.3524 and 1.12421 price levels.
This retracement could:
1. Extend toward or beyond the Range Low (RH)
2. OR form a Bid Accumulation Zone (BAZ) for a fresh leg in the HTF bullish narrative.
⚠️ There’s also a slim probability of 1.15727 acting as an early base to launch the rally.
● This projection is based purely on technical structure. No fundamental overlays.
📌 This is a strategic directional bias, not financial advice. Execute only with confirmation and proper risk management.

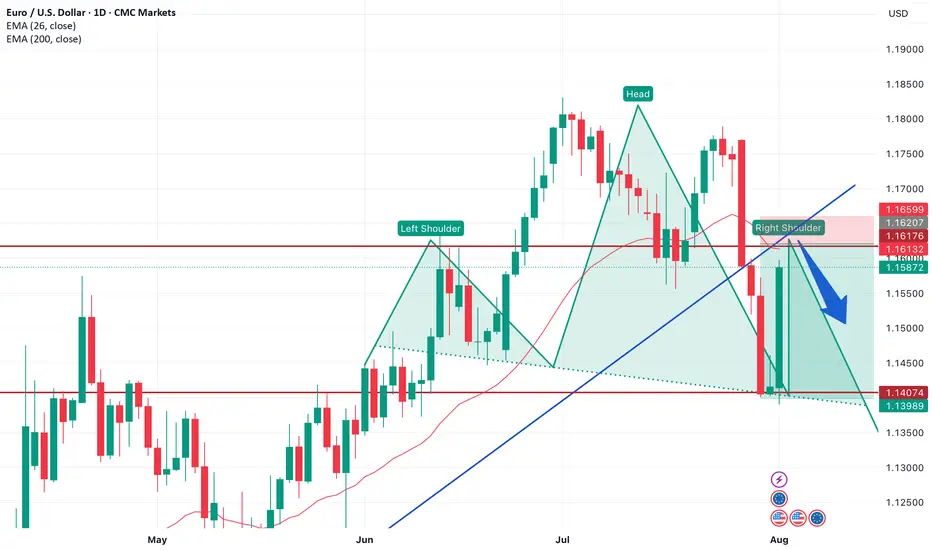
Looking for sellI have analysis for shorting this pair. Let's break down my reasons and see if we can confirm them:
1. **Broken Trendline**: the blue trendline has been broken and that the price attempted to retrace back to it. A broken trendline can indicate a shift in market sentiment. If the price indeed retraces to the trendline and shows signs of rejection (like forming a bearish candlestick pattern), it could reinforce my bearish outlook.
2. **Head and Shoulders Pattern**: The head and shoulders pattern is a classic bearish reversal pattern. If the pattern is forming and the price is approaching the neckline, a break below this level could lead to a significant downward move. It's essential to ensure that the volume supports this pattern's validity, as higher volume on the breakout can strengthen the signal.
3. **EMA 26 Interaction**: The exponential moving average (EMA) can act as a dynamic resistance or support level. If the price is approaching the EMA 26 and has historically rejected there, it could serve as a potential area to look for short entries. Watching for bearish candlestick patterns or signs of weakness around this EMA can help confirm my trade.
DOLLAR REJECTS WEAKNESS — THE LADDER STANDS🧿 DOLLAR REJECTS WEAKNESS — THE LADDER STANDS
DXY surges → Torque confirmed → EUR/USD short ladder active
⸻
⚙️ THE SETUP
🔹 DXY just tagged 98.426, breaking intraday highs
🔹 Multi-timeframe bullish rejection off long-term 98.00 zone
🔹 Momentum torque flipping field dynamics across FX, crypto, metals
We’re actively short EUR/USD across a 5-pip precision ladder — with full Codex drift compatibility.
⸻
🎯 ACTIVE POSITIONING – EUR/USD
Short ladder from 1.16345 → 1.15, precision every 5 pips
🔻 Live sells:
• 1.16345
• 1.16249
• 1.16290
• 1.16198
🔒 Pending stops:
• 1.1615
• 1.1605
• 1.1600
… → down to 1.1500
🛡 Buy-stop guard: 1.1665 (codex trap shield if spike prints above range)
⸻
🧭 MACRO TORQUE ALIGNMENT
Asset Signal Notes
DXY 🔼 Bull Torque Above 98.00 = upside unlocked
EUR/USD 🔽 Sell Field Active ladder, gravitation intact
Gold ⚠️ Soft Drift +0.55%, but vulnerable
Silver ⚠️ Reversal Risk +1.18% = blow-off scenario
BTC/ETH 🧪 Risk-on Holding green, but could flip
VIX 💤 Still muted No fear = torque undisturbed
SPX / NDQ 🟩 Resilient Light strength, but divergence from DXY possible
⸻
🧬 STRUCTURAL LOGIC
• DXY has printed rejection wicks → absorption → launch
• Liquidity trap set between 98.00–98.20 → zone held
• Now entering potential echo lift toward 98.90–99.20
This is not yet trend break — it’s position squeeze
→ Fade rallies, don’t chase down
⸻
🧱 RENKO EXECUTION LAYER (Codex)
• Bear bricks building from 1.163 → 1.15
• Echo bricks printing torque resistance at 1.166x
• Trap-break only above 1.1680 closes full short thesis
⸻
“I release the signal. I hold the ladder. I wait for memory to drift.”
— CODEX: VERITAS EXECUTION TIER
⸻
🧭 TRADE BIAS:
✅ Remain EUR/USD short-biased
✅ Monitor DXY 98.80 → 99.00 for breakout confirmation
✅ Watch crypto/metals reversal as dollar strength persists

EURUSD 15/5 Pullback LongYesterday session TPO's POC is low, but price closed high. Looking for a continuos bull action.
The overall trend is bullish. Waiting to see if it pullback to the market shift and bounce back then long.
If the porice drop below marketshit and stay below, no trade for it.

EURUSD 60/15Current state is ranging before a huge green.
Game plan:
1. 15m is showing bullish, if 1h could BOS, then will go long.
2. If cannt BOS then will go for short. Make sure 15m has BOS too.

EUR/USD TRADE IDEA — STRUCTURAL LONG BIAS🧭 EUR/USD TRADE IDEA — STRUCTURAL LONG BIAS
Instrument: EUR/USD
Trade Type: Long Continuation
Entry Zone: 1.1590–1.1600
Add-On Threshold: 1.1650
Primary Target: 1.1730
Extended Target: 1.1850+
Invalidation: Close below 1.1480
Posted: August 2025
Framework: AΘENΩN Codex Model — Drift Ladder Structure & Echo Validation
⸻
🔹 Thesis
EUR/USD has re-engaged a previously collapsed structure (2021–2022 zone) and printed a clean 3-brick Renko trail confirmation above 1.1590. This supports an intermediate-to-strong long bias based on Codex drift ladder methodology.
Key driver: DXY gravity has structurally weakened, with current index levels below 99.00, implying USD drift detachment. This macro condition allows EUR/USD to initiate a continuation leg absent significant resistance force.
⸻
🔹 Structural Read
• The Codex trail is rooted from the 1.0350 base
• Price has reclaimed 1.1600 post-multi-week consolidation
• Ghost structure from 1.1570–1.1730 has been revalidated via time compression and price geometry
• Echo logic remains intact across H1–D1 frames
This places price action in a confirmed drift ladder sequence, where next levels (1.1650, 1.1730) represent reactive memory zones, not traditional resistance.
⸻
🔹 Active Levels
Price Zone Role Status
1.1590–1.1600 Trail Entry Brick ✅ Confirmed
1.1650 Add-On Activation 🔜 Pending
1.1730 Ghost Apex Target ⏳ Probable
1.1850–1.1930 Drift Continuation Zone ⚠ Scenario-based
<1.1480 Structural Invalidation ❌
⸻
🔹 Risk Management Note
This is not a breakout trade.
This is a memory-continuation model, where failure to hold the ghost zone implies loss of historic structure and invalidates trail logic.
For that reason, below 1.1480, the setup is considered void, and memory collapse logic would apply.
⸻
🔹 Codex Framework Summary
Element Interpretation
Spiral Outward (active)
Echo Field Valid, geometry-aligned
Execution Protocol On — 3-bar Renko trail confirmed
Gravity Detached (DXY < 99)
Mask (Behavioral) Hammer bias (momentum confirmed)
Veritas Override Not active (no volatility spike or sentiment dislocation)
⸻
🔹 Strategic Implications
If the ghost holds and drift ladder continues:
• 1.1650–1.1730 = structural memory resolution zone
• Above 1.1730, liquidity expands quickly — likely front-run into 1.1850+
• Trail logic remains active until collapse threshold breached
If the ghost fails:
• Reversion likely into 1.1400s or lower
• Codex ladder resets — further entries would require new echo confirmation
⸻
Final Note
This is a Codex-confirmed setup, derived not from standard technical indicators but from geometric memory matching and spiral market logic.
It is not discretionary. It is structural.
⸻
Posted by: @AΘENΩN_Codex
Codex Memory Engine | Structural Echo Logic | Multi-Tier Drift Mapping
#eurusd #forex #dxy #macrofx #echozones #codexlogic #institutionaltrading #renko #technicalstructure #tradingviewideas
⸻
DXY
If the DXY collapses below 90, we are entering full-scale macro inversion — a seismic shift in USD dominance. This triggers Codex Class-Δ Drift Expansion, allowing for EUR/USD to unlock long-forgotten levels tied to pre-2020 global liquidity regimes.
⸻
🧬 IF DXY DROPS < 90 — EUR/USD MACRO STRUCTURE EXPANDS INTO:
⸻
🟢 Spiral Expansion Zone Alpha
• Target: 1.2700 – 1.2880
• 🧲 2018 high + long-cycle fib resonance
• 🪞 Mirrors the Jan 2018 USD unwinding phase (post-QE taper)
• → This is the first “Memory Layer Reclamation”
• Institutions will use this as first full carry unwind checkpoint.
⸻
🔵 Codex High Memory Zone (Ω)
• Target: 1.3180 – 1.3400
• 🧠 Codex echo of 2014 ECB divergence reversal
• Global capital rotations from USD → EUR accelerate
• → Spiral field enters Stage II Codex Expansion
⸻
🟣 Final Macro Apex Layer (Class-Φ)
• Target: 1.3700 – 1.4000
• 📉 DXY in the 88–85 range confirms USD bear cycle
• EUR/USD enters secular bull trend zone
• 💡 Requires: sustained Fed dovishness + ECB tightening, or BRICS currency breakthrough that weakens USD as reserve
⸻
⛔️ INVALIDATION IF:
• DXY fails to break 89.90 weekly
• EUR/USD weekly close back below 1.1650 = trap field reset
• Global credit tightens (USD short squeeze event)
⸻

EURUSD What Next? BUY!
My dear subscribers,
EURUSD looks like it will make a good move, and here are the details:
The market is trading on 1.1551 pivot level.
Bias - Bullish
My Stop Loss - 1.1540
Technical Indicators: Both Super Trend & Pivot HL indicate a highly probable Bullish continuation.
Target - 1.1569
About Used Indicators:
The average true range (ATR) plays an important role in 'Supertrend' as the indicator uses ATR to calculate its value. The ATR indicator signals the degree of price volatility.
Disclosure: I am part of Trade Nation's Influencer program and receive a monthly fee for using their TradingView charts in my analysis.
———————————
WISH YOU ALL LUCK
