ENTRY EURUSDDisclaimer:
This is merely a chart-based analytical trading idea and is not considered investment advice. Please manage your risks carefully and conduct your own research before making any trading decisions.
EURUSD trade ideas

EURUSD; Heikin Ashi Trade Idea📈 Hey Traders!
Here’s a fresh outlook from my trading desk. If you’ve been following me for a while, you already know my approach:
🧩 I trade Supply & Demand zones using Heikin Ashi chart on the 4H timeframe.
🧠 I keep it mechanical and clean — no messy charts, no guessing games.
❌ No trendlines, no fixed sessions, no patterns, no indicator overload.
❌ No overanalyzing market structure or imbalances.
❌ No scalping, and no need to be glued to the screen.
✅ I trade exclusively with limit orders, so it’s more of a set-and-forget style.
✅ This means more freedom, less screen time, and a focus on quality setups.
✅ Just a simplified, structured plan and a calm mindset.
💬 Let’s Talk:
💡Do you trade supply & demand too ?
💡What’s your go-to timeframe ?
💡Ever tried Heikin Ashi ?
📩 Got questions about my strategy or setup? Drop them below — ask me anything, I’m here to share.
Let’s grow together and keep it simple. 👊

eurusdWe have a bearish order block in the daily timeframe. If the bottom breaks in the fifteen-minute timeframe, we can enter a sell position. Or the fifteen-minute or five-minute bottom in the news timeframe must break with the body.

EUR/USD Breakout Ladder — Targeting 1.20+
📊 EUR/USD Breakout Ladder — Targeting 1.20+
Strategy: Staggered buy stops every 5 pips
Executed Range: 1.15792 → 1.20000
Lot Size: 0.1 per rung average
Stops/TP: No SL / No TP — trailing begins above 1.2025
Status: All orders placed — waiting for price to do the work
⸻
🔍 Trade Thesis
EUR/USD is climbing cleanly through multi-week resistance levels with no exhaustion signs yet on H1/H4.
This is a precision ladder build, not a directional bet — letting price trigger into strength only.
Key Zone Ahead:
🟦 1.2000 = major psychological + historical structure
🔓 Trail logic activates only after confirmed close above 1.2025–1.2040
📈 If momentum holds, next macro levels are 1.2250 → 1.2500+
⸻
🌐 Macro Correlation Map (Live)
Asset Signal Implication for EUR/USD
DXY 98.12 (↘) ✅ USD weakness supports upside
VIX 16.77 (↓ 6%) ✅ Low fear = risk-on flow
SPX 6,345 (↑ 0.73%) ✅ Broad risk bid confirms trend
BTC/USD 114,514 (↓ 0.45%) ⚠️ Minor drag, but not dominant driver
GOLD $3,378.72 (↑ 0.28%) 🟨 Stable —
no conflict with EUR strength
US10Y Not shown, but yields soft ✅ Less USD appeal globally
→ Macro environment favors continued EUR/USD upside. No current red flags across equities, vol, or commodity safety flows.
⸻
⚠️ Risk Notes
• This is not a high-leverage bet — it’s a structure-following execution
• No guessing reversals, no trying to pick tops/bottoms
• Will scale out partials only on trail trigger, not emotional spikes
⸻
Bias: Bullish continuation through memory zones
Execution: Fully automated ladder — price leads, I follow
Objective: Let strength pay. No chase. No force.

EURUSD rises slightly as US economy weakens more than expected1) Market Overview
EURUSD fluctuates around 1.0850 - 1.0960, with a slight upward trend thanks to
- US economic data is below expectations
- ECB maintains a mildly dovish stance, affirming that it will continue to monitor inflation instead of declaring an end to interest rate hikes
This week the market will focus on
- US CPI - which can cause strong fluctuations
- Some statements from ECB and FED members
- Geopolitical risks in the Middle East and Europe
2) Technical Analysis
- Trend: EURUSD is trending slightly upward, the main support level is around 1.0850 and strong resistance is at 1.0970-1.10000
- RSI: fluctuates near the 55-60 zone, not overbought, still has room to increase
- MACD: is crossing the signal line - a potential bullish signal
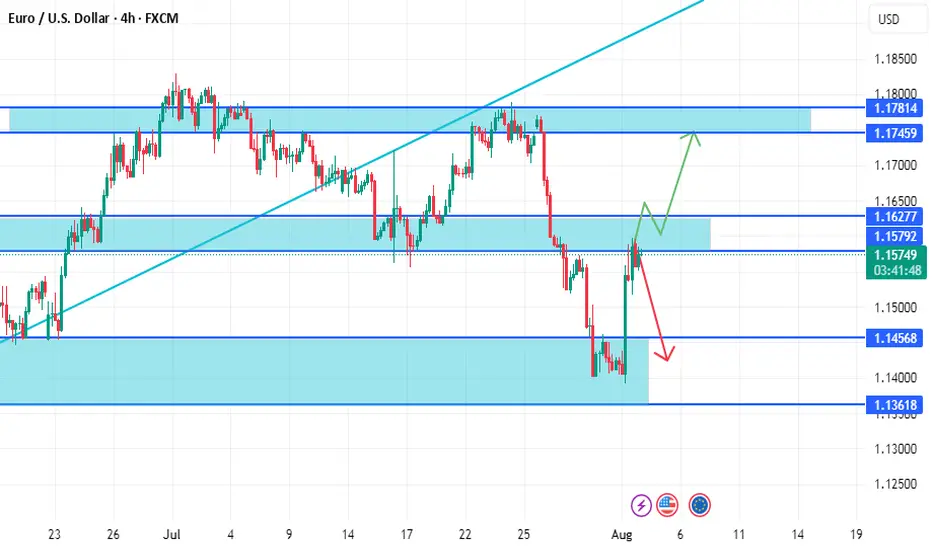
EURUSD Wave Analysis – 6 August 2025
- EURUSD reversed from support area
- Likely to rise to resistance level 1.1755
EURUSD currency pair recently reversed from the support area between the strong support level of 1.1500 (former low of wave iv from June), lower daily Bollinger Band and the 50% Fibonacci correction of the upward impulse 1 from May.
The upward reversal from this support area created the clear daily Japanese candlesticks reversal pattern Morning Star.
Given the clear daily uptrend and bearish us dollar sentiment seen today, EURUSD can be expected to rise to the next resistance level 1.1755.
Range breakoutEUR/USD managed to break out of the range, and did so with relatively strong momentum. It will likely rise up to 1.17500.

EUR/USDgoing to buy,pull back from the trend line . stop loss below the trend line just in case the price reverse.

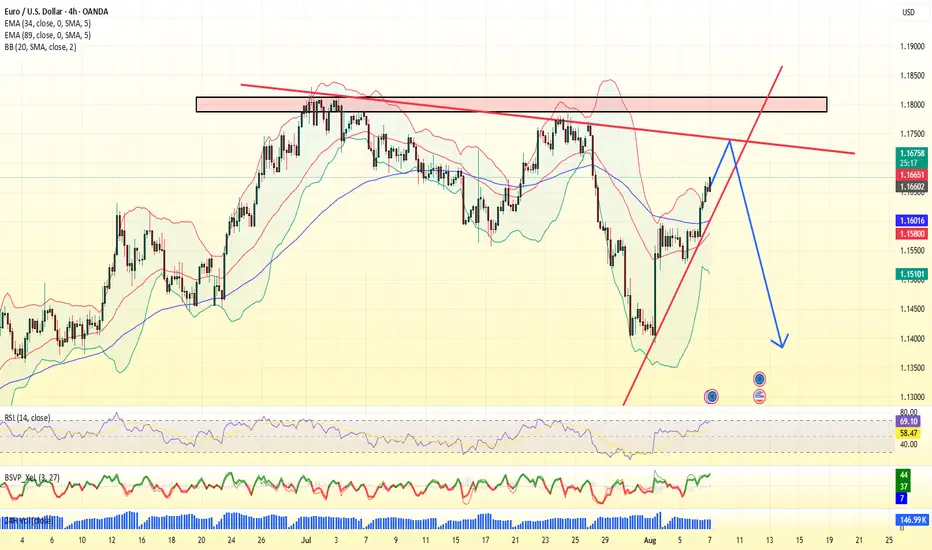
EURUSD BEARISHTechnically:
Printing LL and LH
Support became resistance
No bullish divergence
Fundamentally:
According to the COT data Big player shorting the EU Which means longing USD

EURUSD TRADING IDEA 08 05 25Here's another one:
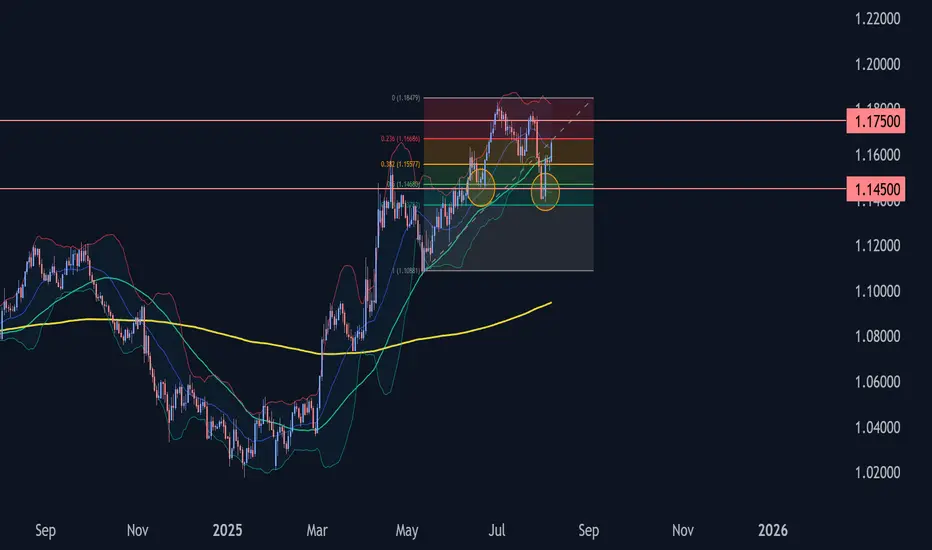
Looking for a strong rejection in the discount zone before going long.

Idea on a zone We have a great zone on EU he Euro to Dollar (EUR/USD) exchange rate dipped to just below 1.14 this week before a recovery to the 1.1550 after the latest US jobs data.
On a long-term view, Berenberg expects fiscal deterioration will be a key element undermining the dollar and it considers that EUR/USD gains to 1.50 are realistic over the longer term.
Berenberg notes that the US has registered a budget deficit every year since the 1960s, but there has been a notable shift in trends over the past few years with substantial deficits even when growth is solid.
Following the latest Budget Bill, the bank estimates that the US will run a deficit of over 7% of GDP next fiscal year. There would also be severe consequences if the US economy slides into recession.

EUR/USD Idea for SHORT4h time frame + real volume + market structure + 5 of RMA (10/20/30/40/50) = SHORT !!!

EURUSD – DAILY FORECAST Q3 | W32 | D4 | Y25📊 EURUSD – DAILY FORECAST
Q3 | W32 | D4 | Y25
Daily Forecast 🔍📅
Here’s a short diagnosis of the current chart setup 🧠📈
Higher time frame order blocks have been identified — these are our patient points of interest 🎯🧭.
It’s crucial to wait for a confirmed break of structure 🧱✅ before forming a directional bias.
This keeps us disciplined and aligned with what price action is truly telling us.
📈 Risk Management Protocols
🔑 Core principles:
Max 1% risk per trade
Only execute at pre-identified levels
Use alerts, not emotion
Stick to your RR plan — minimum 1:2
🧠 You’re not paid for how many trades you take, you’re paid for how well you manage risk.
🧠 Weekly FRGNT Insight
"Trade what the market gives, not what your ego wants."
Stay mechanical. Stay focused. Let the probabilities work.
FX:EURUSD

EURUSD consider on support and resistance zone togetherEURUSD now on resistance area i expect the price will break and form head and shoulder
on the other hand, may this area is strong and the price make down trend ,but we should wait candle pattern on this area to take sell
you must wait price action to take good trade with risk to reward 1:3
good luck
EURUSD has broken & hovering near resistance.EURUSD has broken & hovering near resistance. US dollar has started weaking again due to Tariff war.

EURUSD I Daily CLS I Model 2 I Targets Full CLS rangeYo Market Warriors ⚔️
Fresh outlook drop — if you’ve been riding with me, you already know:
🎯My system is 100% mechanical. No emotions. No trend lines. No subjective guessing. Just precision, structure, and sniper entries.
🧠 What’s CLS?
It’s the real smart money. The invisible hand behind $7T/day — banks, algos, central players.
📍Model 1:
HTF bias based on the daily and weekly candles closes,
Wait for CLS candle to be created and manipulated. Switch to correct LTF and spot CIOD. Enter and target 50% of the CLS candle.
For high probability include Dealing Ranges, Weekly Profiles and CLS Timing.
Analysis done on the Tradenation Charts
Disclosure: I am part of Trade Nation's Influencer program and receive a monthly fee for using their TradingView charts in my analysis.
Trading is like a sport. If you consistently practice you can learn it.
“Adapt what is useful. Reject whats useless and add whats is specifically yours.”
David Perk aka Dave FX Hunter
💬 Don't hesitate to ask any questions or share your opinions

Long EURUSDPrice will push up to fill the gap
Even though 1D chart is in the short trend
But the price need to go back to fill the gap
If the price still not break the sell trend of 1D
then it will head back down to fill 1.10 imbalance below

Sell EURUSD after BRD the level of 1.15This market is started the down move by forming a very
strong bearish bars
break down the level 1.15
so I opend short with RR=1:2.6
then after a 100 points in profit I added to
this short position another one with RR=1:2

Swing short on EURUSDPotential swing short on EURUSD. This was evaluated on the 1 day timeframe. TP on recent support zone.

EU Scalp (wrong bias) - Trump speech Came into the day with a neutral bias looking for some kind of retracement deeper into the hourly leg.
After a bearish London with bearish H1 order flow showing (H1 wicks + rejecting the Order block) we sell our liquidity shakeout right in the middle of New York session.
It's really got me interested was how close we came to the daily DOL (or so I thought) before retracing

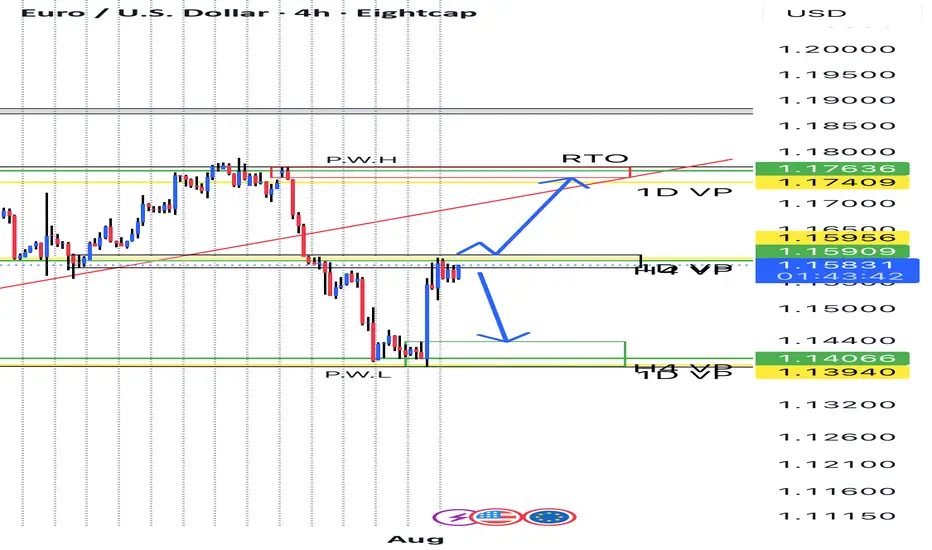
EUR/USD Breaks Daily Lows as Consolidation DeepensFenzoFx—EUR/USD consolidates after the impulsive bullish momentum. The uptrend initiated after the price swept below the monthly lows at $1.1400. In the current trading session, the price dipped below the previous day's low, meaning the consolidation period will likely extend to a lower support level.
The immediate resistance is at the previous day's high, the $1.159 resistance. From a technical perspective, we expect the currency pair to trade lower, near the support at $1.146, the bullish break of structure.
This level can provide a discounted price to join the dominant trend, which is bullish. We expect the Euro to rise toward $1.169 after the end of the consolidation period.

EURUSD POSSIBLE SELL OPPORTUNITY!Price is reacting at a major o key level of broken support turn resistance. I anticipate a sell off from the current market price with my target profit situated at 1.13962 A sell opportunity is envisaged.

EURUSDEURUSD needs a correction down or a break above resistance, retest and another push up this week.
Disclosure: We are part of Trade Nations Influencer Program and receive a monthly fee for using their TradingView charts in our analysis.