EURUSD Forming Bullish Continuation SetupEURUSD is currently retesting a key breakout zone that previously acted as resistance and is now serving as strong support around the 1.1620–1.1630 area. After a healthy bullish impulse in recent weeks, the pair is pulling back in a controlled manner, likely forming a bullish continuation setup. I entered from earlier levels and remain confident in a further upward move, with the structure showing signs of a new bullish wave forming.
From a fundamental perspective, the euro is gaining strength as the European Central Bank (ECB) continues to signal a more cautious stance on rate cuts compared to the Federal Reserve. US inflation data released last week came in softer than expected, increasing speculation that the Fed could start its rate-cutting cycle as early as September. This shift in monetary policy outlook has weighed on the US dollar, opening up room for EURUSD to push higher.
Additionally, eurozone macro data is showing early signs of recovery, especially in Germany, where industrial production and sentiment indicators are slowly improving. As inflation in Europe trends lower but remains sticky, the ECB has fewer reasons to rush into easing, which adds strength to the euro over the medium term. This divergence is a critical driver of the current bullish sentiment in EURUSD.
Technically, the market is respecting a clean demand zone, with momentum indicators starting to flatten after the recent correction. With the trend structure intact and fundamentals aligned, I'm targeting the 1.2180–1.2200 zone as the next leg of this bullish cycle. Price action remains favorable, and the broader sentiment on TradingView is also increasingly bullish, confirming my conviction in this setup.
EURUSD trade ideas

EURUSD BUY So we have nice weekly fvg below along with a strong pivot point we could possibly see price reach this level before the push to the upside. I’m pretty confident we will have a strong push to the upside due to the macroeconomics and positioning of key players as they are still very bullish on the euro as we still creating higher highs consistently. A lot of people are in sells right now so we could see them taken out before the move to the downside they the EurUsd buy will be in play .

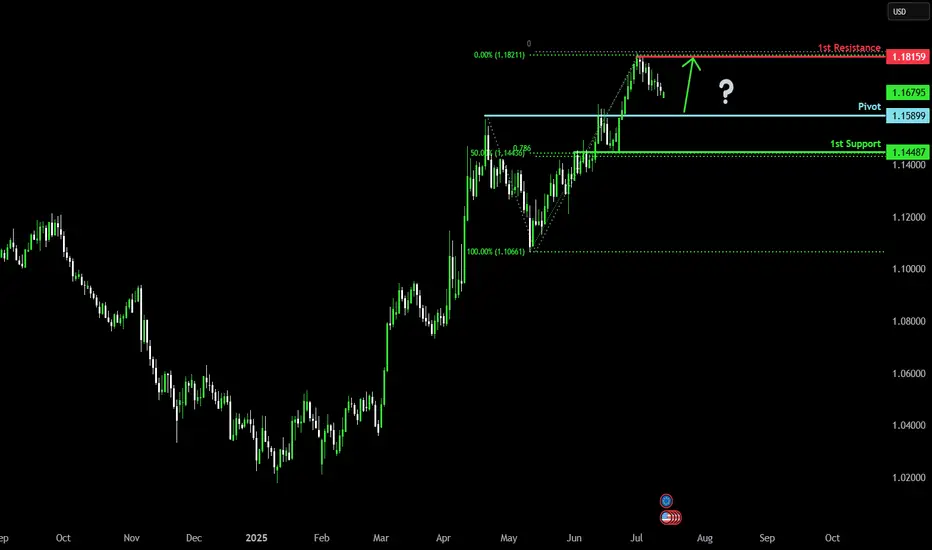
Bullish continuation?The Fiber (EUR/USD) is falling towards the pivot, which has been identified as a pullback support and could bounce to the 1st resistance.
Pivot: 1.1589
1st Support: 1.1448
1st Resistance: 1.1815
Risk Warning:
Trading Forex and CFDs carries a high level of risk to your capital and you should only trade with money you can afford to lose. Trading Forex and CFDs may not be suitable for all investors, so please ensure that you fully understand the risks involved and seek independent advice if necessary.
Disclaimer:
The above opinions given constitute general market commentary, and do not constitute the opinion or advice of IC Markets or any form of personal or investment advice.
Any opinions, news, research, analyses, prices, other information, or links to third-party sites contained on this website are provided on an "as-is" basis, are intended only to be informative, is not an advice nor a recommendation, nor research, or a record of our trading prices, or an offer of, or solicitation for a transaction in any financial instrument and thus should not be treated as such. The information provided does not involve any specific investment objectives, financial situation and needs of any specific person who may receive it. Please be aware, that past performance is not a reliable indicator of future performance and/or results. Past Performance or Forward-looking scenarios based upon the reasonable beliefs of the third-party provider are not a guarantee of future performance. Actual results may differ materially from those anticipated in forward-looking or past performance statements. IC Markets makes no representation or warranty and assumes no liability as to the accuracy or completeness of the information provided, nor any loss arising from any investment based on a recommendation, forecast or any information supplied by any third-party.
Two Brains, One Trade: Why You Freeze Under PressureBy MJTrading:
In trading, your biggest opponent isn’t volatility.
It’s your own neural wiring.
Every trader operates with two main systems:
🧠 System 2 – Rational, deliberate, planning (Prefrontal Cortex)
🧠 System 1 – Emotional, instinctive, fast (Amygdala & Limbic Brain)
Before entry, System 2 is in control. You feel calm, logical.
But the moment money is at risk—especially in drawdown or after a missed TP—System 1 takes over.
💥 Stress hormones spike
💥 Focus narrows
💥 Long-term thinking disappears
💥 You freeze, or act impulsively
You knew what to do.
But you didn’t do it.
Because in that moment, your rational mind wasn’t driving anymore.
⚖️ Set & Forget vs. Floating Managers
Different trading personalities react differently under pressure:
🔹 Set & Forget Traders
Rely on automation or predefined exits to bypass emotional hijack.
They reduce cognitive load, but often feel regret when price goes “a little more.”
🔹 Floating Management Traders
Rely on intuition and live feeling. They stay with the chart, adjusting based on flow.
When calm and trained, they shine.
But under pressure, they’re more vulnerable to emotional loops:
– hesitation
– premature exits
– revenge tweaks
– system betrayal
🧘♂️ What can you do?
✔️ Pre-plan decisions
Make the hard calls before emotions kick in.
✔️ Mental rehearsal
Visualize trade management scenarios—yes, like athletes do.
✔️ Create fallback protocols
So if you freeze, your system still knows what to do.
🧠 For Those Who Want to Go Deeper:
“Thinking, Fast and Slow” by Daniel Kahneman
Understand System 1 & 2 thinking—and how cognitive bias shapes all decisions, not just trades.
“The Hour Between Dog and Wolf” by John Coates
A stunning look at how biology, hormones, and risk-taking collide in traders' brains.
🔓 Final Thought:
If your strategy works in theory, but breaks in real-time—
It’s time to work on your neural execution layer.
Because in trading, you don’t rise to your level of analysis—
you fall to your level of emotional wiring.
— MJTrading
#NeuroTrading #TraderTypes #TradingPsychology #SetAndForget #FloatingManagement #MindOverMarkets #EURUSD #MJTrading
Previous psychology Ideas:

EURUSD Short ProjectDescription:
1. Price Drivers: smart money distribution
2. Current Trend: down
3. Momentum: confirmed bearish
Action: Waiting for entry on the intraday timeframe (Entry will be published further)
*Disclaimer: I will not accept liability for any loss or damage, including without limitation to any loss of profit, which may arise directly or indirectly from use of or reliance on such information.

EURUSD Weakened By New Tariff Tensions With US This is the Weekly FOREX Forecast for the week of July 14 - 18th.
In this video, we will analyze the following FX market: EURSUD
The latest headlines tell the story. The tariffs are triggering a slow run to the USD safe haven. The previous week showed the USD Index closed pretty strong. There's a good chance we'll see more of the same this coming week.
Look for the strength in USD to continue to be supported by fundamental news, and outperform the other major currencies, including the EURO.
Buy USD/xxx
Sell xxx/USD
Enjoy!
May profits be upon you.
Leave any questions or comments in the comment section.
I appreciate any feedback from my viewers!
Like and/or subscribe if you want more accurate analysis.
Thank you so much!
Disclaimer:
I do not provide personal investment advice and I am not a qualified licensed investment advisor.
All information found here, including any ideas, opinions, views, predictions, forecasts, commentaries, suggestions, expressed or implied herein, are for informational, entertainment or educational purposes only and should not be construed as personal investment advice. While the information provided is believed to be accurate, it may include errors or inaccuracies.
I will not and cannot be held liable for any actions you take as a result of anything you read here.
Conduct your own due diligence, or consult a licensed financial advisor or broker before making any and all investment decisions. Any investments, trades, speculations, or decisions made on the basis of any information found on this channel, expressed or implied herein, are committed at your own risk, financial or otherwise.

Bullish bounce off 50% Fibonacci support?EUR/USD is falling towards the support level which is a pullback support that lines up with the 50% Fibonacci support and could bounce from this level to our take profit.
Entry: 1.1632
Why we like it:
There is a pullback support that lines up with the 50% Fibonacci retracement.
Stop loss: 1.1582
Why we like it:
There is an overlap support that is slightly below the 61.8% Fibonacci retracement.
Take profit: 1.1738
Why we like it:
There is an overlap resistance.
Enjoying your TradingView experience? Review us!
Please be advised that the information presented on TradingView is provided to Vantage (‘Vantage Global Limited’, ‘we’) by a third-party provider (‘Everest Fortune Group’). Please be reminded that you are solely responsible for the trading decisions on your account. There is a very high degree of risk involved in trading. Any information and/or content is intended entirely for research, educational and informational purposes only and does not constitute investment or consultation advice or investment strategy. The information is not tailored to the investment needs of any specific person and therefore does not involve a consideration of any of the investment objectives, financial situation or needs of any viewer that may receive it. Kindly also note that past performance is not a reliable indicator of future results. Actual results may differ materially from those anticipated in forward-looking or past performance statements. We assume no liability as to the accuracy or completeness of any of the information and/or content provided herein and the Company cannot be held responsible for any omission, mistake nor for any loss or damage including without limitation to any loss of profit which may arise from reliance on any information supplied by Everest Fortune Group.

Market Watch UPDATES! FOREX Major PairsWelcome to the Market Watch Updates for Monday, July 14th.
In this video, we will give the forecast updates for the following markets:
USD Index, EURUSD, GBPUSD, AUDUSD, NZDUSD, USDCAD, USDCHF and USDJPY.
Enjoy!
May profits be upon you.
Leave any questions or comments in the comment section.
I appreciate any feedback from my viewers!
Like and/or subscribe if you want more accurate analysis.
Thank you so much!
Disclaimer:
I do not provide personal investment advice and I am not a qualified licensed investment advisor.
All information found here, including any ideas, opinions, views, predictions, forecasts, commentaries, suggestions, expressed or implied herein, are for informational, entertainment or educational purposes only and should not be construed as personal investment advice. While the information provided is believed to be accurate, it may include errors or inaccuracies.
I will not and cannot be held liable for any actions you take as a result of anything you read here.
Conduct your own due diligence, or consult a licensed financial advisor or broker before making any and all investment decisions. Any investments, trades, speculations, or decisions made on the basis of any information found on this channel, expressed or implied herein, are committed at your own risk, financial or otherwise.

Short Term Market Reversal IncomingRetail’s still buying breakouts, but the music just stopped.
This was the rally they weren’t supposed to catch.
Now it’s time to flip the script and bleed it back to origin.
Trading is a very difficult profession. Most people fail, but it's also not impossible. If you don't trade you're a loser.
It's a zero-sum game. 0 1
Zero-sum game is a mathematical representation in game theory and economic theory of a situation that involves two competing entities, where the result is an advantage for one side and an equivalent loss for the other.
It's all just digits on a screen and if they want your money they'll take your money, so you gotta respect your risk management if you don't want to lose everything or you'll have to break the matrix by seeing into the future,
Once you get to see the future. THERE IS NO TURNING BACK.
If you're reading this I hope you're having a great year. This year is all about endings and new beginnings. So stay locked in.
WAGMI
Oh yeah don't forget I gave you guys FX_IDC:EURUSD at 1.03 and FX_IDC:XAGUSD at $22
Nerds

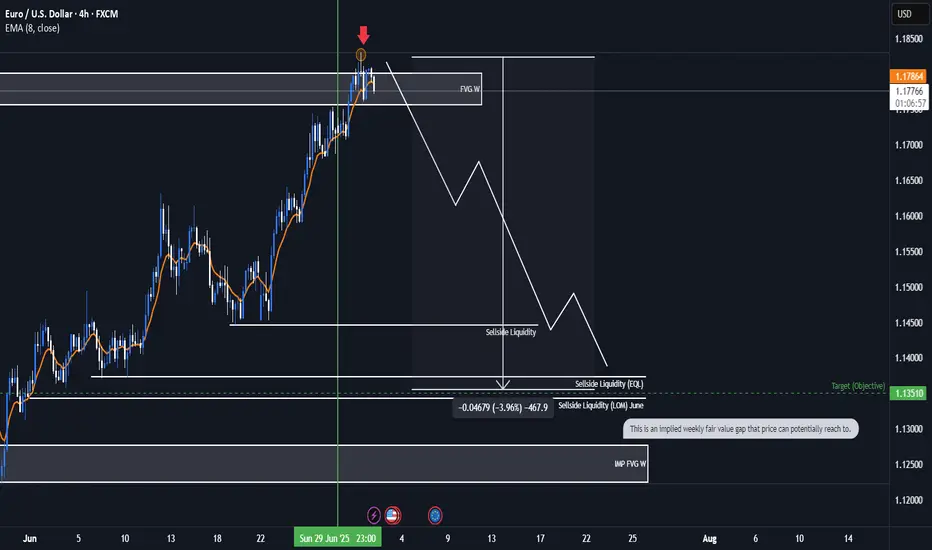
EURUSD Bearish ideaWe are in a weekly fair value gap that we have balance and potentially collected orders to prepare for a potential drop in price. We are anticipating a quarterly shift for the month of July were we could be targeting downside liquidity that is in open float.
* Fundamentals:
-Interest rate differentials shows us that USD interest rate of 4.5 is higher than the interest rate EUR 2.15 which lead to the longer fundamental frame work of price correcting to the higher dollar rate to the euro.
-The COT report also indicates to us that there is huge buying of Dollar by the commercials and a huge amount of selling of the EUR by commercials which can lead us to assume potential weaker dollar.
*Targeting:
-We are looking for the low of last month (June) to be taken out as well as even potentially reaching to the implied weekly fair value gap.
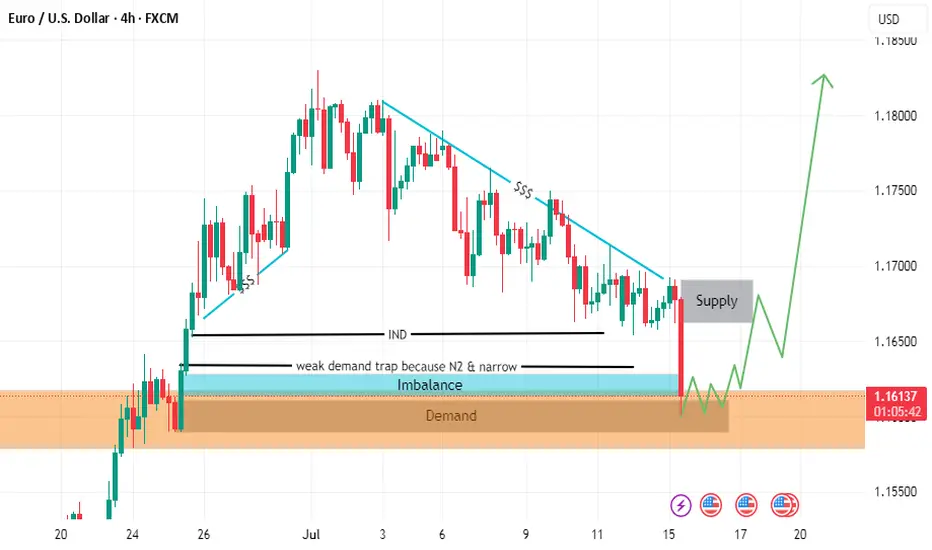
EURO - Price will rise a little and then drop to $1.1500 pointsHi guys, this is my overview for EURUSD, feel free to check it and write your feedback in comments👊
Price earlier carved out a pennant pattern after a strong rally, with price oscillating between converging trendlines and indecision mounting near $1.1550 resistance.
After several weeks in consolidation, sellers finally broke down below the pennant base, sending price back toward the support area and trapping late buyers.
Buyers regrouped and launched a new advance, driving EUR into a well-defined rising channel.
During this channel run, two notable breakouts above interim highs were quickly followed by exits at the upper trendline.
Price now sits in a tight consolidation just under the rising channel’s ceiling near $1.1700, forming small corrective swings on lighter volume.
I expect one more shallow rally toward $1.1750 before sellers overwhelm buyers again, pushing Euro down through $1.1550 and toward the $1.1500 points.
If this post is useful to you, you can support me with like/boost and advice in comments❤️
Disclaimer: As part of ThinkMarkets’ Influencer Program, I am sponsored to share and publish their charts in my analysis.

EUR/USD Retracement Into Demand ZoneHello guys!
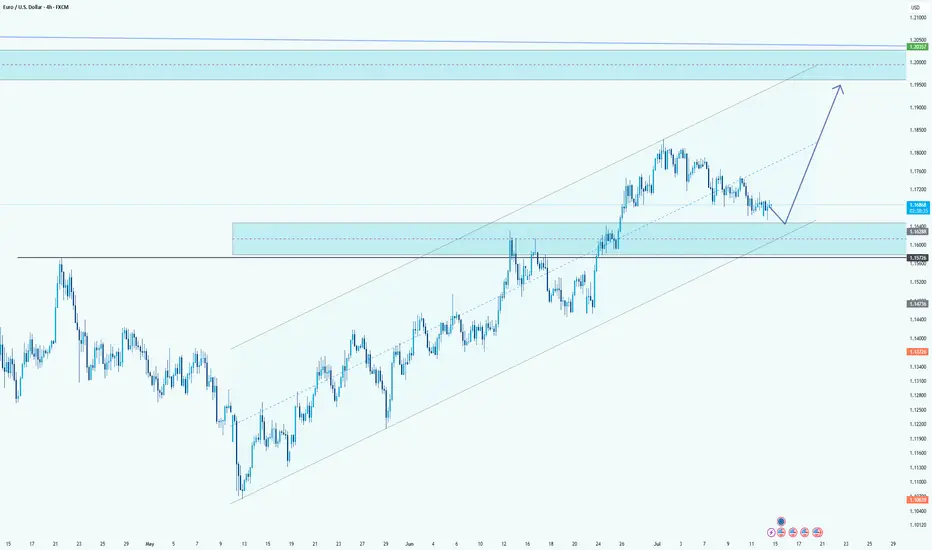
EUR/USD is currently undergoing a healthy retracement after an extended bullish trend within the ascending channel. The price is now approaching a key demand zone, which aligns perfectly with the mid-line of the channel structure.
This zone previously acted as a strong resistance area and is now expected to serve as support, confirming a classic flip in market structure. The reaction around the 1.16288 - 1.15774 area will be crucial.
If buyers step in here, the bullish momentum is likely to resume with the next major target being the upper resistance zone near 1.20000 , as projected by the upward arrow. The overall structure remains bullish as long as the price holds above the channel support and doesn't close below the last demand zone.
EURUSD DAILY BISI EURUSD DAILY BISI
In LTF after engage then mss with proper OBI then our entry in bisi

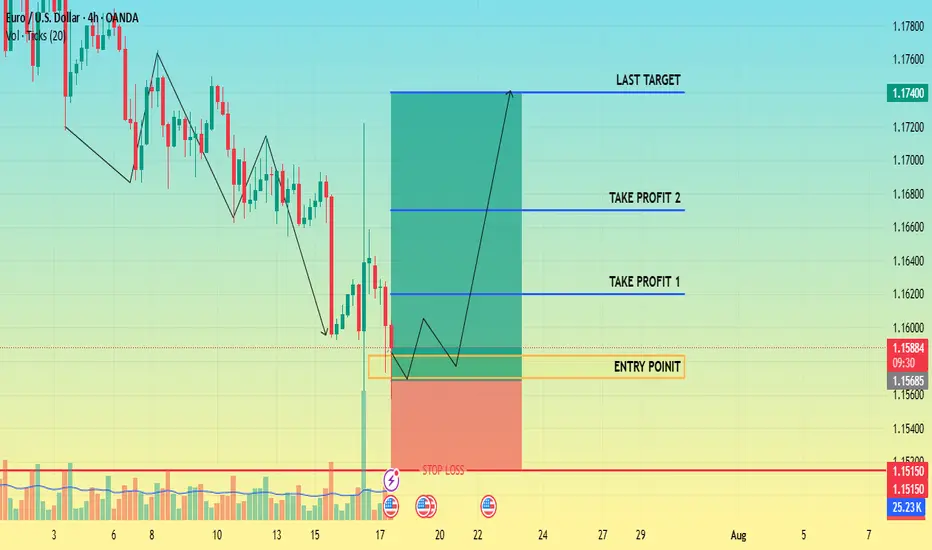
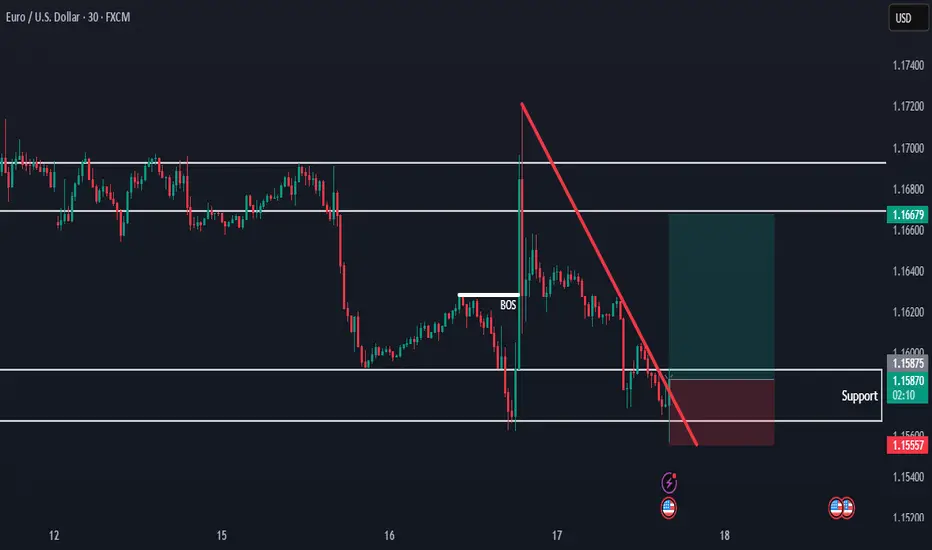
CHECK EURUSD SIGNAL READ CAPTAIN📍 Trade Setup Overview
Trade Direction: Short (buy)
Entry Point: Around 1.15830 1.15700
Stop Loss: Around 1.15150
🎯 Target Levels
Take Profit 1:
1.16200
Take Profit 2:
1.16700
Last Target:
1.17400
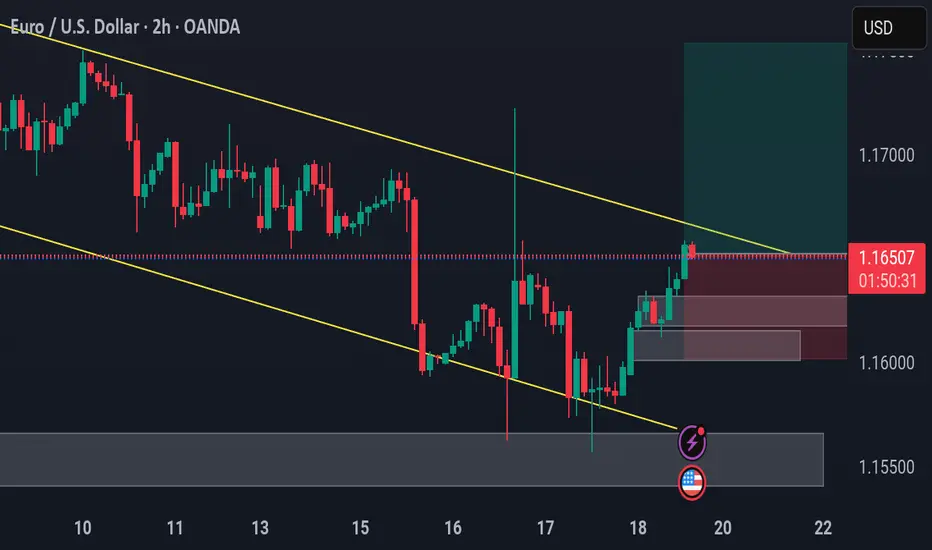
EURUSD Breakout Trade EUR/USD – Breakout Confirmation
🔹 Multi-Timeframe Bullish Setup by PULSETRADESFX
EUR/USD is showing a strong bullish shift after breaking out of a well-defined descending channel. Price reacted perfectly from the demand zone and is now pushing above descending trendline resistance across the 2H chart.
This signals early signs of trend reversal, backed by confluence across intraday and higher timeframes.
The structure is clean, the R:R is healthy, and momentum favors bulls after multiple rejections at key support.
---
✅ Confluences Supporting the Long:
Descending channel breakout (2H )
Triple demand zone rejection
Break and close above minor resistance
Clean bullish momentum candle
Economic catalysts ahead (watch USD data releases 📅)
📅 July 18, 2025
📊 FOREX.com | EUR/USD (2H)
#EURUSD #Forex #BreakoutTrade #BullishSetup #TechnicalAnalysis #TradingView #PULSETRADESFX
EURUSD long Lion SETUPhello everyone
the price is in a strong demand area
as liquidity has been withdrawn
and the fair value gap has been filled
but we are waiting for formation pattern on a smaller frame in order to enter an upward wave.
we also have resistance area
so in short. I expect an upside go upppp
Trump’s Noise, Market’s Choice: Downtrend ContinuesTrump came out with a fake piece of news to create some volatility for himself.
But the trend went back to its original path, and in my opinion, the downtrend will likely continue.
EURUSD will continue to growIt is clear that EUR has broken through the support line, but I don't think the fall will continue. I expect growth to 1.19

#012: LONG Investment Opportunity on EUR/USD
In this scenario, I placed a passive long order on EUR/USD at a key zone that has shown signs of accumulation and institutional defense in recent days.
The price showed bearish manipulation followed by a sharp rebound with a V-shaped pattern, often indicative of stop-loss hunting. In these phases, a direct entry is less effective than a passive strategy aimed at intercepting a possible technical pullback in the zone where abnormal volumes and algorithmic defenses have manifested.
The order was designed to be activated only if the market were to temporarily return to the previously absorbed zone, thus avoiding chasing the price after a directional candlestick.
The stop-loss placement was carefully chosen to avoid both typical retail hunting zones and areas visible to algorithms. It is positioned to ensure operational invisibility, but also consistency with the logic of institutional defense: if reached, the trade will be automatically invalidated.
The target is aligned with the superior technical structure and the normal range of movement that develops when this dynamic is respected.
This operation is designed to be left to operate completely autonomously, without the need for adjustments or active management. Either in or out. The sole objective is to align with institutional flows, with controlled risk and a favorable management structure.

EURUSD Holding Support — Bullish Move in ProgressHello everybody!
There is a strong higher timeframe resistance now acting as support.
Price is respecting this area and starting to form a strong move to the upside.
We are looking to enter a buy position here, as the overall bullish trend is likely to continue.
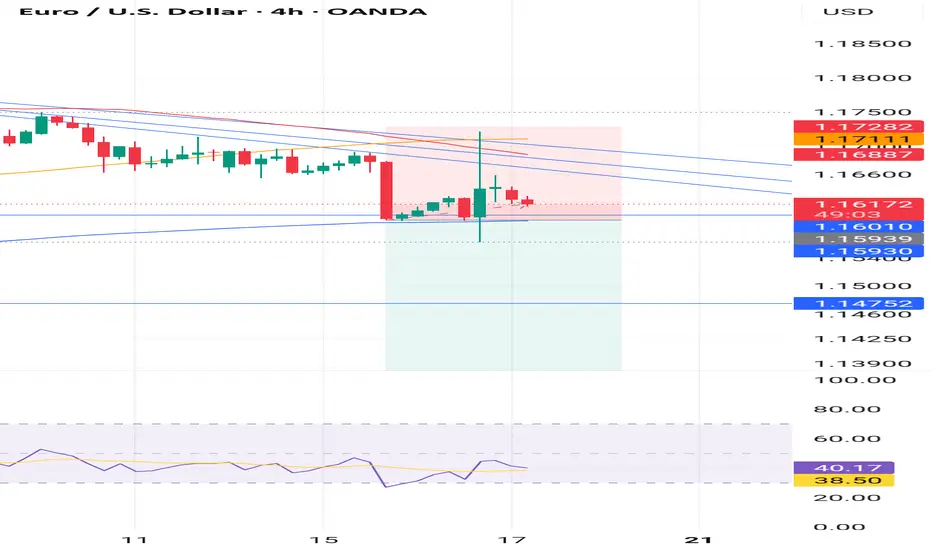
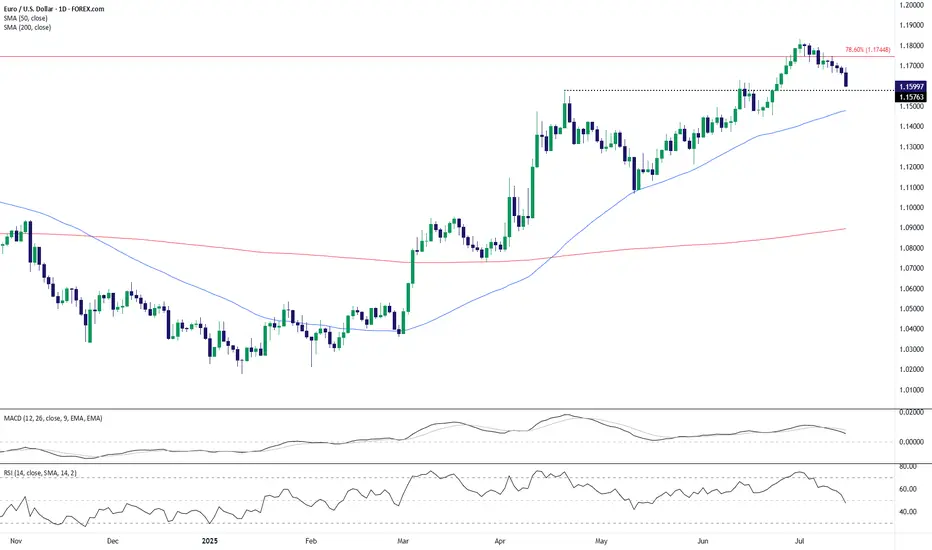
EUR/USD Technical Outlook: Bearish Momentum Builds Below Key ResEUR/USD has broken down from its recent highs near the 1.1750 resistance area, which coincides with the 78.6% Fibonacci retracement level. The pair is now trading around the 1.1600 handle, slipping below a short-term support zone near 1.1576. This breakdown signals potential continuation of bearish pressure in the coming sessions.
The 50-day SMA (1.1477) remains upward sloping, but the price action has now decisively turned lower, with a series of lower highs forming after the July peak. The MACD histogram is fading, indicating waning bullish momentum, and the RSI has dropped to 47.7—losing the bullish bias and heading toward bearish territory.
If EUR/USD cannot reclaim the 1.1576–1.1600 zone quickly, a deeper pullback toward the 50-day SMA or even the 1.1450–1.1500 range may unfold. On the upside, bulls would need to push back above the 1.1750 resistance to regain control, but given the loss of momentum and structure, the near-term bias favors the bears.
-MW
EURUSDEUR/USD shows bullish COT (net longs), but USD’s individual COT is very strong (net longs), which usually means USD strength and EUR/USD bearish pressure.
COT on the pair can lag or reflect speculative flows, while USD’s strength often has bigger impact.

EUR/USD Weekly AMD Breakdown | VolanX Protocol Signal
🧠 EUR/USD Weekly AMD Breakdown | VolanX Protocol Signals Distribution Phase Active
📍 EUR/USD | 1W Chart
📅 July 17, 2025
🧭 Structured by: WaverVanir International LLC
🔗 Powered by VolanX Protocol + DSS Architecture
🧨 Strategic Context:
This isn’t a random retracement—it’s the completion of a full AMD cycle (Accumulation → Manipulation → Distribution), and EUR/USD just exited the manipulation high, confirming the start of a long-term markdown phase.
🧠 Pattern Alignment:
✅ Green Box = Accumulation Zone (Rangebound 2023–early 2025)
🔶 Orange Box = Manipulation Trap (Spring sweep + emotional lows)
⚠️ Grey Box = Distribution (Fast repricing into liquidity pockets)
🔻 Red Line = Markdown begins
Embedded schematic confirms the AMD logic.
This is how institutions engineer macro turns.
📉 VolanX Bearish Targets (2025–2026 Outlook):
🎯 First Target: 1.1022 – Fibonacci & OB confluence
🎯 Secondary Target: 1.0828 – Elliott Wave 3 full extension
🎯 Macro Target: 0.9500 – 2026 narrative climax zone
“Distribution is never announced; it’s only visible in hindsight. But VolanX sees it unfolding in real time.”
⚠️ Invalidations:
A weekly close back above 1.1850 would void this structure.
Momentum confirmation pending from macro catalysts (ECB dovish, Fed delay).
🎯 Trade Strategy:
Bias: Strong short
Entry Zone: Any rally into 1.1700–1.1800 = premium rejection zone
Execution: Build position in tranches, use volume spikes & SMC CHoCHs as confirmation
Risk: Tight stop above 1.1850 (structure invalidation)
🔐 VolanX Strategic Note:
📡 The model confirms that EUR/USD is entering a structurally engineered distribution phase, driven by smart money exit flows, macro policy divergence, and a resurgent USD.
Wave (3) compression is already under way. This is where conviction counts.
⚠️ Educational content only. Not financial advice.
#EURUSD #AMD #SmartMoney #MacroTrading #VolanX #WaverVanir #ForexStrategy #LiquidityTrap #DSS #DistributionPhase
