EURUSD trade ideas

EUR USD short setupwe had lower low so i say it may go further down , consider its Friday we may see ranging market so waiting for over price can be logical ...
Please note: This is for educational purposes only and not a trading signal. These ideas are shared purely for back testing and to exchange views. The goal is to inspire ideas and encourage discussion. If you notice anything wrong, feel free to share your thoughts. In the end, to learn is to share !

EUR/USD Bearish Wave Outlook Into September 2025EUR/USD Bearish Wave Outlook Into September 2025
Technical + Elliott Wave + Macro View
EUR/USD has likely completed a major top at 1.18300, which aligns with the 1.0 Fibonacci extension. This level acted as a liquidity sweep before reversing sharply, marking the top of Wave (1) in the current Elliott sequence. We're now entering Wave (3) to the downside—a high-momentum leg often driven by macro confirmation.
Price has broken the ascending channel and rejected the 0.786 and 0.886 retracement zones. With lower highs forming, the structure is weakening. The next likely target sits around 1.10223, a key Fibonacci and order block confluence. If momentum accelerates, EUR/USD could continue toward 1.08289, completing the full Wave (2).
From a macro lens, the divergence between the Fed and ECB continues to widen. The U.S. economy remains resilient with sticky inflation and strong yields supporting the dollar. In contrast, Europe is showing signs of stagnation, with Germany and France struggling to post meaningful growth. This favors continued downside on the pair.
Expect potential relief rallies into 1.1400–1.1550, but these are likely to be sold unless a fundamental catalyst shifts sentiment.
Bias: Bearish
Targets: 1.1022 > 1.0828
Invalidation: Clean break and close above 1.1700
—
🔔 Watch for volume spikes and failed reclaims of structure as confirmation. DSS signals aligned.
#EURUSD #Forex #ElliottWave #SmartMoneyConcepts #MacroTrading #WaverVanir #VolanX #DollarStrength #FXForecast #TechnicalAnalysis

Bearish Breakdown on EUR/USD: Support Flip and Short SetupThis EUR/USD 1-hour chart shows a bearish setup after price breaks below a rising support trendline. A potential short trade is indicated, with a stop loss at 1.16453 and a target at 1.15779. The highlighted green zone marks a key support-turned-resistance area.

End of correction and trend continuation towards 1.195?EURUSD is in an important support area, retesting the bottom line of the wedge. I'm loking foward for any sign of reversal from here.

CHECK EURUSD SIGNAL READ CAPTAIN📍 Trade Setup Overview
Trade Direction: Short (sell)
Entry Point: Around 1.16600 1.16530
Stop Loss: Around 1.16900
🎯 Target Levels
Take Profit 1:
1.16250
Take Profit 2:
1.15800
Last Target:
1.15500

EUR/USD Stuck at Channel Midline — Bearish Bias Still in PlayUpdate on Previous Analysis
Since there are no major economic events scheduled for today, we expect lower volatility and a relatively calmer market, unless any unexpected news hits the wires.
Looking at the chart, price is still moving within a descending channel, and it's currently reacting around a key zone — an area of previous price congestion that also aligns with the midline of the channel.
Our bias remains bearish on the euro, unless the market gives us clear bullish reversal signals. Until then, we continue to follow the trend.
EUR/USD Fibonacci Resistance - Rising Wedge BreakEUR/USD came into Q3 with a full head of steam, setting a fresh three-year high on the first day of the new quarter. But bulls couldn't make much progress after that and a key Fibonacci retracement continued to hold buyers at bay, until eventually sellers were able to take-over and make a more noticeable dent after this morning's CPI data.
The breakout in USD helped to prod a breakdown in EUR/USD, and bears now have an open door to run a short-term trend. There's now resistance potential at prior support of 1.1631 and 1.1663, and there's deeper support potential at 1.1543 and 1.1457. - js

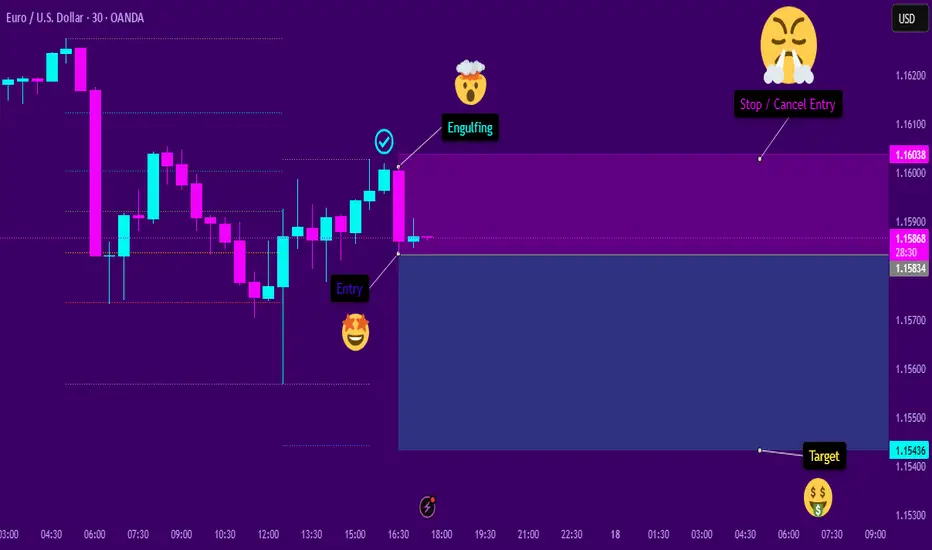
EURUSD📉 EURUSD – 30min Short Plan
📊 Structure: LLs & LHs forming – bearish trend confirmed
🕯️ Pattern: Bearish Engulfing at Lower High
🎯 Entry: instant
📌 Trade 1
– 🎯 TP1: 1:1
– ⚠️ Risk: 1%
📌 Trade 2
– 🎯 TP2: larger reward
🛠️ Execution:
– Place both trades at same entry
– Trail SL after TP1 hit
📎 Bias: Bearish

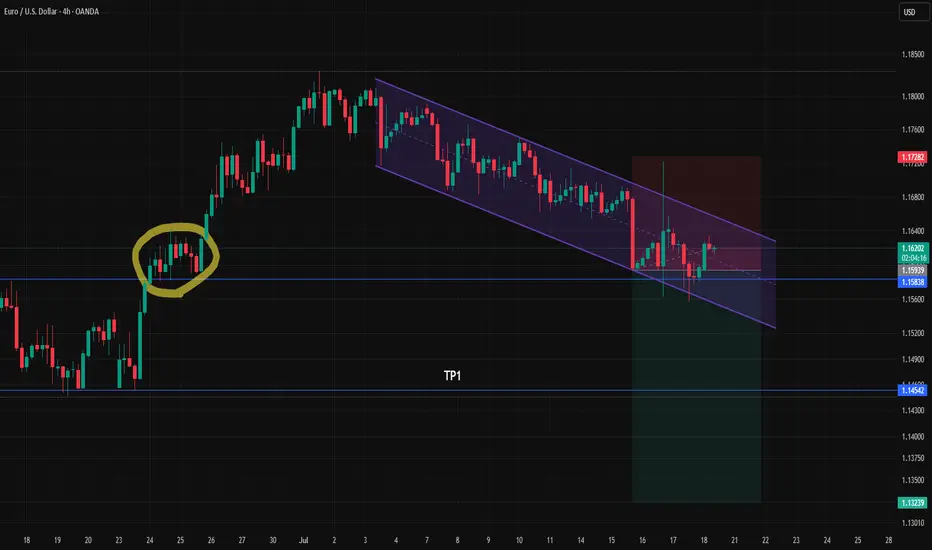
"EUR/USD Reversal Setup: Breakout Potential from Descending ChanThis EUR/USD 4-hour chart shows a potential bullish reversal from a descending channel. Price is approaching a key support area around 1.15621, with a projected breakout targeting the 1.16940–1.17199 resistance zone. The chart suggests a possible upward move if support holds.

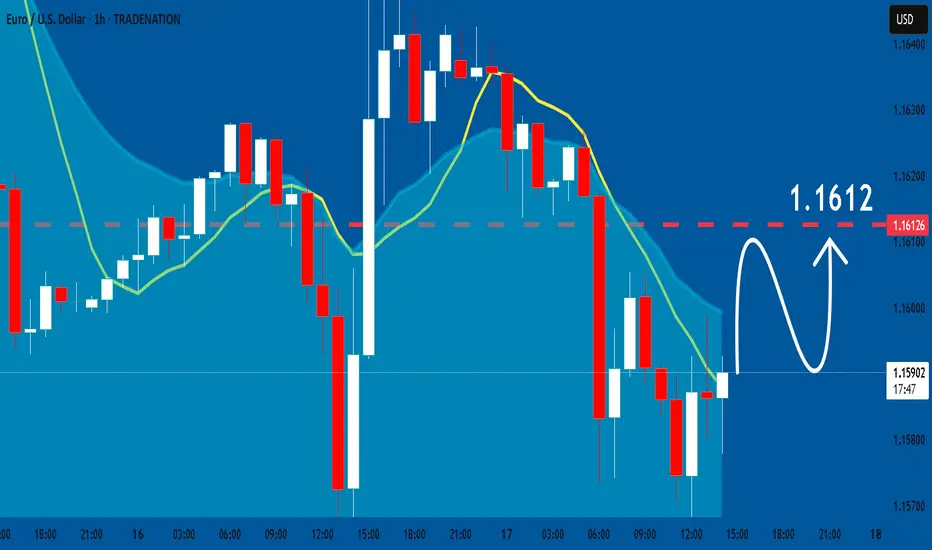
EURUSD: Bulls Will Push
Balance of buyers and sellers on the EURUSD pair, that is best felt when all the timeframes are analyzed properly is shifting in favor of the buyers, therefore is it only natural that we go long on the pair.
Disclosure: I am part of Trade Nation's Influencer program and receive a monthly fee for using their TradingView charts in my analysis.
❤️ Please, support our work with like & comment! ❤️
EURUSD The 4H MA200 distinguishes bullish from bearish.The EURUSD pair has been trading within a (blue) 2-month Channel Up since the May 12 Low and it just broke below its 4H MA100 (green trend-line). The previous two Bearish Legs of this pattern bottomed (made a Higher Low) on or just above the 0.5 Fibonacci retracement level.
As a result, the price is very close to the most optimal buy level of this pattern and as long as it holds, we expect to start the new Bullish Leg and target the 1.5 Fibonacci extension (1.20000 our Target just below), which is in line with the previous two Bullish Legs.
If however the 4H MA200 (orange trend-line) breaks, we will take the loss on that long and go short as technically the price should seek the bottom of the (dotted) wider Channel Up. Our Target on that occasion will be 1.14000, right at the top of the High Volatility Zone.
-------------------------------------------------------------------------------
** Please LIKE 👍, FOLLOW ✅, SHARE 🙌 and COMMENT ✍ if you enjoy this idea! Also share your ideas and charts in the comments section below! This is best way to keep it relevant, support us, keep the content here free and allow the idea to reach as many people as possible. **
-------------------------------------------------------------------------------
Disclosure: I am part of Trade Nation's Influencer program and receive a monthly fee for using their TradingView charts in my analysis.
💸💸💸💸💸💸
👇 👇 👇 👇 👇 👇

Long EURUSDI want to long EURUSD here, kinda looks nice.
Good risk reward, expecting a rejection in this area.
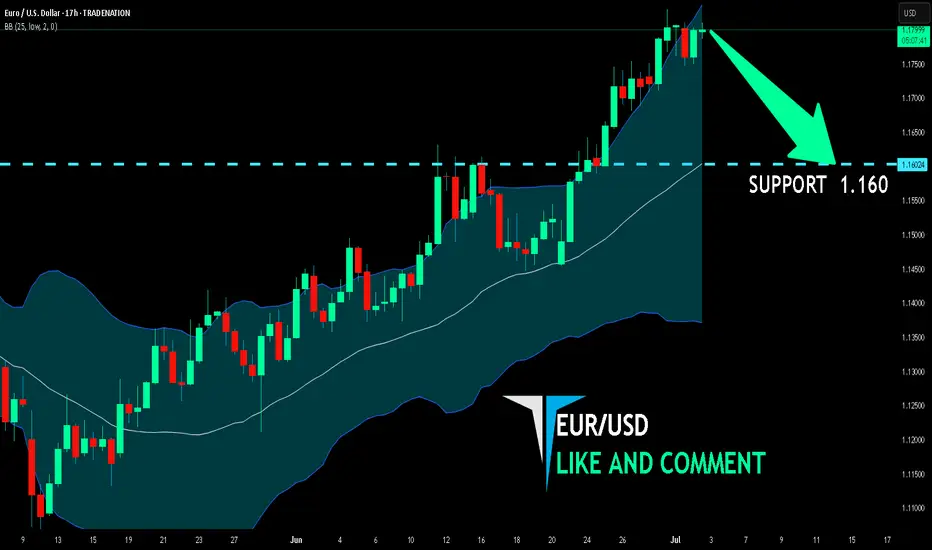
EUR/USD BEST PLACE TO SELL FROM|SHORT
Hello, Friends!
EUR/USD pair is trading in a local downtrend which know by looking at the previous 1W candle which is red. On the 17H timeframe the pair is going up. The pair is overbought because the price is close to the upper band of the BB indicator. So we are looking to sell the pair with the upper BB line acting as resistance. The next target is 1.160 area.
Disclosure: I am part of Trade Nation's Influencer program and receive a monthly fee for using their TradingView charts in my analysis.
✅LIKE AND COMMENT MY IDEAS✅
Engulfing SellThe asset shows signs of continuation in a downtrend. After a significant retracement at a favorable Fibonacci level, a bearish engulfing pattern appeared. This engulfing pattern resulted in a behavioral shift, causing the temporary pullback to resume its decline. I believe this will be the case, provided that the subsequent candlesticks confirm the entry signal.
ATM_GS : We are nearing...
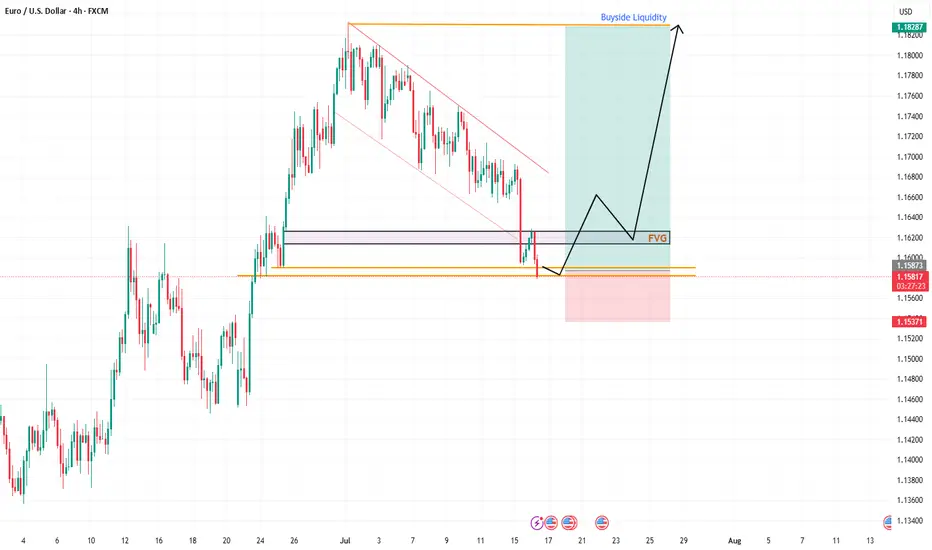
EU's Wild Drop: A Sneaky Trap or Reversal Time?Hey Fellow Traders! 😎
What a ride yesterday, right? The EUR/USD took a massive plunge, smashing through the descending channel like a wrecking ball and sweeping up all that liquidity. 💥 But hold up—was that just a clever market manipulation to shake out the bulls? I think so! 🧠
Right now, the price is chilling in a Daily Fair Value Gap (FVG), and I’m expecting some serious action here. This could be the perfect setup for a reversal! The market makers pulled a fast one—tricking bullish traders into flipping bearish after that dramatic drop. But guess what? That’s the trap! 🕸️ Don’t fall for it.
I’m eyeing a long entry right at this level. Here’s the plan:
Entry: Right now—let’s catch this wave! 🌊
Stop Loss: Set it tight around 1.15360 to keep risk in check.
Take Profit: Aiming for those juicy highs (check the chart I shared in my last post for the exact levels). 📈
This setup is screaming opportunity, so let’s talk about it! 💬 What’s your take—are we reversing or is the market still playing games? Drop your thoughts below, smash that Like button if you’re with me, and Follow for more trade ideas! 🚀 Let’s keep the community buzzing. 🐝
#Trading #EURUSD #MarketAnalysis #ReversalSetup
EURUSD Good buy opportunityTime to buy EURUSD with CPI
EURUSD has broken the Trend Line liquidity and is ready to continue the upward trend.

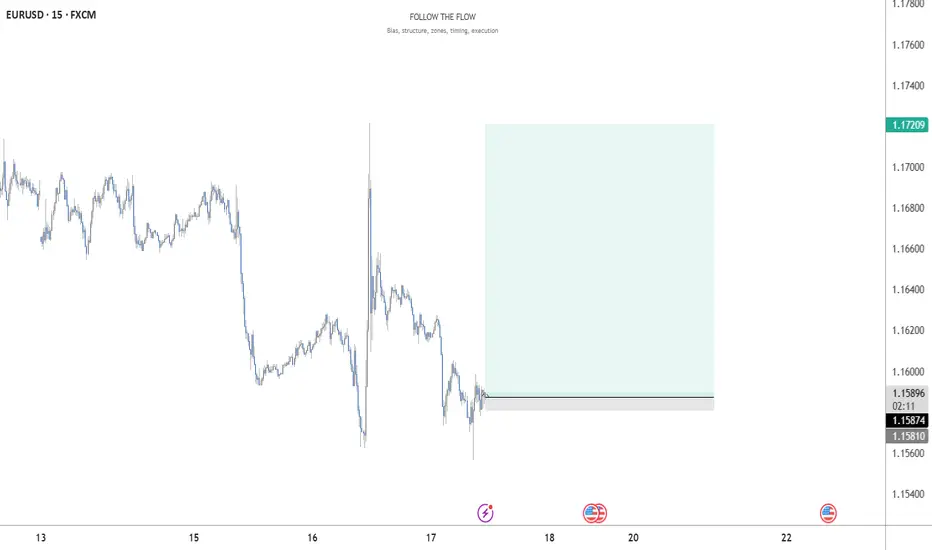
EURusd short position 18/07/2025English : According to our analysis, we anticipate a bearish scenario.
Morocan Darija : kanchofo d'apres l'analyse dyalna antsanaw hboot
ATENTION : I only share my ideas, not signals

Eurousd techinical analysis.Eurousd techinical analysis next move posibale at h1 time frame.not finchinal advice.

EUR/USD LIVE TRADE UPDATEWe have been short in this market since Monday and although we did get a nice move down it did not hit our profit target and has been heading back up, resistance at the current price action should work in our favor and move this market back down.

Time to buy EURUSD nowLooking at the daily time frame we can see that EURUSD has respected a rising trend line which is acting as a critical support for the uptrend.
Going forward, we are bullish bias and we anticipate the price to reach a target of 1.20.
🎯 Target profit:1.18000,1.19000,1.20000


EUR USD longcan be a short term possibility and maybe not let see , today market is so unstructured from yesterday news lets experience ...
Please note: This is for educational purposes only and not a trading signal. These ideas are shared purely for back testing and to exchange views. The goal is to inspire ideas and encourage discussion. If you notice anything wrong, feel free to share your thoughts. In the end, to learn is to share !
