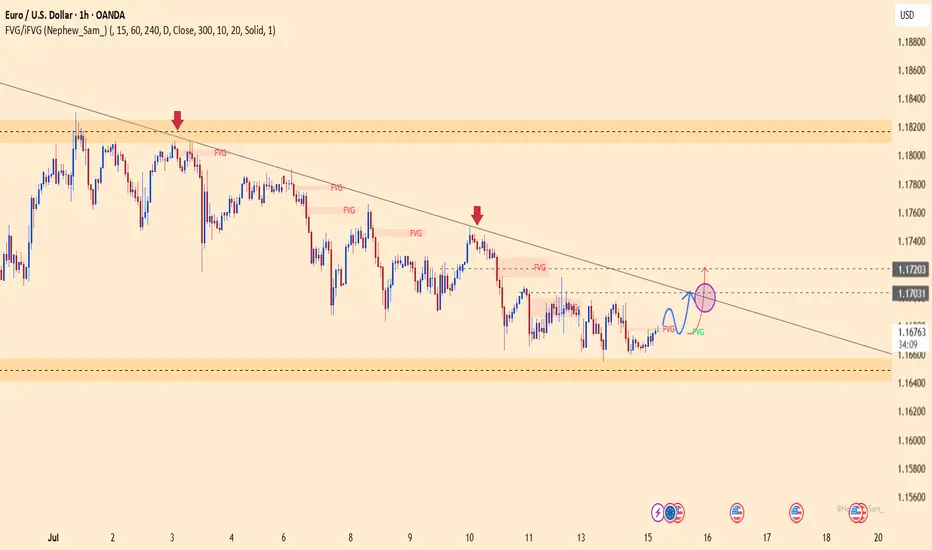
EURUSD – Bullish Momentum ReturnsEURUSD is gradually breaking free from downward pressure as it breaches the short-term accumulation structure, aiming for the resistance zone around 1.1720. On the chart, a clear bullish trend is emerging, supported by FVG signals reinforcing the recovery.
On the news front, expectations are rising that the European Central Bank will maintain a tighter policy stance for longer, as core inflation in the Eurozone remains elevated. Meanwhile, the USD is under corrective pressure following last week’s lower-than-expected U.S. CPI data. Upcoming statements from ECB and Fed officials today will be key in determining the next move for this currency pair.
Unless a surprise arises from the U.S. side, EURUSD is likely to sustain its short-term upward momentum and test the next technical resistance area.
EURUSD trade ideas
EURUSD H1 I Bearish Reversal Based on the H1 chart, the price is approaching our sell entry level at 1.1641,an overlap resistance.
Our take profit is set at 1.1601, a pullback support.
The stop loss is set at 1.1670, a swing high resistance.
High Risk Investment Warning
Trading Forex/CFDs on margin carries a high level of risk and may not be suitable for all investors. Leverage can work against you.
Stratos Markets Limited (tradu.com ):
CFDs are complex instruments and come with a high risk of losing money rapidly due to leverage. 66% of retail investor accounts lose money when trading CFDs with this provider. You should consider whether you understand how CFDs work and whether you can afford to take the high risk of losing your money.
Stratos Europe Ltd (tradu.com ):
CFDs are complex instruments and come with a high risk of losing money rapidly due to leverage. 66% of retail investor accounts lose money when trading CFDs with this provider. You should consider whether you understand how CFDs work and whether you can afford to take the high risk of losing your money.
Stratos Global LLC (tradu.com ):
Losses can exceed deposits.
Please be advised that the information presented on TradingView is provided to Tradu (‘Company’, ‘we’) by a third-party provider (‘TFA Global Pte Ltd’). Please be reminded that you are solely responsible for the trading decisions on your account. There is a very high degree of risk involved in trading. Any information and/or content is intended entirely for research, educational and informational purposes only and does not constitute investment or consultation advice or investment strategy. The information is not tailored to the investment needs of any specific person and therefore does not involve a consideration of any of the investment objectives, financial situation or needs of any viewer that may receive it. Kindly also note that past performance is not a reliable indicator of future results. Actual results may differ materially from those anticipated in forward-looking or past performance statements. We assume no liability as to the accuracy or completeness of any of the information and/or content provided herein and the Company cannot be held responsible for any omission, mistake nor for any loss or damage including without limitation to any loss of profit which may arise from reliance on any information supplied by TFA Global Pte Ltd.
The speaker(s) is neither an employee, agent nor representative of Tradu and is therefore acting independently. The opinions given are their own, constitute general market commentary, and do not constitute the opinion or advice of Tradu or any form of personal or investment advice. Tradu neither endorses nor guarantees offerings of third-party speakers, nor is Tradu responsible for the content, veracity or opinions of third-party speakers, presenters or participants.

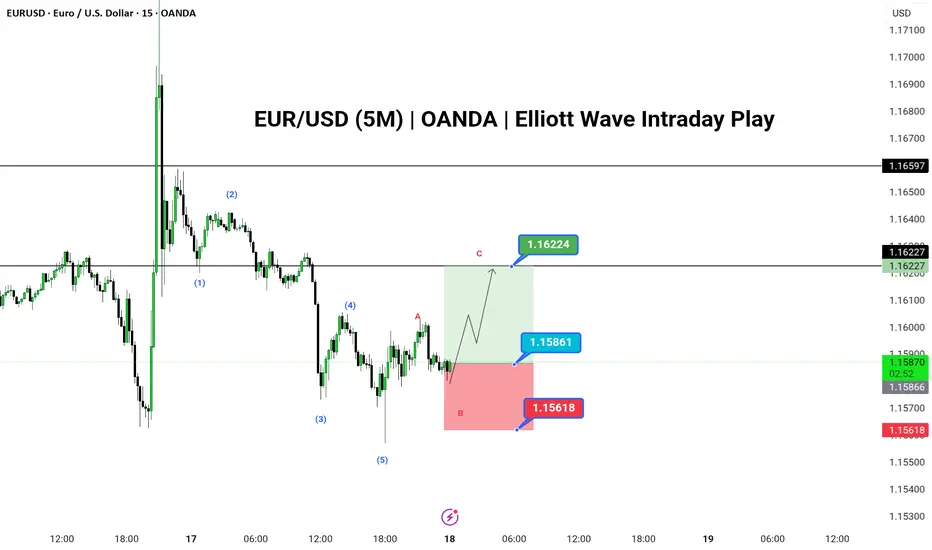
EUR/USD Bullish Setup in Progress as Wave C Targets 1.1622
🟢 LONG BIAS
📅 Updated: July 16
EUR/USD has completed a clean 5-wave impulse structure to the downside, followed by an unfolding ABC corrective pattern on the 5-minute chart. With Wave A and the ongoing B leg nearing completion, bulls may look to capitalize on a Wave C rally toward the 1.1622 resistance zone.
The structure suggests a temporary bullish move within a broader correction. Entry near the 1.1586 level offers a solid R:R setup, with invalidation below 1.1561. This setup is ideal for short-term intraday traders using Elliott Wave theory and expecting a 3-wave corrective rally.
---
📊 Technical Structure (5M)
✅ 5-wave bearish impulse labeled (1)-(5) complete
✅ ABC correction developing (currently in Wave B)
✅ Potential for bullish continuation via Wave C
📌 Upside Target
✅ Final: 1.16224
🔻 Risk Zone
❌ Invalidation: Below 1.15618
---
📈 Market Context
USD Consolidation: Dollar index pauses after strong rally, offering intraday relief to majors.
Euro Support: Mild bid across EUR crosses, offering stability in low-timeframe setups.
No High-Impact News: Ideal technical environment for short-term wave trading.
---
⚠️ Risks to Watch
Breakdown below 1.1561 would invalidate the structure.
Sudden volatility from unscheduled news.
Failure of Wave C to reach projected resistance.
---
🧭 Summary: Bias and Watchpoints
EUR/USD is setting up for a potential Wave C move toward 1.1622 as the ABC corrective structure plays out. Bullish bias holds above 1.1561 with a high-probability setup unfolding for short-term wave traders. Watch for price reaction near 1.1586 and use tight risk control.
EURUSD BUY SOONEUR/USD extends its daily slide and trades deep in the red below 1.1600 in the American session on Thursday. The US Dollar (USD) benefits from the better-than-expected Jobless Claims and Retail Sales data, not allowing the pair to hold its ground.

EURUSD BUY IDEAWe can anticipate buy setup on EURUSD to close up those imbalance caused my yesterday's news.

EURUSD Potentially BearishHi there,
EURUSD appears bearish at H1 and needs to break the dashed green trend line for a price target of 1.16511 for a bias of 1.16373.
Happy Trading
Not trading advice.

EURUSD under pressure despite Powell being on his way outEURUSD remains under pressure as US jobless claims improve and Powell appears to be on his way out. Still, the impact has been limited, and the broader trend remains upward. With growing speculation around Powell’s replacement, the market may look to form a bottom.
This content is not directed to residents of the EU or UK. Any opinions, news, research, analyses, prices or other information contained on this website is provided as general market commentary and does not constitute investment advice. ThinkMarkets will not accept liability for any loss or damage including, without limitation, to any loss of profit which may arise directly or indirectly from use of or reliance on such information.

EURUSD BUYThe EUR/USD pair edged lower in the past week, settling a handful of pips below the 1.1700 mark, further retreating from the multi-year peak posted early in July at 1.1830. Financial markets kept revolving around the United States (US) President Donald Trump's targets. With geopolitical woes cooling down, Trump’s focus returned to tariffs, and the Federal Reserve’s (Fed) wait-and-see stance on monetary policy.
Trump fixated on tariffs and Powell
Since the week started, speculative interest kept their eyes on the July 9 tariffs deadline. Trump announced massive retaliatory levies on over 180 trading partners in May, quickly establishing a 90-day grace period afterwards. His goal was to clinch better trade deals with all these nations. But as the date loomed, deals were scarce. The US made some trade arrangements with some minor economies, such as Vietnam, but there were none with major counterparts, nor, of course, with China
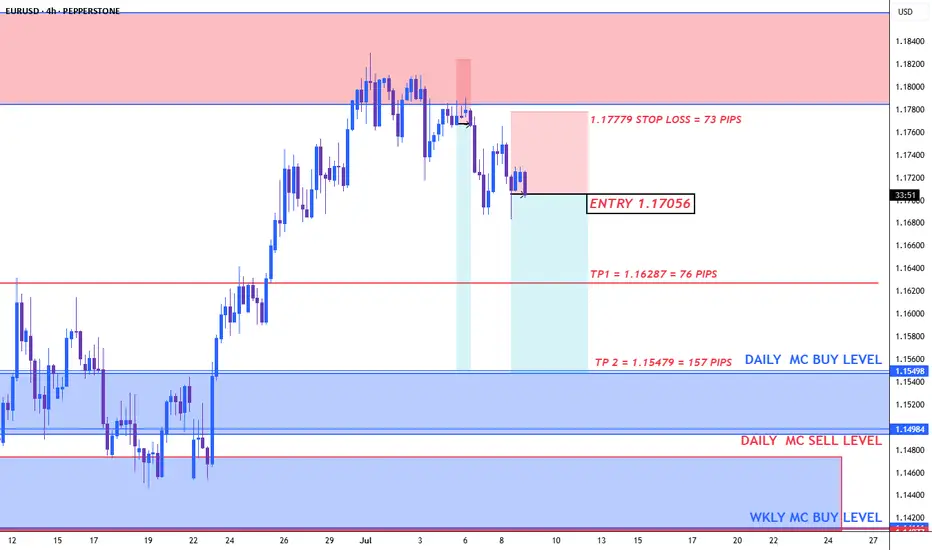
TP 1 1.162
TP 2 1.165
TP 3 1.168
RESISTANCE 1.154


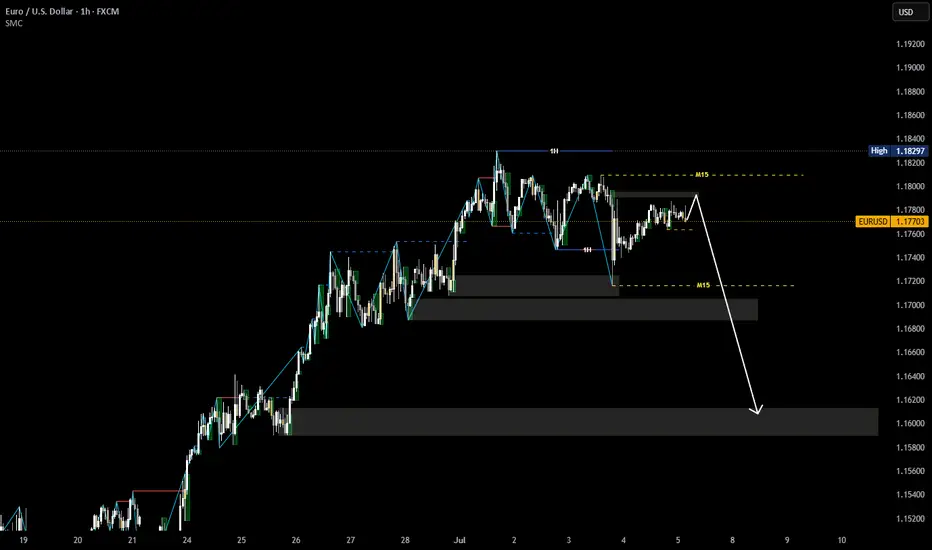
EURUSD - BEARISH TREND CONTINUESEURUSD - BEARISH TREND CONTINUES📉
On Tuesday, despite the bullish divergence (highlighted as green on RSI), the price broke through the trendline, formed since the beginning of May. Yesterday this trendline got retested on Bloomberg's rumor that Powell may resign. Currently the price is going through the support level of 1.16000.
I see the major way is to go towards 1.15000 support level with a further rebound and possible target of 1.16000. Another option is to go straight towards 1.14000. Will see.

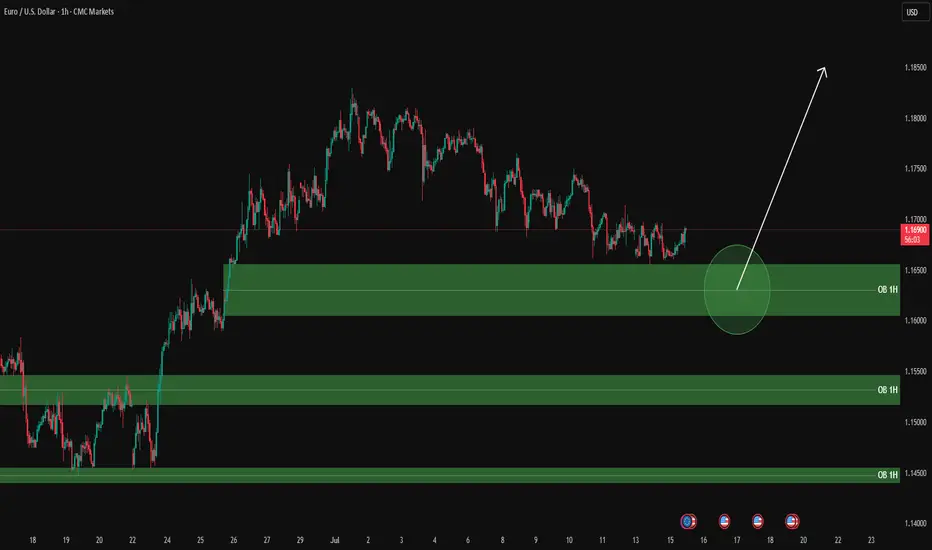
EURUSD analysis – 1H OB Setup
✅ Green zones = 1H Buy Order Blocks
Clean plan:
Wait for price to reach the green circle zone (1.1600 – 1.1650 OB).
Once there:
✅ Drop to LTF (5M / 3M) and wait for:
Price reaction to the OB zone
BOS / CHoCH structure confirmation
Strong bullish candle for clean entry
Then, enter with stop below the OB zone.
🎯 Targets:
First TP: 1.1690 – 1.1700
Second TP: higher previous highs if momentum continues
⚠️ Let price enter your zone, get your LTF confirmations, and then take your entry with discipline.
📊 ProfitaminFX | Gold, BTC & EUR/USD
📚 Daily setups & educational trades
EURUSD : The trend is still downAfter what Trump said last night, the trend is still down.
I will keep selling.
If we look carefully, 'they' did tell us beforehand that we should keep selling. Just know where to look.
Good luck, and let's make lots of money.

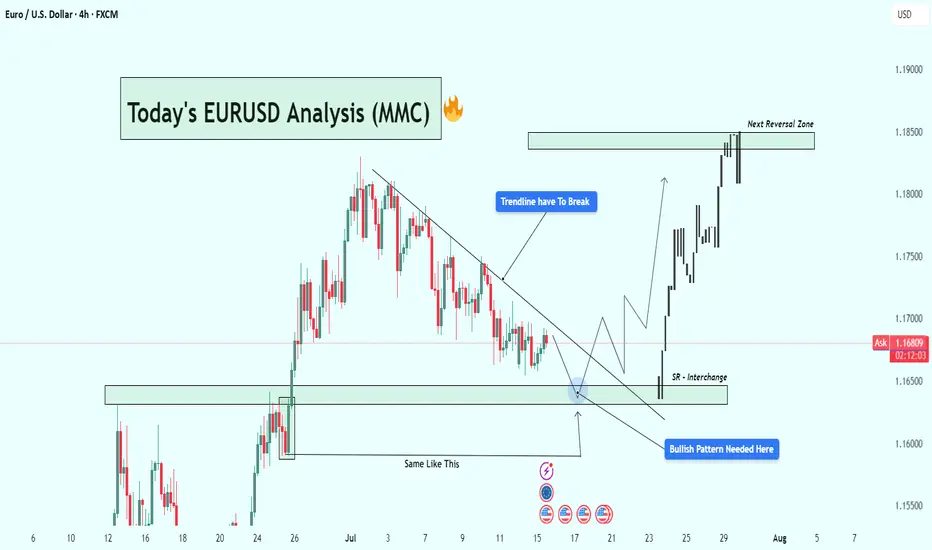
EURUSD Analysis : Eyes on Bullish Breakout Setup + Target🧭 Current Market Context:
The EURUSD pair is currently trading near 1.16765 on the 4H timeframe, displaying classic accumulation behavior at a key Support-Resistance Interchange Zone (SR Flip). After an extended bearish correction from the previous swing high, price has started compressing in a descending structure underneath a well-respected trendline. This tightening range near a historic support zone suggests that a major breakout could be on the horizon.
🧠 Technical Confluences:
🔹 1. Descending Trendline - Bearish Control Line:
The trendline drawn from the July highs has acted as a clear resistance line, rejecting multiple bullish attempts to break higher.
Price has failed to close above it on the 4H chart, showing sellers are still in control—but momentum is fading.
A breakout of this line is a crucial confirmation of buyer strength returning.
🔹 2. SR Flip Zone - Interchange Area:
This zone previously acted as resistance, capping the rally in June.
After price broke above it, the same area now acts as support, confirming its role as an SR flip zone—a textbook demand level.
Smart money often steps in at these interchange areas to accumulate long positions.
🔹 3. Re-accumulation Phase (Smart Money Behavior):
Market structure is showing a rounded bottom formation, hinting at possible absorption of sell-side liquidity.
Price action is compressing into the support zone, reducing volatility—a signal that a reversal or breakout is near.
The previous similar move ("Same Like This") from late June led to a strong bullish impulsive wave—this historical behavior adds confidence in the current bullish outlook.
🔹 4. Potential Bullish Pattern:
Price needs to develop a bullish reversal pattern (e.g., inverse head & shoulders, bullish engulfing, or a sweep of the low with rejection).
Only then will the setup be validated. This is not a blind buy zone, but a zone of interest for high-probability longs if price confirms.
🧨 Trade Plan Scenarios:
✅ Scenario 1 - Confirmation Breakout:
Wait for a clean breakout above the descending trendline.
Enter on breakout + retest structure.
Target the next major reversal zone at 1.18500.
🐢 Scenario 2 - Early Long Entry:
Enter on bullish confirmation (engulfing, pin bar, etc.) at the SR Interchange zone.
Stop loss below the support box.
Ride early for better R:R if the breakout confirms.
❌ Invalidation:
A clean breakdown below 1.1600 with momentum will invalidate the bullish bias.
In that case, reevaluate based on new structure.
📊 Projected Path:
If the trendline breaks, expect a bullish rally toward the next major resistance zone (1.18500).
That zone has historically acted as a major reversal and profit-taking level for bulls, and we expect price to react again if tested.
🔍 Macro View (Optional Insight):
USD may show weakness due to macro data (CPI/FED talks), helping EURUSD lift.
Eurozone data stability could further fuel demand for EUR.
📌 Final Thoughts:
This EURUSD setup is forming at a high-value area, backed by technical structure, historical behavior, and smart money positioning. If the price reacts positively from this zone and breaks the descending trendline, it could trigger a bullish leg toward 1.18500, offering a rewarding risk-to-reward opportunity for both swing and short-term traders.
Stay patient. Let the market confirm the direction before execution. 📈
EUR/USD –Bullish Flag After Long Term Trend Shift: Is 1.20 Next?📌 In my previous EUR/USD analysis, I mentioned that the long-term trend likely reversed, and we could see a move toward the 1.23 zone in the medium to longer term.
That view is playing out.
Recently, the pair printed a new local high above 1.18, confirming the trend change.
📉 After this rise, EUR/USD pulled back –but the structure is clearly corrective: overlapping and a classic bullish flag formation.
What's next?
This correction looks close to completion, and bulls may soon return to push toward the key 1.20 level.
Trading Plan:
The 1.1620–1.1650 area stands out as a strong confluence zone – ideal for looking for buying opportunities.
The trend has changed. The setup is forming. Now it’s about timing.
Disclosure: I am part of TradeNation's Influencer program and receive a monthly fee for using their TradingView charts in my analyses and educational articles.

EURUSD Seller in controlEURUSD made a strong rejection toward resistant which hint that it will going down again.
I'm expecting a pullback toward resistant zone again.
waiting confirmation price action in a lower timeframe for a minimum drawdown.
good luck.

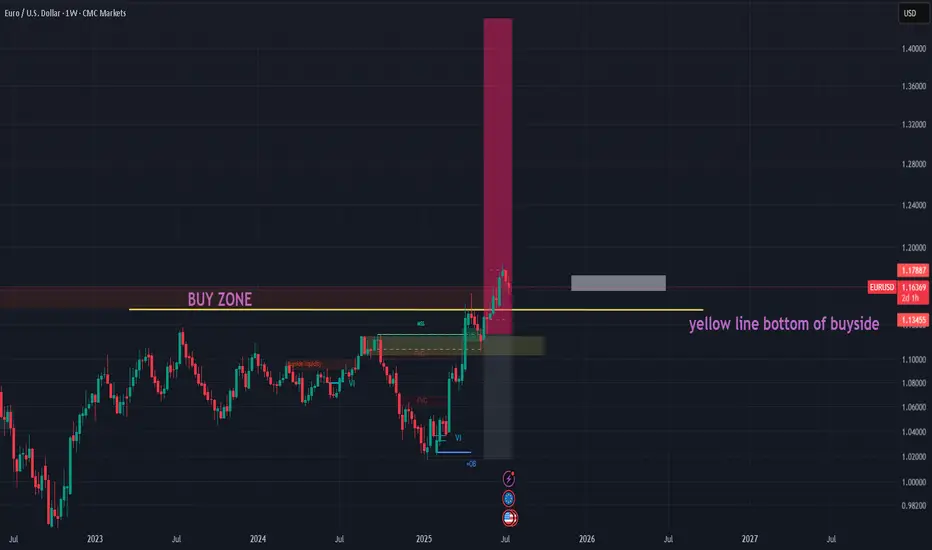
EURUSD BUY IDEA SWING PLAY (WEEKLY) Outlook🔁 EUR/USD Long – Weekly Buyside Re-Test for 1.17 Breakout 🌍📈
Description:
EUR/USD is retesting a weekly buyside liquidity zone between 1.1575–1.1600, which previously acted as strong resistance and has now flipped into support. This zone aligns with a confluence of breakout structure, Fibonacci mid-point, and a clean liquidity sweep beneath local lows.
📉 Trade Setup:
Entry Zone: 1.1475–1.1600 (buyside retest)
Stop Loss: 1.1400 Zone (risker)
Safer stop: use chart
Target 1: 1.1777
Target 2: 1.1877
Target 3: Open(manage)
Risk-Reward: ~1:3+ depending on entry precision
Trade Type: Swing / Trend Continuation
📊 Technical Bias:
Weekly structure flipped bullish after breakout above 1.1575
Daily shows clean HH/HL sequence with strong momentum
RSI/MACD favor continuation with no divergence yet
DXY weakness supports continuation move
🧠 Macro + Sentiment Overlay:
EUR supported by improving Eurozone data + reduced ECB dovishness
Fed pause expectations + soft US CPI drive USD weakness
Retail sentiment shows most traders are short EUR/USD — contrarian bullish
⏳ Patience:
Let price stabilize in the 1.1575–1.1600 zone with a bullish engulfing or H4 reversal signal before execution. Structure invalidation below 1.1530.
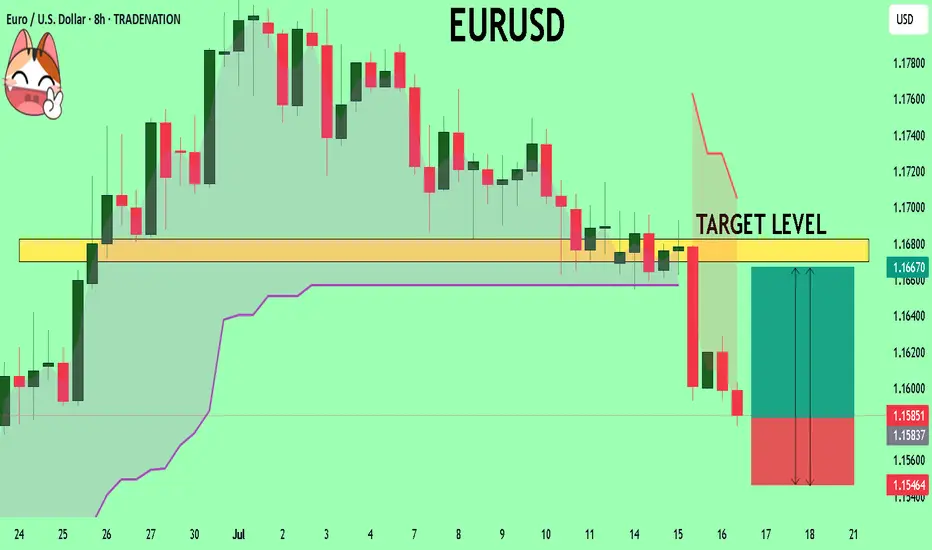
sell idea on EURUSDI LIKE THIS 4HR SETUP. eurusd is pushing in bearish mode as the dxy is correcting up.. I feel like we can reach these two targets if we can break below this next consolidation
two targets as the second target would be good place to exit hitting that next strong area of support
EURUSD My Opinion! BUY!
My dear friends,
Please, find my technical outlook for EURUSD below:
The price is coiling around a solid key level - 1.1584
Bias - Bullish
Technical Indicators: Pivot Points Low anticipates a potential price reversal.
Super trend shows a clear buy, giving a perfect indicators' convergence.
Goal - 1.1670
Safe Stop Loss - 1.1546
About Used Indicators:
The pivot point itself is simply the average of the high, low and closing prices from the previous trading day.
Disclosure: I am part of Trade Nation's Influencer program and receive a monthly fee for using their TradingView charts in my analysis.
———————————
WISH YOU ALL LUCK
7.16 EUR/USD LIVE TRADE UPDATE DAY 3This market made a very nice down candle yesterday and then pulled back a little, currently it looks to be heading down again. We are looking for this market to make new lows on the current down momentum.

EURusd short position 16/07/2025English : According to our analysis, we anticipate a bearish scenario.
Morocan Darija : kanchofo d'apres l'analyse dyalna antsanaw hboot
ATENTION : I only share my ideas, not signals

EURUSD Will Go Down! Short!
Take a look at our analysis for EURUSD.
Time Frame: 15m
Current Trend: Bearish
Sentiment: Overbought (based on 7-period RSI)
Forecast: Bearish
The market is testing a major horizontal structure 1.161.
Taking into consideration the structure & trend analysis, I believe that the market will reach 1.159 level soon.
P.S
Please, note that an oversold/overbought condition can last for a long time, and therefore being oversold/overbought doesn't mean a price rally will come soon, or at all.
Disclosure: I am part of Trade Nation's Influencer program and receive a monthly fee for using their TradingView charts in my analysis.
Like and subscribe and comment my ideas if you enjoy them!

EURUSD : Status @ 15/7Direction: Sell
Signal triggered: 15/7/2025
Stop when:
a) Stop Loss @ 1.1700 ; or if
b) Buy signal triggered
Action:
Sell the rally
Good luck.

EURUSD structure analysis on M15 and H1- 4H swing is bullish, currently is pullback
- 1H, M15 swing is bearish, current is pullback.
- We can look for selling opportunities according to the wave configuration of H1 and M15 timeframes