EUR/USD Idea for SHORT4h time frame + real volume + market structure + 5 of RMA (10/20/30/40/50) = SHORT !!!
EURUSD trade ideas


eurusd Short position sell 20 to 30 pips Eur usd short position sell 20 to 30 pips .
If you want to learn this analysis system free free contrect with me .

EURUSD – DAILY FORECAST Q3 | W32 | D4 | Y25📊 EURUSD – DAILY FORECAST
Q3 | W32 | D4 | Y25
Daily Forecast 🔍📅
Here’s a short diagnosis of the current chart setup 🧠📈
Higher time frame order blocks have been identified — these are our patient points of interest 🎯🧭.
It’s crucial to wait for a confirmed break of structure 🧱✅ before forming a directional bias.
This keeps us disciplined and aligned with what price action is truly telling us.
📈 Risk Management Protocols
🔑 Core principles:
Max 1% risk per trade
Only execute at pre-identified levels
Use alerts, not emotion
Stick to your RR plan — minimum 1:2
🧠 You’re not paid for how many trades you take, you’re paid for how well you manage risk.
🧠 Weekly FRGNT Insight
"Trade what the market gives, not what your ego wants."
Stay mechanical. Stay focused. Let the probabilities work.
FX:EURUSD

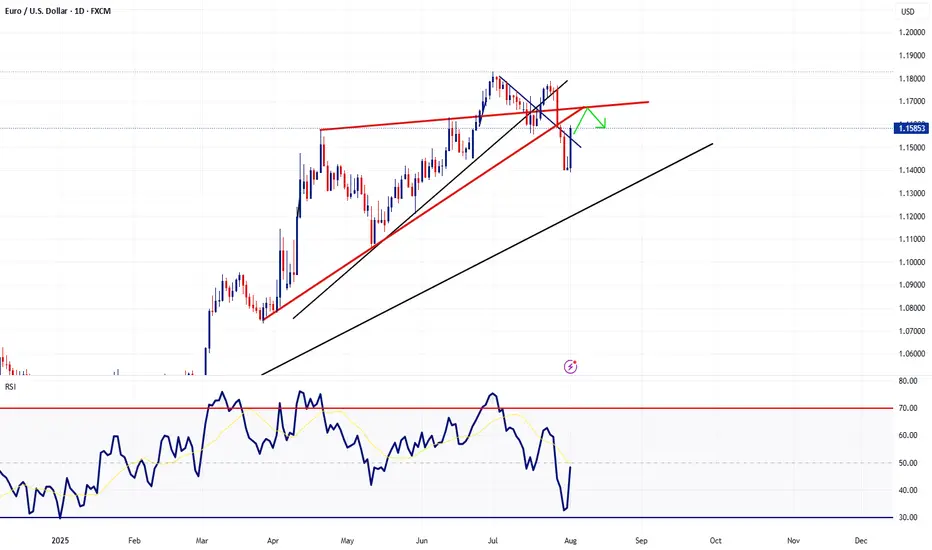
EURUSD(20250804) Today's AnalysisMarket News:
① The US non-farm payrolls rose by 73,000 jobs in July, far below the expected 110,000; the previous two months saw a significant downward revision of 258,000 jobs, prompting traders to fully price in two Fed rate cuts before the end of the year.
② The US ISM Manufacturing PMI for July unexpectedly fell to 48, below the expected 49.5 and the lowest level since October 2024.
③ The University of Michigan Consumer Confidence Index for July reached a five-month high.
Technical Analysis:
Today's Buy/Sell Levels:
1.1524
Support and Resistance Levels:
1.1727
1.1651
1.1602
1.1446
1.1397
1.1321
Trading Strategy:
On a break above 1.1602, consider a buy entry, with the first target price at 1.1651. On a break below 1.1524, consider a sell entry, with the first target price at 1.1446.

EUR/USD Technical OutlookEUR/USD is currently trading within a Descending Triangle formation. At present, the pair shows a higher probability of an upside breakout from this structure. A confirmed break above the immediate resistance zone at 1.1428 – 1.1430 could accelerate bullish momentum, opening the way toward the next key resistance level at 1.1485.
On the other hand, if the pair fails to sustain above the triangle and breaks to the downside, price may extend losses toward the 1.1375 – 1.1360 support area. From this zone, a potential corrective rebound could occur before the broader bearish trend resumes.
Overall, short-term direction hinges on the breakout of the descending triangle, with 1.1428 – 1.1430 as the critical level to watch for bulls, and 1.1375 – 1.1360 for bears. FOREXCOM:EURUSD


EUR/USD Macro Drift — 2000-Pip Collapse Ladder Initiated🧠 Idea Title:
EUR/USD Macro Drift — 2000-Pip Collapse Ladder Initiated
⸻
📍 Idea Overview:
Following the invalidation of the prior bullish thesis, EUR/USD has re-engaged its macro Renko trajectory, confirming a bearish reversal from the 1.159x region. The Codex macro brick logic now signals a fresh 2000-pip descent targeting 1.1000 → 1.0000 → 0.8000.
Stacked entries between 1.1590 and 1.1550 align with the reactivation of the downward drift field. The latest momentum confirms the activation of the bearish ladder.
⸻
🔻 Current Active Positions:
• Sell Ladder: 1.1590 → 1.15500 (5 layered entries,
• Total Risk: SL anchored above 1.1600
• Macro Targets:
• TP1: 1.1000
• TP2: 1.0000
• TP3 (deep collapse): 0.8000
⸻
🧠 Codex Rationale:
• 2000-pip Renko macro brick projected from 1.20–1.00 (prior structure)
• 10-pip bearish reversal confirmed below 1.1580
• Liquidity fracture visible on M5/M15
• Volume divergence supports southbound drift
• Fed narrative weakness and structural USD demand (esp. after Kruger resignation)
⸻
🔧 Risk-to-Reward Breakdown (Approx):
Entry Zone SL Target R:R
1.155–1.159 1.160 1.1000 10:1+
1.0000 20:1+
0.8000 30:1++
⸻
🧭 Strategy Status:
✅ Reversal Confirmed
✅ Anchor Trades Set
🔁 Stacking Ongoing
⚠️ SL Dynamic Near 1.1600
🚨 High Volatility Potential
⸻
#EURUSD #Forex #MacroDrift #RenkoStrategy #BearishReversal #TradingView #CodexAthenon #TechnicalAnalysis #PriceAction #SmartMoney

EURUSD short term buy Price closed with a daily morning star candlestick formation , I expect a little retracement to cover up the fvg before a short move to the upside

EUR/USD Setup Is Ready This is a bullish EUR/USD (Euro/US Dollar) 1-hour chart analysis. The setup indicates a potential upward reversal after a downtrend, supported by a series of higher lows.
Key elements:
Entry Point: Around 1.14044–1.14376.
Stop Loss: Placed below the recent low at 1.12770 to manage risk.
Targets:
First Target: 1.15034
Second Target: 1.15892
Third Target: 1.17238
The chart suggests a buy setup with a risk-reward strategy, aiming for a breakout and continuation towards higher resistance levels. The large upward arrow emphasizes bullish momentum expectations.

EURUSD retesting neckline EURUSD has made the move we were patiently waiting for . it went to test our neckline of the double bottom or M pattern , now we just need to wait for confirmation for the long-term sell before we enter , lets keep an eye

EURUSD ahead of NFPEURUSD is still trading within the range established after Wednesday’s news.
We’re watching for a close above 1,1503, which would confirm a potential buying opportunity.
Today at 1:30 PM (London), the NFP data will be released, which could further impact price action - especially if a reversal is underway.
In case of a decline, the next key support level to watch is around 1,1346.


EURUSD testing necklineEURUSD has made the move we were waiting for . it went to test our neckline of the double bottom or M pattern , now we just need to wait for confirmation for the longterm sell before we enter

EURUSD - Scaling into Confluence ZoneTaking a look at EURUSD on the daily timeframe we had quite the rebound in EURUSD last Friday following the NFP report. However price action is now heading towards a cluster of resistance levels which is why I'm implement my scaling in technique using a specially designed and programmed EA that i use for MT5.
== TRADE PLAN ==
Scale-in with short positions and target a 0.5% growth on the account. In other words, once the basket arrives in profit by 0.5% CLOSE ALL.
Trade Safe - Trade Well
EUR/USD Potential Bearish MoveHi Traders.
1. HTF Expanding Structure
2. HnS Pattern
3. LTF Bearish Impulse
4. Breakout from Structure
Wait for LTF Correction and Breakout to confirm this setup

EURUSD Current Market Situation Technical Analysis Current Market Situation
The chart displays a Double Top pattern, a strong bearish reversal signal that often indicates the start of a downward move.
The price has already broken the neckline, and it is now approaching a retest of both the neckline and the broken trendline, which serves as a critical resistance area for potential bearish continuation.
Key Zones
Neckline Retest Zone: Around 1.1600, acting as immediate resistance.
Trendline Retest Zone: Between 1.1670 – 1.1700, serving as an additional resistance level to confirm the bearish bias.
Potential Scenarios
✅ Bearish Scenario (Preferred):
If price respects the retest zones and fails to break higher, we may see a decline toward:
Target 1: 1.1500
Target 2: 1.1400
Target 3: 1.1300
⚠ Bullish Scenario (Alternative):
A clear breakout and daily close above 1.1700 would invalidate the bearish outlook and could lead to a bullish reversal.
Conclusion
The market structure currently favors the bears.
Rejection from the neckline or trendline retest zones will provide a strong confirmation for sell positions.
⚠️ Trade at your own risk – We are not responsible for any losses.

EURO long: The "What If?" tradeHello traders
The Euro is showing signs of bottoming out at the weekly support levels against
USD, JPY, CAD and AUD.
MOST IMPORTANT:
USD:
While King Dollar is clearly reigning after the FOMC indication not to expect rate cuts any time soon and solid economic data, the "What If" factor is NFP tomorrow and to a minor extent month end settling. If the NFP print comes in significantly lower than expectations, the Euro may pop higher. If the print is above expectations, still take a moment to check where the most jobs are. if it is in hospitality and leisure, it is probably summer hiring.
JPY: The BoJ kept rates unchanged.
CAD: The loonie is under siege with Trump's renewed 35% tariffs announced today. However, IF Russian sanctions against oil sales come to fruition, the CAD may strengthen. Watch Oil prices.
AUD: CPI came in below expectations. PPI has just printed lower too.
The Euro Zone's unemployment rate ticked down and German CPI ticked higher. The impact of tariffs seems to be priced in for the moment.
The biggest "What If" ?
The decision of the Federal Appeals Court if the International Trade Court verdict is upheld. In that case, it is all but guaranteed that it will reach the Supreme Court. IF the Supreme Court declares it unlawful, the USD MAY drop like a lead balloon.
The risk assets in these charts are all at right around the weekly 20 SMA.
www.tradingview.com
Just some food for thought. Let me know what your thoughts are.

EURUSD Will Go Lower! Sell!
Here is our detailed technical review for EURUSD.
Time Frame: 1h
Current Trend: Bearish
Sentiment: Overbought (based on 7-period RSI)
Forecast: Bearish
The market is on a crucial zone of supply 1.158.
The above-mentioned technicals clearly indicate the dominance of sellers on the market. I recommend shorting the instrument, aiming at 1.153 level.
P.S
Please, note that an oversold/overbought condition can last for a long time, and therefore being oversold/overbought doesn't mean a price rally will come soon, or at all.
Disclosure: I am part of Trade Nation's Influencer program and receive a monthly fee for using their TradingView charts in my analysis.
Like and subscribe and comment my ideas if you enjoy them!

Sell eurusdOur last selling idea already running 300+ pips
Now we looks more selling, more bearish correction expected
Daily support trend broken
Previous support level now becomes the resistance level and almost ready to respect it
Minimum 509+ selling pips expected

EURUSD Buy Setup – Eyes onStillness before the move. I’ve got my eye on 1.14769 as a potential long entry. It’s not random. The level aligns with past structure and feels like the kind of spot where demand might quietly step in again.
Buy Limit: 1.14769
Why here?
– Price has memory — this level has held before
– It’s tucked inside a potential demand zone
– If I see reaccumulation or bullish intent down there, I’m in
No chasing candles. No emotional FOMO. This is one of those "let price come to you or leave it alone" situations.
Chart’s attached — structure speaks if you listen close enough.
What’s your take? Got a similar zone? Drop it below.

EUR/USD: A Fragile Rebound Within a Broader Bearish TrapEUR/USD has managed to stage a slight recovery after plunging through the key 1.1680 support — a level that had held firm for two weeks. The pair is now hovering just above 1.1500, but the bounce appears shallow and unconvincing. Volume remains low, momentum indicators offer little confirmation, and the broader structure still points to a prevailing downtrend.
On the H2 chart, price has rebounded from the 1.1505 area — a minor support formed during July's short-term consolidation. Yet, the EMA slope remains strongly negative, and RSI is struggling below the neutral 50 mark after exiting oversold territory. The structure continues to display classic lower highs and lower lows, with the 1.1585–1.1600 zone emerging as a potential resistance area for bears to re-enter.
From a macro perspective, the U.S. dollar remains supported by expectations that the Fed will maintain a hawkish stance, fueled by solid GDP, durable goods, and PCE data. In contrast, the Eurozone struggles with signs of stagnation, with both services and manufacturing PMIs deteriorating — most notably in Germany. This policy divergence continues to favor the greenback.
Unless bulls manage to decisively reclaim the 1.1600 zone with strong follow-through buying, any rebound risks being nothing more than a dead cat bounce. The downside target remains near 1.1460 – 1.1440 in the near term.

EUR/USD: Risk OnEUR/USD Daily Setup: Riding Risk-Off into the 1.1050 Zone
Chart: Daily (showing 0.146–161.8% Fib extensions, supply/demand zones, trendline)
Analysis & Plan:
Macro Drivers: Fed/ECB rate divergence and yield spread keep USD bid; risk-off bias intact.
Key Levels:
Supply (short zone): 1.1636–1.1750
Invalidation: Daily close above 1.1800
Demand Targets:
1.1278 (100% Fib ext)
1.1056 (161.8% Fib ext + demand confluence)
1.0521 (“strong low” area)
Trigger:
Risk-On Break: Watch for rejection at 1.1589–1.1636; failure confirms fresh sell signal.
Trade Execution:
Enter Short near 1.1589–1.1636 on bearish price action / daily close below 20-day MA.
Stop-Loss: Above 1.1800 supply high.
Take Profits: Scale out at 1.1278, then final at 1.1056.
Rationale: Aligns Fibonacci confluence zones with macro USD strength and trendline support breaks.
Tags:
#EURUSD #Forex #Fibonacci #SupplyDemand #TechnicalAnalysis #TradingVie
