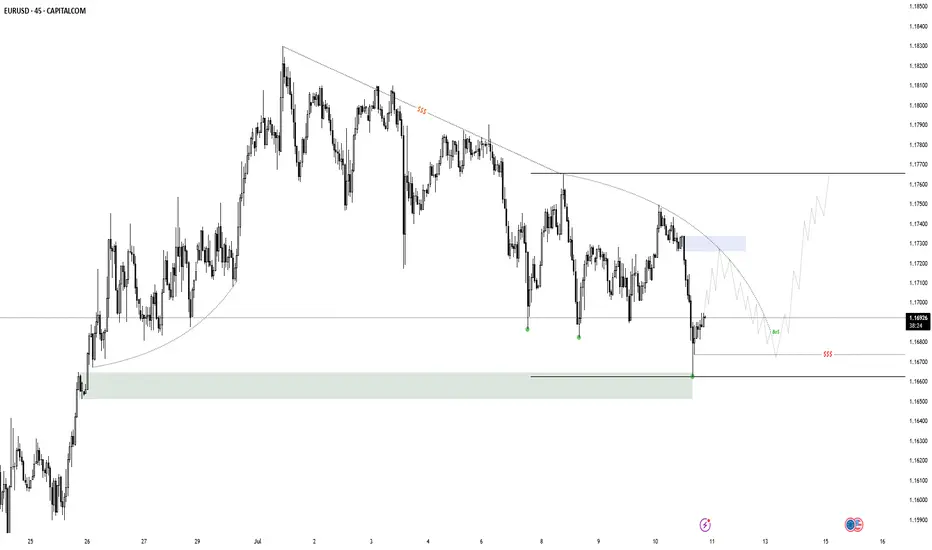
Price action Eurusd has made lower low now price gone back to sweep liquidity another chance to lower
EURUSD trade ideas

Euro/U.S. Dollar (EUR/USD) 4-Hour Chart - OANDA4-hour performance of the EUR/USD currency pair. The chart shows a recent upward trend peaking around 1.16241, followed by a sharp decline to approximately 1.15452. Key levels include a high of 1.17245 and a support level around 1.16478, with a highlighted area indicating a potential consolidation or reversal zone.

Long Opportunity for EURUSDEURUSD is currently in a retracement within a bullish trend with clear Bullish market structures in place.
Price is currently approaching the break and retest level at 1,16285... a potential pivot point which acted as a resistance level in the past. On the 4-hour timeframe, price is trading below the 21 and 50 SMA due to the slow nature of the retracement and we are seeing bearish momentum on the RSI.
Need to see the Bulls stepping in with clean bullish momentum on the 4 hour chart to confirm the bullish market directionality before looking to take a long position. will also be observing the bearish trendline break as an additional point of confluence to take the long trade

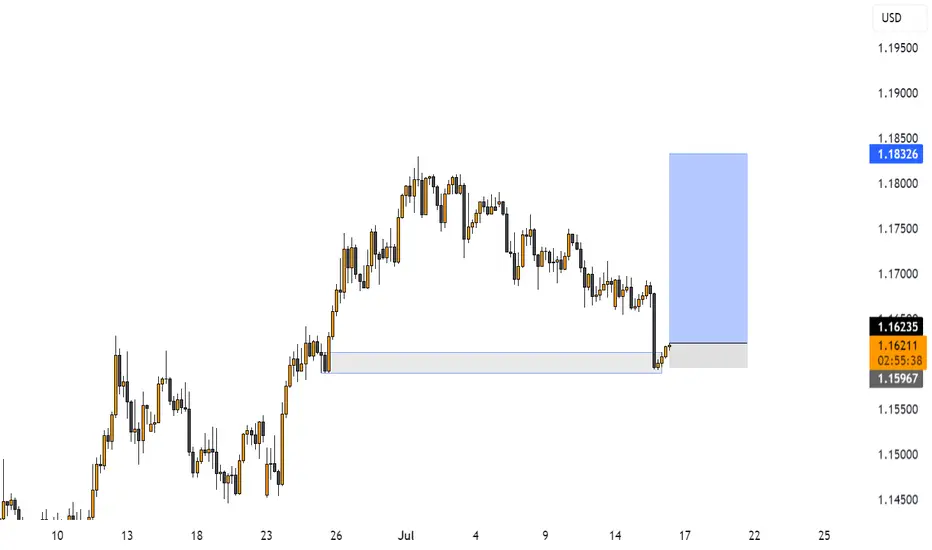
EURUSD ALERTPrice starts ranging
No clear breakout yet — we're staying patient and waiting for a cleaner entry signal.
#EURUSD #Forex #PriceAction #Trading

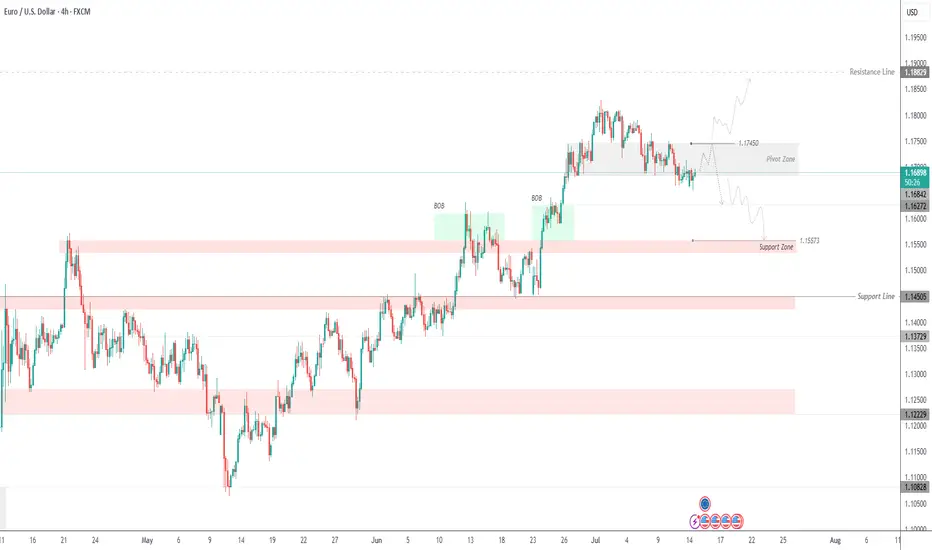
EURUSD Testing Patience – Bearish Trend Not Over YetEURUSD – Overview
EURUSD continues to trade under pressure amid bearish momentum, respecting key technical levels.
The price maintains bearish momentum as long as it trades below 1.1745, with downside targets at 1.1627 and 1.1557.
A retest of 1.1745 is possible and considered normal in this structure. However, if the price stabilizes below 1.1684, it will likely continue dropping toward the support targets.
To shift back to a bullish bias, the pair must break and hold above 1.1745.
Pivot Line: 1.1695
Support Levels: 1.1627 – 1.1557
Resistance Levels: 1.1745 – 1.1810
previous idea:
EURUSD is close to the end of its correctionEURUSD is consolidating in a wedge. The trend is bullish, with the correction reaching the 0.7 Fibonacci zone and making a false breakout, which generally changes the market imbalance.
All attention is on the wedge resistance (red line) and the 1.17000 level. A breakout of the resistance and consolidation of the price above this level will confirm the end of the correction and send the price higher.

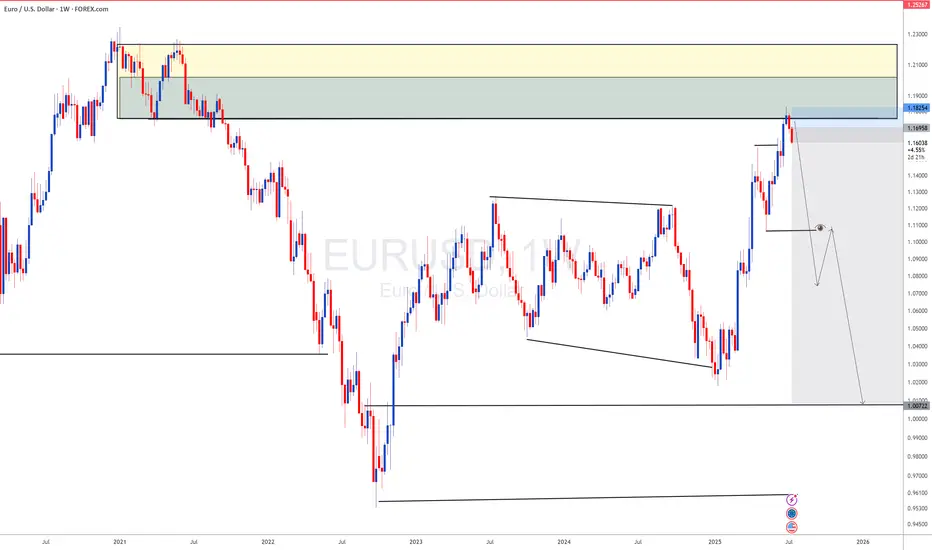
EURUSD and GBPUSD Analysis todayHello traders, this is a complete multiple timeframe analysis of this pair. We see could find significant trading opportunities as per analysis upon price action confirmation we may take this trade. Smash the like button if you find value in this analysis and drop a comment if you have any questions or let me know which pair to cover in my next analysis.

EURUSDU - market structure EURUSDU - market structure , use your own risk and trade managmnet and your own decision
CONTINUATION OF BEARISH TREND EUR/USD continuaring bearish, just going up to the the imbalance created yesterday during CPI, we expect it to hit the horizontal line as shown in the image, we expect a redistribution then another short entry, a the US dollar index gains strength

EURUSD correction continuesYesterday, EURUSD reached 1,1590 following key news releases.
This doesn’t change the overall market direction or the type of setups we’re looking for.
The next key support level is at 1,1536.
Keep an eye out for a bounce and potential entry signals around that area.

Potential Bearish Setup on EURUSDBearish Breakdown Setup
Summary
Analysing Price action from yesterday we have got a very nice distribution leg push that broke down below our accumulation zone a good indication of downside momentum, therefore the anticipation is that price will retest our BOS an ideal zone to look for bearish setups.
📉 EURUSD Daily Breakdown Potential setup
🔴 Distribution leg: 1.16921 - 1.15924
📉 Sell Below: 1.16540 (Confirmed Break)
🎯 Target 1: R:R 1:2
🎯 Target 2: R:R 1:3
🎯 Target 3: R:R 1:4
🛑 Stop Loss: Above Resistance Zone
🔍 Watch: Failure to break back in = Confirmation
LIKE or COMMENT if this idea sparks your interest, or share your thoughts below!
FOLLOW to keep up with fresh ideas.
Tidypips: "Keep It Clean, Trade Mean!"

EURUSD H1 I Bullish Rise Based on the H1 chart analysis, the price is approaching our buy entry level at 1.1603, a pullback support.
Our take profit is set at 1.1641, a pullback resistance that aligns with the 50% Fib retracement.
The stop loss is placed at 1.1579, an overlap support.
High Risk Investment Warning
Trading Forex/CFDs on margin carries a high level of risk and may not be suitable for all investors. Leverage can work against you.
Stratos Markets Limited (tradu.com ):
CFDs are complex instruments and come with a high risk of losing money rapidly due to leverage. 63% of retail investor accounts lose money when trading CFDs with this provider. You should consider whether you understand how CFDs work and whether you can afford to take the high risk of losing your money.
Stratos Europe Ltd (tradu.com ):
CFDs are complex instruments and come with a high risk of losing money rapidly due to leverage. 63% of retail investor accounts lose money when trading CFDs with this provider. You should consider whether you understand how CFDs work and whether you can afford to take the high risk of losing your money.
Stratos Global LLC (tradu.com ):
Losses can exceed deposits.
Please be advised that the information presented on TradingView is provided to Tradu (‘Company’, ‘we’) by a third-party provider (‘TFA Global Pte Ltd’). Please be reminded that you are solely responsible for the trading decisions on your account. There is a very high degree of risk involved in trading. Any information and/or content is intended entirely for research, educational and informational purposes only and does not constitute investment or consultation advice or investment strategy. The information is not tailored to the investment needs of any specific person and therefore does not involve a consideration of any of the investment objectives, financial situation or needs of any viewer that may receive it. Kindly also note that past performance is not a reliable indicator of future results. Actual results may differ materially from those anticipated in forward-looking or past performance statements. We assume no liability as to the accuracy or completeness of any of the information and/or content provided herein and the Company cannot be held responsible for any omission, mistake nor for any loss or damage including without limitation to any loss of profit which may arise from reliance on any information supplied by TFA Global Pte Ltd.
The speaker(s) is neither an employee, agent nor representative of Tradu and is therefore acting independently. The opinions given are their own, constitute general market commentary, and do not constitute the opinion or advice of Tradu or any form of personal or investment advice. Tradu neither endorses nor guarantees offerings of third-party speakers, nor is Tradu responsible for the content, veracity or opinions of third-party speakers, presenters or participants.

EURUSD - OPPORTUNITY TO PLAY BOTH SIDES OF DESCENDING CHANNEL CMCMARKETS:EURUSD
TRADING IDEA - EURUSD MOVES WITHIN A DESCENDING CHANNEL - OPPORTUNITY TO PLAY BOTH SIDES
EURUSD has been trading within a descending channel since the beginning of the month. Nearby the upper border of the channel there is SMA200 on a 30-m timeframe, pushing on the pair. Generally speaking, all major moving averages are pushing on the EURUSD, the short-term bearish trend continues, so I decided to open
🔽 a market sell order at 1.16688 with
❌a stop loss at 1.16985 and
🤑a take profit at 1.16324
Later I expect a rebound from the lower border with a potential uprise towards upper border of the descending channel.

EURUSD as DXY s gaining momentum DXY has completed its long term downside now lets look for sell on EURUSD
EURUSD TRADE IDEA Eurusd is pulling back, but we're yet to be tapped into the trade. We wait for a pullback into our fib level for a continuation to the upside

EURUSD is Bearish After Breaking Regression ChannelHello Traders
In This Chart EURUSD HOURLY Forex Forecast By FOREX PLANET
today EURUSD analysis 👆
🟢This Chart includes_ (EURUSD market update)
🟢What is The Next Opportunity on EURUSD Market
🟢how to Enter to the Valid Entry With Assurance Profit
This CHART is For Trader's that Want to Improve Their Technical Analysis Skills and Their Trading By Understanding How To Analyze The Market Using Multiple Timeframes and Understanding The Bigger Picture on the Charts

EURUSD AccumulationI am looking for some accumulation here. The model can already be complete, but i would only take it if it extends into a model 2 from extreme liquidity to create more liquidity for a reversal. The supply above, followed by the strong sell off lowers the quality of this model. A supply mitigation with a slow pullback into the POI would change that.
EURUSD BEARISH SETUP: 15 JULY 2025This is a 4-hour chart of the EUR/USD currency pair, and it includes several key technical elements:
---
🔍 Overall Market Context
The price is in a downtrend, clearly shown by the descending channel (highlighted with yellow lines).
The price just broke below the lower boundary of that channel, indicating potential bearish continuation.
The chart includes support/resistance levels, pivot points, and a projected path suggesting possible price behavior.
---
🔧 Key Technical Elements
1. Price Action & Structure
Recent price action shows a strong bearish move (large red candle), suggesting strong selling pressure.
The move bounced off S2, a weekly pivot support level, and entered a demand zone (green area).
2. Projected Scenario (Black Line Path)
A potential pullback to 1.16586 (key resistance).
If price fails to break above that resistance, it's expected to drop again.
Possible next supports:
1.15842
1.15228
Final target: 1.14550
3. Pivot Levels
Weekly Pivot: Near 1.17100 area (currently above the price — bearish implication).
S2 level: Around 1.15900 — presently acting as short-term support.
R1, R2, etc., are above and could act as resistance in a retracement.
---
📊 Summary of Trade Outlook
🔻 Bearish Bias (Short-Term to Medium-Term)
Main idea: This chart reflects a bearish breakout of a descending channel.
Entry Zones: After a potential pullback to resistance (1.16586)
Targets: 1.15842 → 1.15228 → 1.14550
Invalidation: A Bullish break above 1.16586 could invalidate the bearish setup.
---
✅ Trading Considerations
Wait for confirmation of rejection at 1.16129 or 1.16586 before shorting.
Watch for volume confirmation on the pullback.
Monitor fundamentals (e.g. ECB or Fed news) as they can drive sudden volatility.

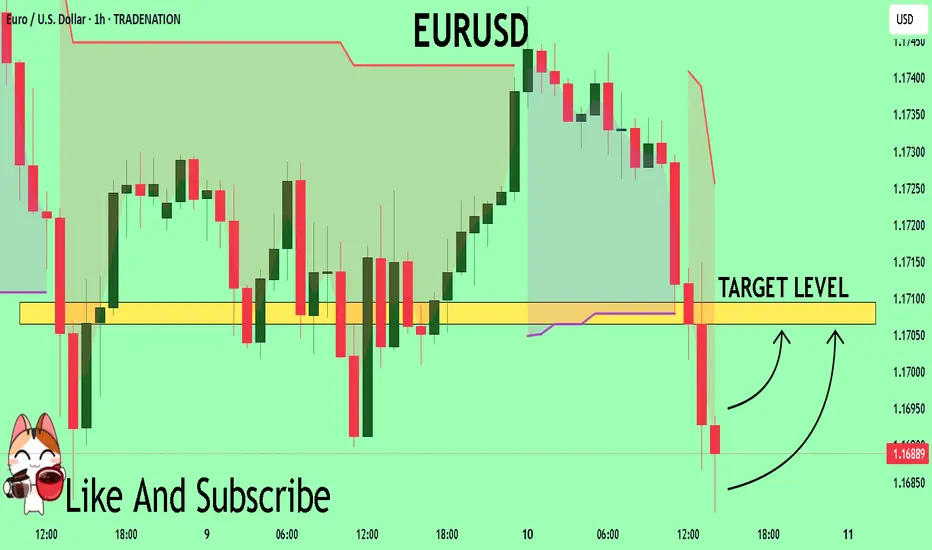
EUR_USD BEARISH BREAKOUT|SHORT|
✅EUR_USD was trading along
The rising support line but
Now we are seeing a strong bearish
Breakout and the breakout is
Confirmed so we are bearish
Biased and we will be expecting
A further bearish move down
After the potential pullback
SHORT🔥
✅Like and subscribe to never miss a new idea!✅
Disclosure: I am part of Trade Nation's Influencer program and receive a monthly fee for using their TradingView charts in my analysis.

EURUSD Bullish Momentum EUR/USD is expected to resume its bullish trend after a brief consolidation. The market is likely to gain bullish momentum from the 1.17007 – 1.17507 support zone, potentially targeting the 1.20285 level in the next upward move

A case for a EURUSD ShortPrice got rejected at the U-MLH.
DXY shows some strenght too:
A close below yesterdays low is a short for me.

eur/usd 07.07The information and publications are not meant to be, and do not constitute, financial, investment, trading, or other types of advice or recommendations.
Have a nice evening ahead.

EURUSD Will Explode! BUY!
My dear followers,
I analysed this chart on EURUSD and concluded the following:
The market is trading on 1.1686 pivot level.
Bias - Bullish
Technical Indicators: Both Super Trend & Pivot HL indicate a highly probable Bullish continuation.
Target - 1.1706
About Used Indicators:
A super-trend indicator is plotted on either above or below the closing price to signal a buy or sell. The indicator changes color, based on whether or not you should be buying. If the super-trend indicator moves below the closing price, the indicator turns green, and it signals an entry point or points to buy.
Disclosure: I am part of Trade Nation's Influencer program and receive a monthly fee for using their TradingView charts in my analysis.
———————————
WISH YOU ALL LUCK