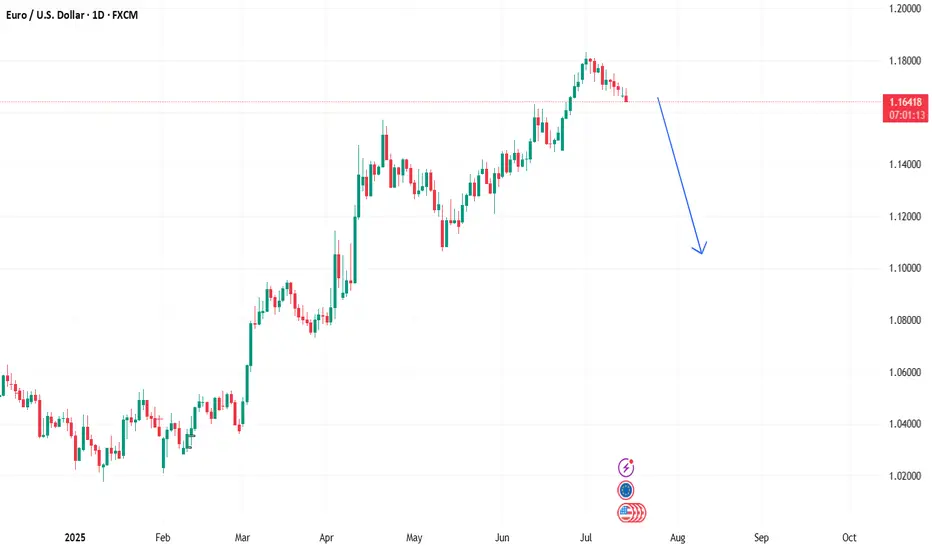
Bearsih EurUsd!The fibre has begun its downward spiral. You can look for sell set-ups from now on; every time it buys, wait and look for sells. Unless of course you can trade both sides of the market. Price is aiming for 1.1060 level.
EURUSD trade ideas
7.15 EUR/USD LIVE TRADE UPDATEWe took this trade yesterday based on the pullback followed by a strong engulfing candle. volume and momentum are strong. Currently looks like it is having a hard time getting out of the S/R zone which to me seems pretty strong. I still think this market is heading down. We will wait and let the market do it's thing.

EURUSD Remains Under Pressure Following CPIThis morning, after the US CPI report was released at 8:30 AM EDT, EUR/USD surged briefly due to a slightly weaker-than-expected inflation reading. Despite this, signs of rising inflation persisted, leading EUR/USD to rise sharply before quickly retreating.
EUR/USD has seen an intermediate top at 1.1830 since early July. The euro is under pressure due to looming US tariffs (30% on EU imports, effective August 1) and mixed economic signals, like Eurozone industrial production rising 1.7% in May (vs. 0.9% expected). The pound (GBP) and other currencies are also reacting to tariff concerns.
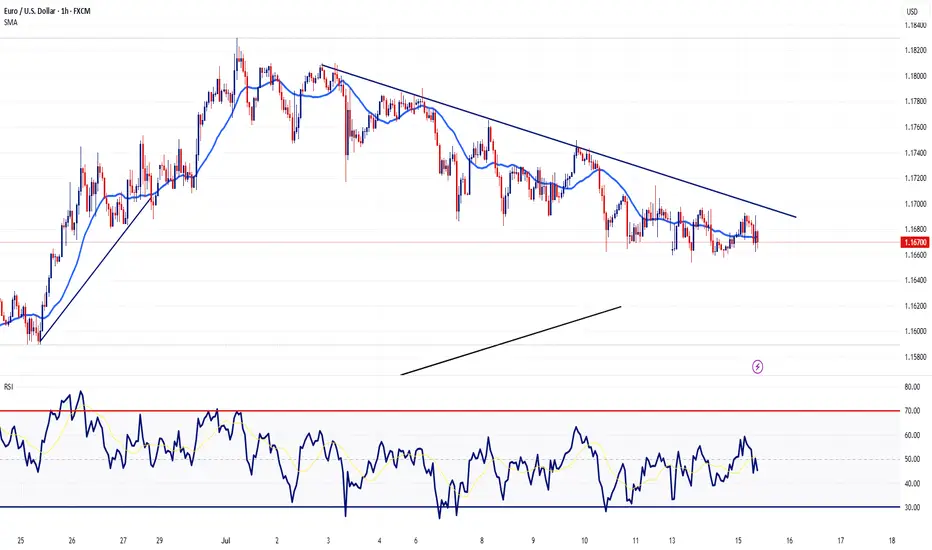
Taking a look at the 1hour chart, you can see we are still trading below a descending trendline. Taking everything into consideration, I'm positioning short sells whenever we get bounce higher.
That's it - That's all - Trade Safe

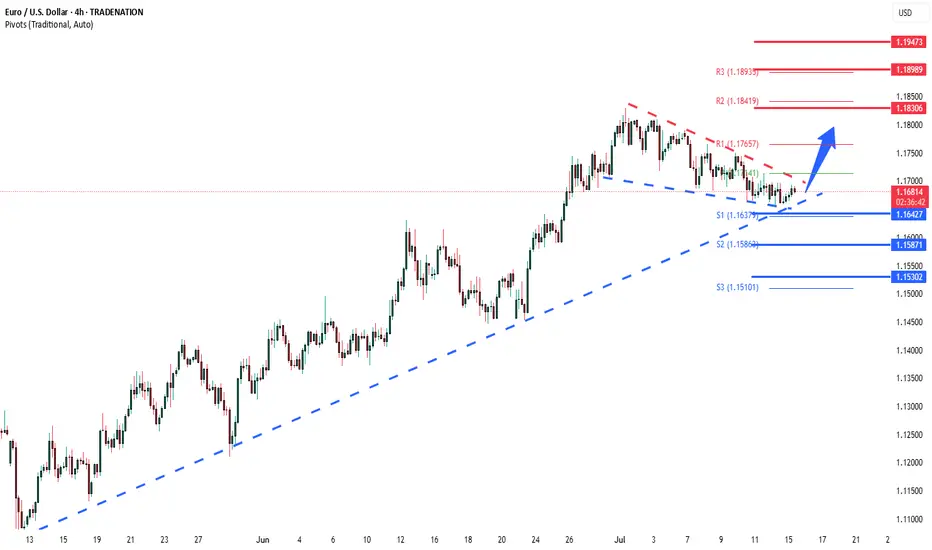
EURUSD Bullish continuation supported 1.1640The EURUSD currency pair continues to exhibit a bullish price action bias, supported by a sustained rising trend. Recent intraday movement reflects a sideways consolidation breakout, suggesting potential continuation of the broader uptrend.
Key Technical Level: 1.1640
This level marks the prior consolidation range and now acts as pivotal support. A corrective pullback toward 1.1640 followed by a bullish rejection would reinforce the bullish trend, targeting the next resistance levels at:
1.1830 – Near-term resistance
1.1900 – Minor swing high
1.1940 – Longer-term bullish objective
On the other hand, a decisive daily close below 1.1640 would invalidate the bullish setup, shifting the outlook to bearish in the short term. This could trigger a deeper retracement toward:
1.1590 – Initial support
1.1530 – Key downside target
Conclusion:
As long as 1.1640 holds as support, the technical outlook remains bullish, favoring long positions on dips. A confirmed break below this level would signal a shift in sentiment and open the door to a corrective pullback phase.
This communication is for informational purposes only and should not be viewed as any form of recommendation as to a particular course of action or as investment advice. It is not intended as an offer or solicitation for the purchase or sale of any financial instrument or as an official confirmation of any transaction. Opinions, estimates and assumptions expressed herein are made as of the date of this communication and are subject to change without notice. This communication has been prepared based upon information, including market prices, data and other information, believed to be reliable; however, Trade Nation does not warrant its completeness or accuracy. All market prices and market data contained in or attached to this communication are indicative and subject to change without notice.
15.07.25 Morning ForecastPairs on Watch -
FX:EURUSD
CAPITALCOM:DE40
FX:EURGBP
FX:GBPJPY
A short overview of the instruments I am looking at for today, multi-timeframe analysis down to what I will be looking at for an entry. Enjoy!

EURUSD: Long Signal with Entry/SL/TP
EURUSD
- Classic bullish formation
- Our team expects pullback
SUGGESTED TRADE:
Swing Trade
Long EURUSD
Entry - 1.1689
Sl - 1.1627
Tp - 1.1799
Our Risk - 1%
Start protection of your profits from lower levels
Disclosure: I am part of Trade Nation's Influencer program and receive a monthly fee for using their TradingView charts in my analysis.
❤️ Please, support our work with like & comment! ❤️

Important News for EURUSDYesterday, EURUSD continued moving sideways as the market waits for upcoming news.
Today at 1:30 PM London time, U.S. inflation data will be released.
This report has a strong impact and is likely to set the next direction for the pair.
It’s advisable to reduce your risk and avoid opening new positions before the news comes out.
The goal is to follow the trend once it resumes!

EURUSD – Bearish Pressure Mounts Ahead of Triangle Breakout EURUSD is trading within a contracting triangle and currently leans toward a bearish bias. After several failed attempts to break the upper boundary, momentum is weakening, and the pair is showing signs of a potential breakdown toward lower support levels.
With several key events ahead, the euro may face additional pressure if upcoming Eurozone inflation data disappoints or if the Fed maintains a hawkish tone through upcoming speeches by U.S. officials. Unless there is a strong bullish catalyst, EURUSD is likely to correct further to the downside.
EURUSD H1 I Bearish Reversal Based on the H1 chart analysis, we can see that the price is rising toward our sell entry at 1.1681, which is a pullback resistance.
Our take profit will be at .1642, an overlap support level.
The stop loss will be placed at 1.1714, a swing-high resistance level.
High Risk Investment Warning
Trading Forex/CFDs on margin carries a high level of risk and may not be suitable for all investors. Leverage can work against you.
Stratos Markets Limited (tradu.com ):
CFDs are complex instruments and come with a high risk of losing money rapidly due to leverage. 63% of retail investor accounts lose money when trading CFDs with this provider. You should consider whether you understand how CFDs work and whether you can afford to take the high risk of losing your money.
Stratos Europe Ltd (tradu.com ):
CFDs are complex instruments and come with a high risk of losing money rapidly due to leverage. 63% of retail investor accounts lose money when trading CFDs with this provider. You should consider whether you understand how CFDs work and whether you can afford to take the high risk of losing your money.
Stratos Global LLC (tradu.com ):
Losses can exceed deposits.
Please be advised that the information presented on TradingView is provided to Tradu (‘Company’, ‘we’) by a third-party provider (‘TFA Global Pte Ltd’). Please be reminded that you are solely responsible for the trading decisions on your account. There is a very high degree of risk involved in trading. Any information and/or content is intended entirely for research, educational and informational purposes only and does not constitute investment or consultation advice or investment strategy. The information is not tailored to the investment needs of any specific person and therefore does not involve a consideration of any of the investment objectives, financial situation or needs of any viewer that may receive it. Kindly also note that past performance is not a reliable indicator of future results. Actual results may differ materially from those anticipated in forward-looking or past performance statements. We assume no liability as to the accuracy or completeness of any of the information and/or content provided herein and the Company cannot be held responsible for any omission, mistake nor for any loss or damage including without limitation to any loss of profit which may arise from reliance on any information supplied by TFA Global Pte Ltd.
The speaker(s) is neither an employee, agent nor representative of Tradu and is therefore acting independently. The opinions given are their own, constitute general market commentary, and do not constitute the opinion or advice of Tradu or any form of personal or investment advice. Tradu neither endorses nor guarantees offerings of third-party speakers, nor is Tradu responsible for the content, veracity or opinions of third-party speakers, presenters or participants.

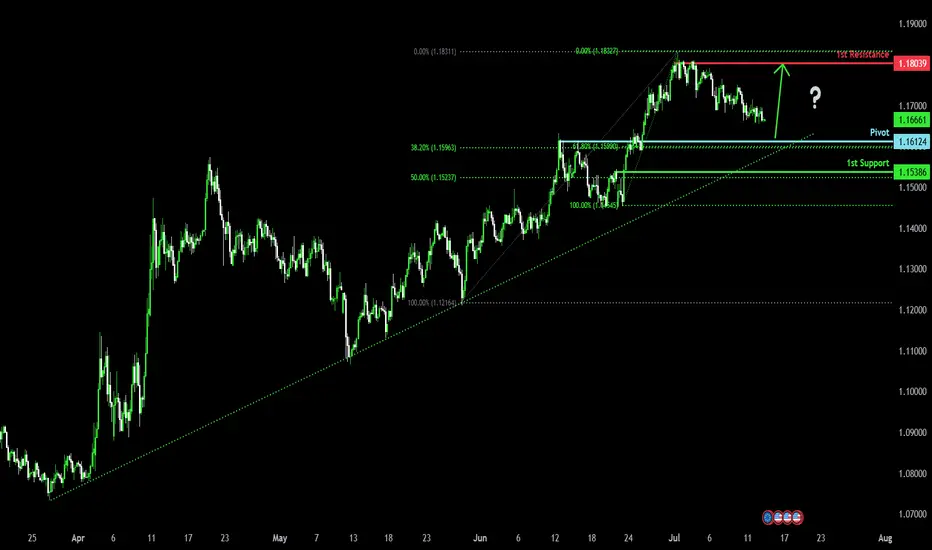
Bullish bounce for the Fiber?The price is falling towards the pivot, which acts as a pullback support and could bounce to the 1st resistance, a swing high resistance.
Pivot: 1.1612
1st Support: 1.1538
1st Resistance: 1.1803
Risk Warning:
Trading Forex and CFDs carries a high level of risk to your capital and you should only trade with money you can afford to lose. Trading Forex and CFDs may not be suitable for all investors, so please ensure that you fully understand the risks involved and seek independent advice if necessary.
Disclaimer:
The above opinions given constitute general market commentary, and do not constitute the opinion or advice of IC Markets or any form of personal or investment advice.
Any opinions, news, research, analyses, prices, other information, or links to third-party sites contained on this website are provided on an "as-is" basis, are intended only to be informative, is not an advice nor a recommendation, nor research, or a record of our trading prices, or an offer of, or solicitation for a transaction in any financial instrument and thus should not be treated as such. The information provided does not involve any specific investment objectives, financial situation and needs of any specific person who may receive it. Please be aware, that past performance is not a reliable indicator of future performance and/or results. Past Performance or Forward-looking scenarios based upon the reasonable beliefs of the third-party provider are not a guarantee of future performance. Actual results may differ materially from those anticipated in forward-looking or past performance statements. IC Markets makes no representation or warranty and assumes no liability as to the accuracy or completeness of the information provided, nor any loss arising from any investment based on a recommendation, forecast or any information supplied by any third-party.
Internal Summary EURUSD Pair: EURUSD
Bias: Bullish
Timeframe: 1H
Trigger: Support test within triangle pattern
Targets:
TP1: 1.17217
TP2: 1.17851
Invalidation: Below 1.15942
Comment: Price is compressing inside a symmetrical triangle, holding above a key ascending trendline. A breakout to the upside looks probable as long as price holds current support.

7.14 EUR/USD LIVE ENTRY UPDATE 4HWe got the trigger and placed the order to sell. We will keep you updated on this trade. entry, profit target, stop loss placement are all on the chart

The euro's bearish structure remains unchanged.EUR/USD rebounded from around the three-week low of 1.1655 during the European session. However, the overall trend of the exchange rate remains within the descending channel that has been in place since early July. Market concerns over the U.S. government's new 30% tariff measures have dampened risk appetite, limiting the room for the exchange rate to rebound.
In the short term, the exchange rate is expected to contend within the 1.1650-1.1700 range. Analysts believe that if the euro fails to break through and stabilize above the 1.1700 threshold, the bearish structure will remain intact, and the exchange rate will continue to test lower support levels such as 1.1630 and 1.1600. A breakdown below these levels could open up further downside space, with the target pointing to around the lower Bollinger Band at 1.1387.
you are currently struggling with losses,or are unsure which of the numerous trading strategies to follow,You have the option to join our VIP program. I will assist you and provide you with accurate trading signals, enabling you to navigate the financial markets with greater confidence and potentially achieve optimal trading results.

EURUSD Short re entry, 14 JulyHTF Downtrend with Clean LTF Setup
Bias remains bearish with HTF downtrend, W imbalance resting above, and 4H 50EMA close to our zone.
📉 Confluence:
Textbook LTF structure, expecting LH → LL
DXY reacting from 15m POI + Asia low to fill
15m Extreme OB + 5m OB as entry zone
Clean 1m BOS confirming sellers stepping in → add another 50%
🎯 Entry: 50% tap of 5m OB after 1m BOS
🛡️ SL: Above LH structure
📌 TP: At least 1:3 RR down to Asia low
⚠️ Minor risk with W imbalance above, but strong trend and confirmations to support the trade.
3 hours ago
Trade active
We got an 1mBOS from the 15m POI
Got 2 entry points now : The one from the 5m OB marked out on the photo and one at the lower 5m that created the break. Will see what happens

Buy EURUSDRisky scalp trade on EURUSD. Price is clearly declining but we will go against the run of play here as I anticipate a quick liquidity grab before sells continue.

EURUSD Short, 14 JulyHTF Downtrend with Clean LTF Setup
Bias remains bearish with HTF downtrend, W imbalance resting above, and 4H 50EMA close to our zone.
📉 Confluence:
Textbook LTF structure, expecting LH → LL
DXY reacting from 15m POI + Asia low to fill
15m Extreme OB + 5m OB as entry zone
Clean 1m BOS confirming sellers stepping in → add another 50%
🎯 Entry: 50% tap of 5m OB after 1m BOS
🛡️ SL: Above LH structure
📌 TP: At least 1:3 RR down to Asia low
⚠️ Minor risk with W imbalance above, but strong trend and confirmations to support the trade.

EURusd long position 14/07/2025English : According to our analysis, we anticipate a bullish scenario.
Morocan Darija : kanchofo d'apres l'analyse dyalna antsanaw tlooo3
ATENTION : I only share my ideas, not signals

EURUSD: Will Go Down! Short!
My dear friends,
Today we will analyse EURUSD together☺️
The recent price action suggests a shift in mid-term momentum. A break below the current local range around 1.16802 will confirm the new direction downwards with the target being the next key level of 1.16684.and a reconvened placement of a stop-loss beyond the range.
❤️Sending you lots of Love and Hugs❤️

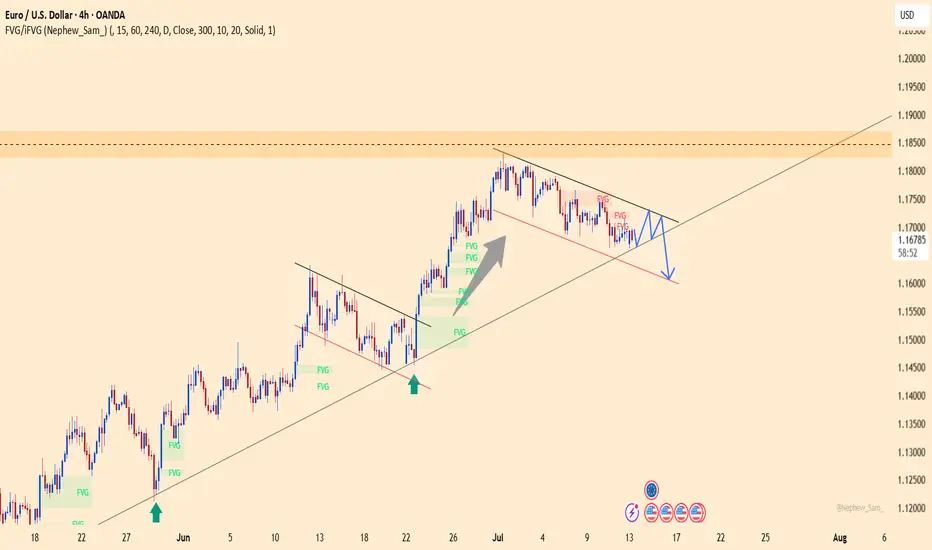
EURUSD POTENTIAL BUY SETUP 4HLooking at EURUSD, Price is moving in a descending channel. EU on the high timeframe is bullish as Dollar is weak. I am expecting EU to fall into the marked FVG to clear the lows and take internal liquidity from the marked FVG before moving higher and take the Buyside Liquidity as marked.
Potential Entry= 1.6350
Stop loss= 1.15650
Take Profit = 1.18250
Please wait for price to come into the marked potential area to take this trade and manage your risk accordingly. Follow me for more updates and trades.


My Take on the EURUSD H1 Setup (July 14, 2025)
This is a classic textbook-quality TCB setup forming right at a critical confluence zone. Here's a full breakdown from a trader's lens:
🔵 1. Trend
Bias: Bullish
The macro structure from June shows a strong uptrend, and the most recent impulse was explosive — indicating active buyers.
H4 and D1 show no trend break yet.
🔵 2. Countertrend
The descending channel is neat and controlled — no erratic spikes or liquidity wicks that signal confusion.
Compression into the demand zone (gray box) around 1.1652–1.1710 shows sellers are weakening.
This is typical of pre-breakout structure when buyers are loading up under the radar.
🔵 3. Breakout
Price just broke cleanly above the channel and is sitting slightly above the horizontal resistance (1.1710).
A retest and bullish candle confirmation would be ideal — don't rush in yet, let the market prove its intent.
🧠 Strategic Entry Zone (My Plan)
EP: 1.1710–1.1720 (after bullish retest candle)
SL: 1.1650 (just below demand and structure low)
TP: 1.1840 zone (clean R:R ≈ 1:2)
⚠️ Risk Watch
DXY inverse correlation should support this (if DXY is breaking lower, that adds confidence).
Make sure there's no high-impact news within next 4–6 hours (like US CPI, FOMC).
Session timing is favorable — NY open approaching, which brings momentum.
✅ Verdict
High-probability long setup (TCB Score: 8/10).
Wait for a bullish retest candle on the 1H or even 15M before entry. If that happens, the probability of hitting 1.1840 is strong — particularly if volume confirms.

EUR/USD - Potential TargetsDear Friends in Trading,
How I see it,
PIVOT AREA @ 1.16630 - 1.17160
1) Rangebound at this time between support and resistance.
2) We need a strong breach above or below PIVOT area.
Keynote:
1.16420 - 1.16300 = 50% retracement area from
23rd of June on 1D Time Frame Correction path.
I sincerely hope my point of view offers a valued insight.
Thank you for taking the time to study my analysis.
