EURUSD Massive Long! BUY!
My dear friends,
Please, find my technical outlook for EURUSD below:
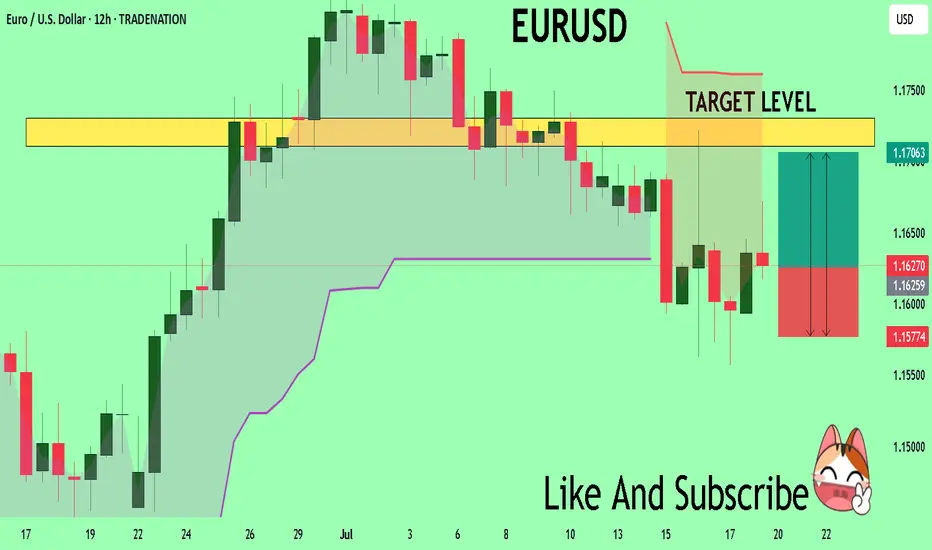
The price is coiling around a solid key level - 1.1627
Bias - Bullish
Technical Indicators: Pivot Points Low anticipates a potential price reversal.
Super trend shows a clear buy, giving a perfect indicators' convergence.
Goal - 1.1710
Safe Stop Loss - 1.1577
About Used Indicators:
The pivot point itself is simply the average of the high, low and closing prices from the previous trading day.
Disclosure: I am part of Trade Nation's Influencer program and receive a monthly fee for using their TradingView charts in my analysis.
———————————
WISH YOU ALL LUCK
EURUSD trade ideas
EURUSD is Nearing the Daily Uptrend! Hey Traders, in today's trading session we are monitoring EURUSD for a buying opportunity around 1.15800 zone, EURUSD is trading in an uptrend and currently is in a correction phase in which it is approaching the trend at 1.15800 support and resistance area.
Trade safe, Joe.

EUR/USD | Bullish Momentum Builds – Next Targets Ahead! (READ)By analyzing the EURUSD chart on the 4-hour timeframe, we can see that, as per the previous analysis, the price first made a strong move in two steps, successfully hitting the 1.15580 target. Upon reaching this key level, it reacted positively with increased demand and is now trading around 1.16520. Given the current trend, I expect further bullish movement soon, with the next potential targets at 1.16720, 1.17230, and 1.17500.
Please support me with your likes and comments to motivate me to share more analysis with you and share your opinion about the possible trend of this chart with me !
Best Regards , Arman Shaban

EURUSDHello Traders! 👋
What are your thoughts on EURUSD?
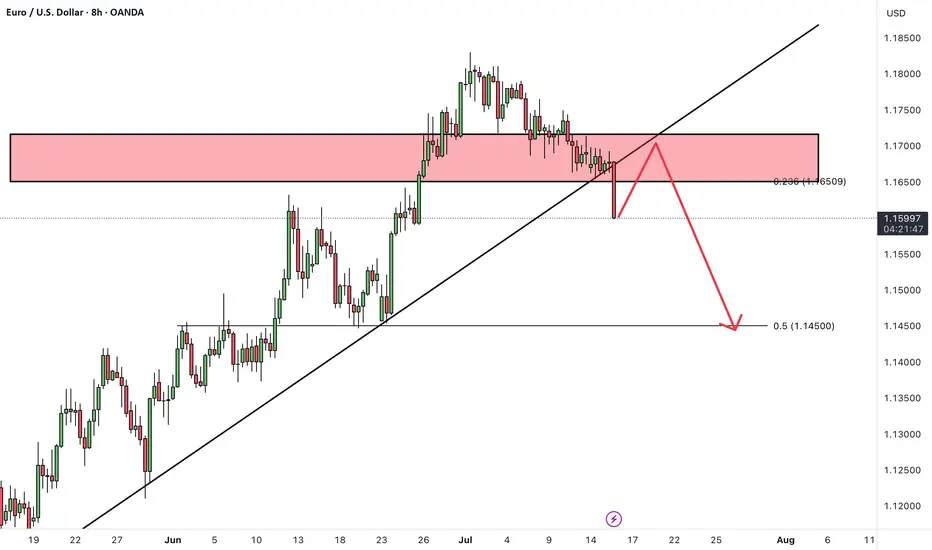
EURUSD has broken support level and its ascending trendline, indicating a possible shift in short-term market structure and growing bearish pressure.
In the short term, we expect a pullback toward the broken support/trendline zone.
If price fails to reclaim this level, a continued move lower toward the next identified support zone is likely.
As long as price remains below the broken structure, the short-term outlook stays bearish.
Don’t forget to like and share your thoughts in the comments! ❤️
EURUSD: The Logic of Institutional Capital UnveiledThe trend is your friend... until it isn't. While EURUSD remains in a clear global uptrend, the short-term picture is far more deceptive. Before you jump into a long position, it's crucial to understand the bearish order flow that has taken control on the 4H chart.
This idea isn't about fighting the trend, but about having the patience to join it at the right, high-probability moment. Let's dive in.
The most liquid forex asset, EURUSD , continues its global uptrend as long as the price does not close decisively below the daily structure's BOS level at 1.14458. On its ascent, the pair met resistance from a monthly supply zone , from which it began a daily structure correction. This correction was paused by a demand zone and the 61.8% Fib level.
While this might seem like a sufficient support point to consider long positions, let's look at the context on the 4H structure to see why I believe the correction will go deeper.
The 4H structure shows a clear bearish order flow that began from the aforementioned monthly supply zone. We see this order flow manifest as the price consecutively rejects from order blocks #1 and #2 ( they have fulfilled their role and should no longer be considered — any manipulation zone becomes deactivated after its first mitigation ). It would have seemed logical for the price to then reject from OB #3 , where I was personally expecting a counter-trend short trade upon its mitigation, especially after the 4H structure had broken down (BOS 4H).
However, the price doesn't always behave as we expect ; it dropped to the demand zone, leaving behind a 4H FVG. This left OB #3 still technically valid. But the sharp squeeze on July 16th reached the 4H FVG, rebalancing it and thus invalidating OB #3 as a Point of Interest (POI) for large capital. This is because the price was already delivered close to it, and with a high probability, the "Whale" closed its losing hedged long positions there, having no reason to return the price. The sharp upward squeeze on July 16th also served to sweep liquidity from the high marked with an 'x'.
These two factors — the FVG mitigation and the liquidity sweep — confirmed the continuation of the bearish order flow and indicated that the price is likely to continue its corrective move towards the next support levels. Let's examine them in more detail.
~~~~~~~~~~~~~~~~~~~~~~~~~~~~~~~~~~~~~~~~~~~~~~~~~~~~~~~~~~~~~~~~~
Two Potential Long Scenarios
SCENARIO 1: Entry from the Daily Order Block
The first level for a potential reversal is the 78.6% Fibonacci retracement level from the daily structure, in conjunction with a daily order block .
► Setup Condition: Price must reach this level, mitigate the order block, and hold above the 78.6% Fib level. An entry will require LTF confirmation (a BOS or the beginning of LTF order flow).
► Invalidation: A break of the 78.6% level with the price closing below it.
Note: I consider the scenario of breaking this level quite probable due to the weakness of this daily order block — it did not sweep any liquidity when it was formed. Thus, it may itself act as liquidity, activating the second long scenario.
SCENARIO 2: Entry after a Deeper Liquidity Sweep
This scenario becomes valid if the first one fails.
► Setup Condition: A liquidity sweep below the daily structure's break level (BOS D) , which simultaneously corresponds to reaching the 50% Fib level from the weekly structure . This confluence strongly reinforces the setup if this level (at 1.14480) holds. Since this is a weekly level, it must not be broken by the bodies of daily candles closing below it.
► Invalidation: A daily candle close below this level. In that case, we can confidently assume that the uptrend is changing and start looking for short positions.
~~~~~~~~~~~~~~~~~~~~~~~~~~~~~~~~~~~~~~~~~~~~~~~~~~~~~~~~~~~~~~~~~
The principles and conditions for forming the manipulation zones I show in this trade idea are detailed in my educational publication, which was chosen by TradingView for the "Editor's Picks" category and received a huge amount of positive feedback from this wonderful, advanced TV community. To better understand the logic I've used here and the general principles of price movement in most markets from the perspective of institutional capital, I highly recommend checking out this guide if you haven't already. 👇
P.S. This is not a prediction of the exact price direction. It is a description of high-probability setups that become valid only if specific conditions are met when the price reaches the marked POI. If the conditions are not met, the setups are invalid. No setup has a 100% success rate, so if you decide to use this trade idea, always use a stop-loss and proper risk management. Trade smart.
~~~~~~~~~~~~~~~~~~~~~~~~~~~~~~~~~~~~~~~~~~~~~~~~~~~~~~~~~~~~~~~~~
If you found this analysis helpful, support it with a Boost! 🚀
Have a question or your own view on this idea? Share it in the comments. 💬
► Follow me on TradingView to get real-time updates on THIS idea (entry, targets & live trade management) and not to miss my next detailed breakdown.
~~~~~~~~~~~~~~~~~~~~~~~~~~~~~~~~~~~~~~~~~~~~~~~~~~~~~~~~~~~~~~~~~

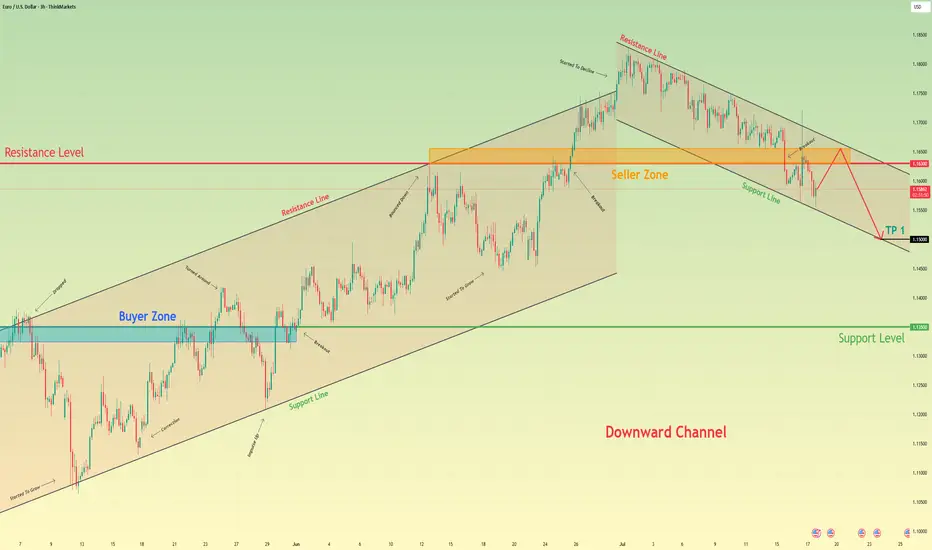
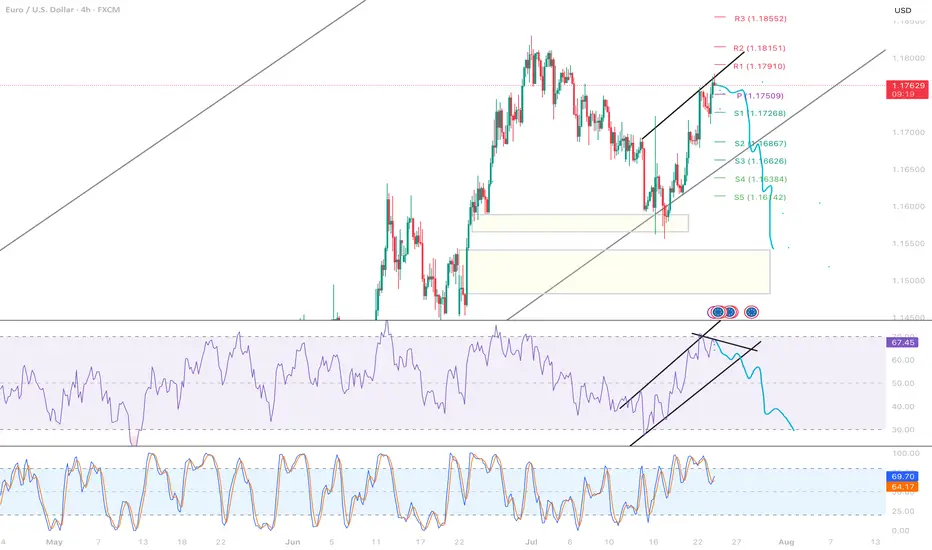
Euro may reach seller zone and then continue to fall in channelHello traders, I want share with you my opinion about Euro. The price pair has recently shifted its market structure, establishing a clear downward channel after breaking its previous uptrend. Before this breakdown, the price was consistently trading within an Upward Channel, repeatedly finding support in the buyer zone (1.1325–1.1350) and reversing upward. The bullish momentum eventually faded when the price failed to break the major horizontal resistance level at 1.1630. This failure triggered a strong bearish impulse, leading to a decisive breakout below the channel's support line and confirming a trend reversal. Currently, the price is making a corrective move up inside the newly formed downward channel, which appears to be a classic retest of the broken structure from below. I expect this upward move to stall as it approaches the heavy confluence of resistance formed by the channel's upper Resistance Line and the horizontal seller zone at 1.1630–1.1655. After testing this area, I anticipate a rejection and the beginning of a new bearish leg down. That's why I've set my TP at the 1.1500 level — it aligns perfectly with the support line of the current downward channel, making it a logical target for sellers. Please share this idea with your friends and click Boost 🚀
Disclaimer: As part of ThinkMarkets’ Influencer Program, I am sponsored to share and publish their charts in my analysis.
EURUSD Is Weaker vs USD. Look For Sells!Welcome back to the Weekly Forex Forecast for the week of July 21-25th.
In this video, we will analyze the following FX market:
EURUSD
Expecting the USD to continue to push higher, which would further drag the EURO down. Look to take advantage of this dynamic and wait for sell setups!
Enjoy!
May profits be upon you.
Leave any questions or comments in the comment section.
I appreciate any feedback from my viewers!
Like and/or subscribe if you want more accurate analysis.
Thank you so much!
Disclaimer:
I do not provide personal investment advice and I am not a qualified licensed investment advisor.
All information found here, including any ideas, opinions, views, predictions, forecasts, commentaries, suggestions, expressed or implied herein, are for informational, entertainment or educational purposes only and should not be construed as personal investment advice. While the information provided is believed to be accurate, it may include errors or inaccuracies.
I will not and cannot be held liable for any actions you take as a result of anything you read here.
Conduct your own due diligence, or consult a licensed financial advisor or broker before making any and all investment decisions. Any investments, trades, speculations, or decisions made on the basis of any information found on this channel, expressed or implied herein, are committed at your own risk, financial or otherwise.

EURUSD Buy Trade Idea: Reversal Rocket Ready to Launch!Hey Fellow Traders! 👋
The EURUSD (EU) is setting up for a massive reversal that’s got me hyped! 🚀 After nailing the lows of that descending channel like a pro, price has retraced to our expected zone and is now bouncing hard. It’s time to gear up for a potential buy trade targeting the Buyside Liquidity! Let’s break down this fire setup and get ready to ride the wave! 🌊
📈 The Setup: Reversal in the Making!
EU hit the descending channel lows as predicted, and now it’s showing some serious bullish vibes with a strong bounce off a key weekly trendline support. This isn’t just a random move—price is reacting to a weekly demand zone and a trendline that’s holding like a fortress. 🏰 I’m expecting a reversal to kick in, aiming for that juicy Buyside Liquidity up top. But hold up—don’t just dive in blindly! Let’s talk strategy. 😎
🎯 Trade Details: How to Play It Smart
Entry Zone: Look for a calculated entry in this bounce area. Key setups to watch for:
FVG (Fair Value Gap) or IFVG (Imbalance Fair Value Gap) for precision entries.
Order Blocks (OB) for high-probability setups.
Trendlines/Support Zones: Use these for confluence, as EU is respecting that weekly trendline support.
Target: We’re gunning for the Buyside Liquidity—a high-probability target where price loves to gravitate.
Stop Loss: Place your stops below the recent lows or your chosen setup (FVG/OB) to keep risk tight.
👀 Keep an Eye on DXY for Confluence
The Dollar Index (DXY) is a key player here. A weakening DXY could supercharge this EU reversal, so monitor it closely for extra confirmation. If DXY starts to roll over, it’s like pouring rocket fuel on this trade! 🚀
🧠 Why This Reversal Makes Sense
Weekly Trendline Support: Price kissed this level and is bouncing like it means business.
Weekly Demand Zone: This area has historical strength, making it a prime reversal spot.
Channel Lows Conquered: EU smashed through the descending channel lows and is now retracing for the next leg up.
⚠️ Risk Management Reminder
Don’t YOLO this one! Use proper risk management—calculate your position size, set tight stops, and only enter when your setup aligns. Whether you’re using FVGs, OBs, trendlines, or classic support/resistance, make sure your entry is calculated to avoid getting caught in a fakeout. 💪
💬 Let’s Talk Trades!
What’s your take on this EU reversal? Are you jumping in with an FVG, OB, or something else? Drop your thoughts, setups, or questions in the comments below! 👇 If this idea gets you pumped, smash that LIKE button ❤️, follow for more banger trade ideas, and share your charts with the community! Let’s keep the vibes high and the profits higher! 💰
#EURUSD #ForexTrading #BuyTrade #Reversal #TradingView

EURUSD 2nd Sell EntryEntry: 1.16403
Stop Loss (R): 1.16720
Take Profit (4R): 1.15135
*Disclaimer: I will not accept liability for any loss or damage, including without limitation to any loss of profit, which may arise directly or indirectly from use of or reliance on such information.

EURUSD is Nearing an Important Support!!Hey Traders, in today's trading session we are monitoring EURUSD for a buying opportunity around 1.15400 zone, EURUSD is trading in an uptrend and currently is in a correction phase is in a correction phase in which it is approaching the trend at 1.15400 support and resistance area.
Trade safe, Joe.

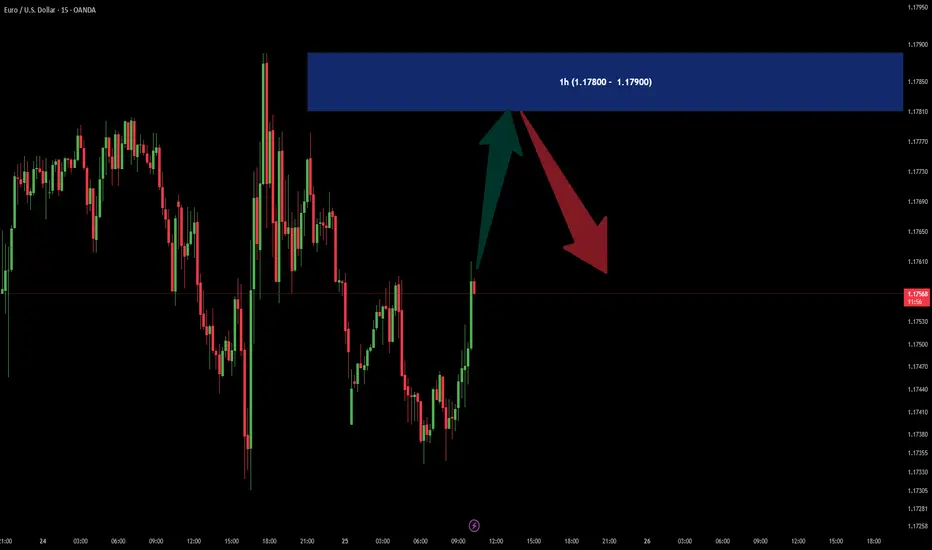
EURUSD SELL OFFERIn 1h time frame there is a SUPPLY area in (1.17800 - 1.17900) price zone.
It could be good for a SELL scalpers.
Bullish Flag Formation Signals Potential Uptrend on EUR/USDThis chart shows a clear bullish flag pattern on the EUR/USD 3-hour timeframe. After a strong impulsive move upward, the price is consolidating within a downward-sloping channel, characteristic of a flag formation. The Ichimoku Cloud supports the consolidation zone, with price currently testing the lower boundary of the flag. A breakout above the upper trendline would confirm continuation of the bullish trend. The chart indicates a strong potential for an upward breakout following the flag’s structure, in line with the prevailing bullish momentum. This setup favours bulls, anticipating continuation of the uptrend once resistance is cleared.
Entry Buy : 16400
First Target: 1.17500
Second Target : 1.18100
If you found this analysis helpful, don’t forget to drop a like and comment. Your support keeps quality ideas flowing—let’s grow and win together! 💪📈

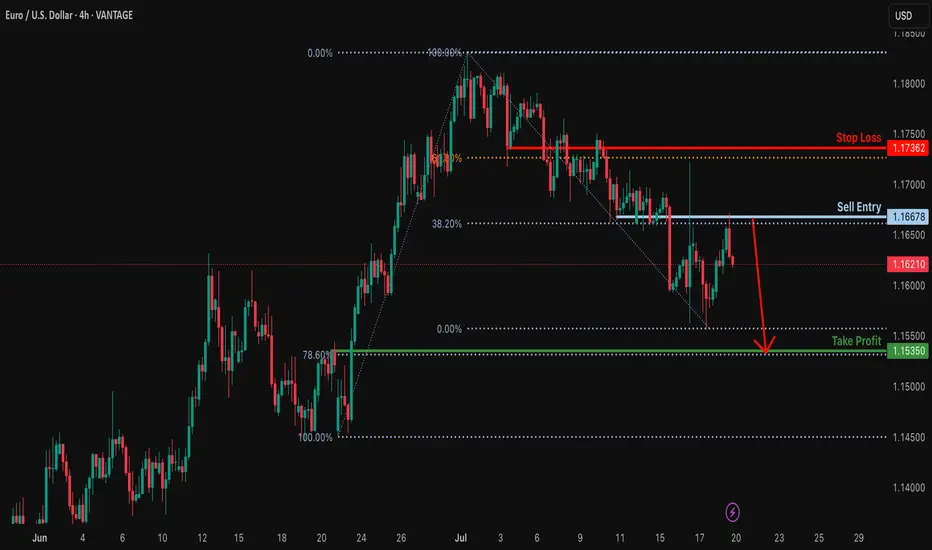
Bearish drop?EUR/USD has rejected off the resistance level which is a pullback resistance that lines up with the 38.2% Fibonacci retracement and could drop from this level to our tale profit.
Entry: 1.1667
Why we like it:
There is a pullback resistance that aligns with the 38.2% Fibonacci retracement.
Stop loss: 1.1736
Why we like it:
There is an overlap resistance that aligns with the 61.8% Fibonacci retracement.
Take profit: 1.1535
Why we like it:
There is a pullback support that lines up with the 78.6% Fibonacci retracement.
Enjoying your TradingView experience? Review us!
Please be advised that the information presented on TradingView is provided to Vantage (‘Vantage Global Limited’, ‘we’) by a third-party provider (‘Everest Fortune Group’). Please be reminded that you are solely responsible for the trading decisions on your account. There is a very high degree of risk involved in trading. Any information and/or content is intended entirely for research, educational and informational purposes only and does not constitute investment or consultation advice or investment strategy. The information is not tailored to the investment needs of any specific person and therefore does not involve a consideration of any of the investment objectives, financial situation or needs of any viewer that may receive it. Kindly also note that past performance is not a reliable indicator of future results. Actual results may differ materially from those anticipated in forward-looking or past performance statements. We assume no liability as to the accuracy or completeness of any of the information and/or content provided herein and the Company cannot be held responsible for any omission, mistake nor for any loss or damage including without limitation to any loss of profit which may arise from reliance on any information supplied by Everest Fortune Group.
EUR/USD | Correction Near Key Demand – Watching for Rebound!By analyzing the EURUSD chart on the 4-hour timeframe, we can see that after the last analysis, the price started a correction and is currently trading around 1.17150. I expect that once it enters the 1.16780–1.17100 zone, we could see a rebound from this key demand area. If the price holds above this zone, the next bullish targets will be 1.17370 as the first target and 1.17730 as the second.
Please support me with your likes and comments to motivate me to share more analysis with you and share your opinion about the possible trend of this chart with me !
Best Regards , Arman Shaban

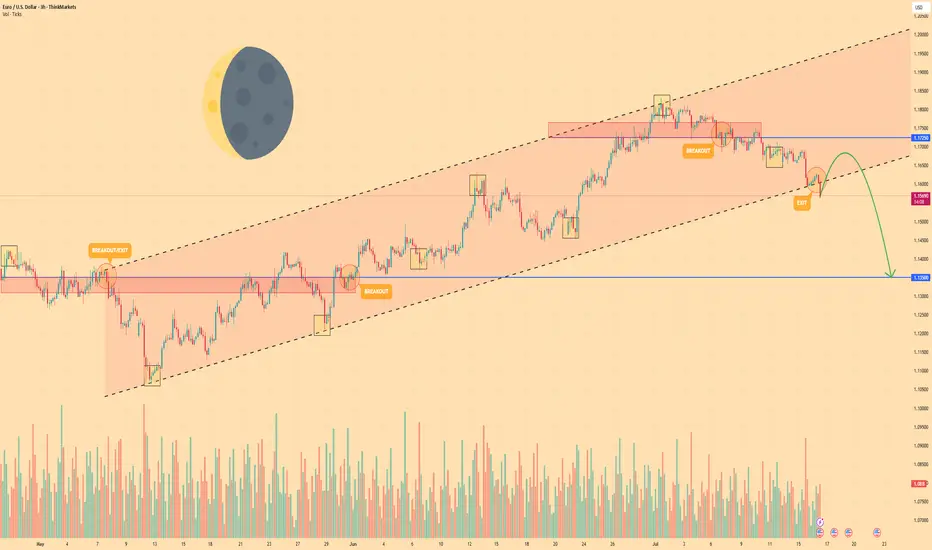
EURO - Price may drop to $1.1350 support level Hi guys, this is my overview for EURUSD, feel free to check it and write your feedback in comments👊
Euro began its journey by breaking into a rising channel off the swing low near $1.1080, establishing a clear uptrend.
Within this channel, price carved out steady support along the lower trendline, touching $1.1350 before buyers stepped.
Mid-channel, two breakout attempts at $1.1550 and $1.1725 highlighted bullish conviction, yet both retreated back below resistance.
Simultaneously, two exit signals appeared near the upper trendline around $1.1765, showing that upward momentum was losing steam at key inflection points.
Currently, EUR is holding just below the channel base after a minor bounce, consolidating as traders weigh the next move.
I foresee a brief climb toward near $1.1670 before a renewed bearish thrust drives price back down to test $1.1350 level.
If this post is useful to you, you can support me with like/boost and advice in comments❤️
Disclaimer: As part of ThinkMarkets’ Influencer Program, I am sponsored to share and publish their charts in my analysis.
EURUSD - Short Term Setup Could Trigger MAJOR ReversalThis bounce is likely to be a connective wave into another wave down.
In the video I break down a classic algo driven liquidity sweep just above the 0.786 retracement.
This signals potential reversal.
Stop loss placement depends on how aggressive you want to be with margin.
Tighter risk gives more upside potential with defined exposure.
Invalidation of potential retracement failure swing @ $1.18.
If this unfolds on a higher timeframe, it could develop into a heavy-hitting move.
I'm layering shorts through this area, as discussed in the video.
Trade executed on Pepperstone CFD 👍.
This analysis is shared for educational purposes only and does not constitute financial advice. Please conduct your own research before making any trading decisions.

EURUSD: Short Trade Explained
EURUSD
- Classic bearish setup
- Our team expects bearish continuation
SUGGESTED TRADE:
Swing Trade
Short EURUSD
Entry Point - 1.1727
Stop Loss - 1.1759
Take Profit - 1.1661
Our Risk - 1%
Start protection of your profits from lower levels
Disclosure: I am part of Trade Nation's Influencer program and receive a monthly fee for using their TradingView charts in my analysis.
❤️ Please, support our work with like & comment! ❤️

EUR/USD - Daily Chart (Wedge Breakout) (16.07.2025) The EUR/USD Pair on the D1 timeframe presents a Potential Selling Opportunity due to a recent Formation of a Wedge Pattern. This suggests a shift in momentum towards the downside in the coming Days.
Possible Short Trade:
Entry: Consider Entering A Short Position around Trendline Of The Pattern.
Target Levels:
1st Support – 1.0956
2nd Support – 1.0625
💡 Fundamental & Sentiment Context
Euro under pressure amid renewed concerns over EU‑US trade friction .
The USD is strengthening, supported by safe‑haven flows amid tariff uncertainties.
🎁 Please hit the like button and
🎁 Leave a comment to support for My Post !
Your likes and comments are incredibly motivating and will encourage me to share more analysis with you.
Best Regards, KABHI_TA_TRADING
Thank you.
Disclosure: I am part of Trade Nation's Influencer program and receive a monthly fee for using their TradingView charts in my analysis.

EURUSD buyThe eurusd looks set for upward move , its in a huge uptrend on the daily chart so this pullback down looks perfect for a return to the highs, now back to the 2 hr chart and we can see we have clearly bounced off a dynamic support zone not once but twice and formed a double bottom then for the first time since July 4th we have broken up throughout the 50 day moving average breaking the structure and returning back , I can now see a move upwards from here.

Short terme bearish eurusdafter an accumulation in the london session. At NW opening, there were a manipulation to take a buy side liquidity, atfer that we expect EUR/USD to be at short time bearish to 1.16660.
So : TP = 1.16660 , SL = 1.1709

EURUSDCOT data shows increasing net long positions on the euro, signaling bullish sentiment from institutional traders. This shift suggests growing confidence in the EUR against the USD.

EURUSD SHORT. DXY UP. Possible scenario for short term for EURUSD, Short on place for possible target 1.1540 and we might have a bounce from there ,a whole week green for DXY before any downfall
EURUSD: Target Is Up! Long!
My dear friends,
Today we will analyse EURUSD together☺️
The recent price action suggests a shift in mid-term momentum. A break above the current local range around 1.16915 will confirm the new direction upwards with the target being the next key level of 1.17187 and a reconvened placement of a stop-loss beyond the range.
❤️Sending you lots of Love and Hugs❤️
