EURUSD POTENTIAL BUY SETUP 4HLooking at EURUSD, Price is moving in a descending channel. EU on the high timeframe is bullish as Dollar is weak. I am expecting EU to fall into the marked FVG to clear the lows and take internal liquidity from the marked FVG before moving higher and take the Buyside Liquidity as marked.
Potential Entry= 1.6350
Stop loss= 1.15650
Take Profit = 1.18250
Please wait for price to come into the marked potential area to take this trade and manage your risk accordingly. Follow me for more updates and trades.
EURUSD trade ideas


My Take on the EURUSD H1 Setup (July 14, 2025)
This is a classic textbook-quality TCB setup forming right at a critical confluence zone. Here's a full breakdown from a trader's lens:
🔵 1. Trend
Bias: Bullish
The macro structure from June shows a strong uptrend, and the most recent impulse was explosive — indicating active buyers.
H4 and D1 show no trend break yet.
🔵 2. Countertrend
The descending channel is neat and controlled — no erratic spikes or liquidity wicks that signal confusion.
Compression into the demand zone (gray box) around 1.1652–1.1710 shows sellers are weakening.
This is typical of pre-breakout structure when buyers are loading up under the radar.
🔵 3. Breakout
Price just broke cleanly above the channel and is sitting slightly above the horizontal resistance (1.1710).
A retest and bullish candle confirmation would be ideal — don't rush in yet, let the market prove its intent.
🧠 Strategic Entry Zone (My Plan)
EP: 1.1710–1.1720 (after bullish retest candle)
SL: 1.1650 (just below demand and structure low)
TP: 1.1840 zone (clean R:R ≈ 1:2)
⚠️ Risk Watch
DXY inverse correlation should support this (if DXY is breaking lower, that adds confidence).
Make sure there's no high-impact news within next 4–6 hours (like US CPI, FOMC).
Session timing is favorable — NY open approaching, which brings momentum.
✅ Verdict
High-probability long setup (TCB Score: 8/10).
Wait for a bullish retest candle on the 1H or even 15M before entry. If that happens, the probability of hitting 1.1840 is strong — particularly if volume confirms.

EURUSD Will Go Down From Resistance! Short!
Here is our detailed technical review for EURUSD.
Time Frame: 2h
Current Trend: Bearish
Sentiment: Overbought (based on 7-period RSI)
Forecast: Bearish
The market is trading around a solid horizontal structure 1.177.
The above observations make me that the market will inevitably achieve 1.172 level.
P.S
We determine oversold/overbought condition with RSI indicator.
When it drops below 30 - the market is considered to be oversold.
When it bounces above 70 - the market is considered to be overbought.
Disclosure: I am part of Trade Nation's Influencer program and receive a monthly fee for using their TradingView charts in my analysis.
Like and subscribe and comment my ideas if you enjoy them!

Fundamental Market Analysis for July 14, 2025 EURUSDThe euro remains under pressure: on Monday the pair slipped to 1.16750 after the European Commission extended its pause on retaliatory tariffs against the United States until 1 August. With no resolution in sight, the trade dispute keeps European exporters on edge and turns the dollar into a safe-haven choice for investors looking to limit risk.
Additional support for the greenback comes from rising real yields. The 10-year U.S. Treasury rate is holding above 4.40 %, locking in a wide spread over German Bunds. That has led futures traders to price in just one 25 bp Federal Reserve rate cut for the rest of the year, reducing the euro’s relative appeal.
Macro data from the euro area offer little relief. German industrial production rose only 0.2 % m/m in May, while the July ZEW expectations index slid back into negative territory. With the ECB having already delivered a June cut and projecting lower inflation ahead, inward capital flows to the eurozone remain subdued.
Trading recommendation: SELL 1.16750, SL 1.17050, TP 1.16200

EURUSD InsightHello to all our subscribers.
Please share your personal thoughts in the comments. Don't forget to like and subscribe!
Key Points
- Attacks on Fed Chair Jerome Powell are intensifying, mainly from President Trump and his close aides. Analysts say the tension between the White House and the Federal Reserve has reached a serious level.
- President Trump announced on Truth Social that starting next month, a 30% reciprocal tariff will be imposed on both the EU and Mexico.
- Canada added 83,100 jobs in June compared to the previous month, in line with market expectations. The unemployment rate came in at 6.9%, slightly below the forecast of 6.9%. The strong labor market data likely reduced the chances of a rate cut by the Bank of Canada in July.
This Week’s Key Economic Events
+ July 15: U.S. June Consumer Price Index (CPI)
+ July 16: U.K. June Consumer Price Index, U.S. June Producer Price Index (PPI)
+ July 17: Eurozone June Consumer Price Index
EURUSD Chart Analysis
The price has broken below the trend channel and is now forming under the 1.17000 level. The downside appears more likely than an upward move. The expected support level is around 1.15000. Whether the price bounces from this area or breaks further downward will likely determine the future direction.

EURUSD buy zoneEURUSD is holding around levels just below 1,1700.
Tomorrow, U.S. inflation data is expected, which could trigger bigger moves.
The key zone to watch for a reaction is between 1,1591 and 1,1682.
Look for a bounce and potential buying opportunities in that area.
Next resistance levels to keep in mind are 1,1813 and 1,1916!

ETHEREUM - ETH Weekly Recap & Projection 13.07.2025Current Structure
Ethereum is showing a clear bullish bias.
Last week’s price action broke above a significant weekly swing level with solid candle closures — suggesting continuation.
Short-Term Scenarios
We could see two potential outcomes:
• A consolidation range forming at current levels
• A short-term retracement influenced by Bitcoin’s movement
Due to ETH’s high correlation with BTC, traders should review Bitcoin’s chart to understand ETH’s likely path.
Trading Plan
Wait for Bitcoin to complete a retracement
Monitor ETH for LTF (lower timeframe) confirmation and bounce
Seek long setups below the CME Gap (pink line)
Step 2 will serve as the trigger to initiate any positions on ETH.
Macro Risk-On Catalyst – Powell Resignation?
There are growing rumors regarding Federal Reserve Chairman Jerome Powell potentially resigning.
If confirmed, this could result in a strong rally across risk assets, including ETH — likely pushing prices higher without traditional pullbacks.
Summary
• ETH broke major weekly structure
• Watch BTC for clues — correlation remains high
• Plan favors long entries after BTC retrace + ETH LTF confirmation
• Powell resignation rumors could accelerate bullish trend

EUR-USD Will Keep Growing! Buy!
Hello,Traders!
EUR-USD keep trading in
An uptrend along the rising support
So as the pair is approaching
A the support we will be
Expecting a bullish rebound
And a move up on Monday
Buy!
Comment and subscribe to help us grow!
Check out other forecasts below too!
Disclosure: I am part of Trade Nation's Influencer program and receive a monthly fee for using their TradingView charts in my analysis.

EUR/USD - Potential TargetsDear Friends in Trading,
How I see it,
PIVOT AREA @ 1.16630 - 1.17160
1) Rangebound at this time between support and resistance.
2) We need a strong breach above or below PIVOT area.
Keynote:
1.16420 - 1.16300 = 50% retracement area from
23rd of June on 1D Time Frame Correction path.
I sincerely hope my point of view offers a valued insight.
Thank you for taking the time to study my analysis.

EURUSDEURUSD still have more correction before the impulse to the upside starts.
Disclosure: We are part of Trade Nation's Influencer program and receive a monthly fee for using their TradingView charts in our analysis.

EUR/USD Bullish Continuation SetupMarket Structure Overview:
The market remains in a clear higher timeframe bullish trend, consistently forming higher highs and higher lows. Recently, price has entered a descending channel, resembling a bull flag formation — a classic continuation pattern that typically precedes a strong bullish breakout.
Key Observations:
✅ Descending Channel (Bull Flag): Price is respecting a downward-sloping channel while remaining above key demand zones.
💧 Liquidity Pools: Multiple liquidity highs have been left untouched above — suggesting fuel for a potential impulsive move upward.
🧹 Liquidity Sweep: On both H4 and H1, we see a clear sweep of previous equal lows, tapping into a significant demand zone.
📈 Reaction from Demand: Strong reaction from the demand zone suggests institutional buying interest.
🔵 Projection: A bullish breakout from the flag could target the liquidity above 1.1800, with immediate resistance near 1.1740–1.1760.
Bias:
🔼 Bullish — as long as price holds above the most recent demand zone (~1.1649), the bias remains bullish with expectations of a breakout and continuation toward previous highs.
Note: We must see how the market opens on Sunday night going into Monday. Based on the initial price action, we can determine the best trading opportunities and direction for the upcoming week.

EURUSDEUUSD bouncing of a nice 4hr trendline for few days already. its time to break from the curse and move in a direction. Could it be bearish or bullish?
if the elliot wave is accurate, seems like to have a correction for the begining of next week. Let us know what you think?

EURUSD Trade idea for 14th - 118th July 2025For next week, I am expecting bullish moves on EURUSD with a target at 1.18297. The trigger for this trade will be a CISD at 1.17071. I expect to cascade this trade with FVGs setups on the 4HR timeframe.

EURUSD - Still Orderflow remains bearishLooking at EU. The 1H Orderflow is still maintaining that bearish intent. My area is set now for where i want to take a potential sell to the downside seeing as everything else is pretty much mitigated.
The only issue with this potential sell of is that we never really had a sweep of liquidity before we rolled over and moved to the downside.
We do have a level of inducement before our POI but i think in an ideal world i would love to see us build up a bit more liquidity before the POI just to induce the early sellers before making that move to the downside.
For now. On the lower TF's i will be looking to take short term long positions back up to our POI before looking for the longer terms short. to our 4H POI in which i will be looking to get long once again.
Any questions feel free to give me a message

EURUSD: Detailed Support & Resistance Analysis 🇪🇺🇺🇸
Here is my latest structure analysis and important
supports and resistances for EURUSD for next week.
Consider these structures for pullback/breakout trading.
❤️Please, support my work with like, thank you!❤️
I am part of Trade Nation's Influencer program and receive a monthly fee for using their TradingView charts in my analysis.

EURUSDEURUSD appears to be running SSL. 4H levels identified. Looking for Break & retest. If support does not hold on to any level, expect the bulls to return and take over.

Potential Sell Opportunity on EURUSDReasons I think this pair will fall:
- Bearish RSI Divergence on Daily chart
-RSI overbought on H4 and Daily
What are your thoughts?


EUR/USD Daily Chart Analysis For Week of July 25, 2025Technical Analysis and Outlook:
During the previous week's trading session, the Euro experienced an increase following the completion of the Inner Currency Dip at the 1.156 level. It subsequently surpassed two significant Mean Resistance levels, namely 1.167 and 1.172; however, it reversed direction by the conclusion of the trading week. Recent analyses indicate that the Euro is likely to undergo a sustained downward trend, with a projected target set at the Mean Support level of 1.169 and a potential further decline to retest the previously completed Currency Dip at 1.156. Nonetheless, it remains essential to consider the possibility of renewed upward momentum towards the Mean Resistance level of 1.177, which could initiate a preeminent rebound and facilitate the completion of the critical Outer Currency Rally at 1.187.

Review on the 1st 3 Elite PairYou can follow us for more Analysis(Images and Videos) with Precise definition of the Financial Market.ENJOY!!!

EU possible buy idea?7 days ago, I shared a bullish idea that remains valid despite price failing to hold above 1.04321.
Current Market Analysis:
Price appears to be forming an Elliot Wave 2 (a-b-c) correction.
Key Levels to Watch:
- 38.2% Fibonacci retracement level (minimum required for Wave 2)
- 88.7% Fibonacci retracement level (maximum allowed for Wave 2 to maintain bullish bias)
Trade Plan:
With my initial position at break-even, I'll employ dollar-cost averaging for additional buys targeting 1.065 :
1. 50% Fibonacci retracement level
2. 61.8% Fibonacci retracement level
3. 78.6% Fibonacci retracement level
Stop Loss: 1.017
This is not a financial advice but if you must take the trade, apply proper risk and money management while scaling into the trade.

Xmoon Indicator Tutorial – Part 1 – Strategy🔻🔻🔻+ Persian version below🔻🔻🔻
📘 Xmoon Indicator Tutorial – Part 1
🎯 3Push Divergence RSI Strategy
🔥 The core of the Xmoon indicator
is built upon one of the most powerful strategies in technical analysis:
The advanced 3Push Divergence RSI pattern
🔁 A pattern that typically appears at key market turning points.
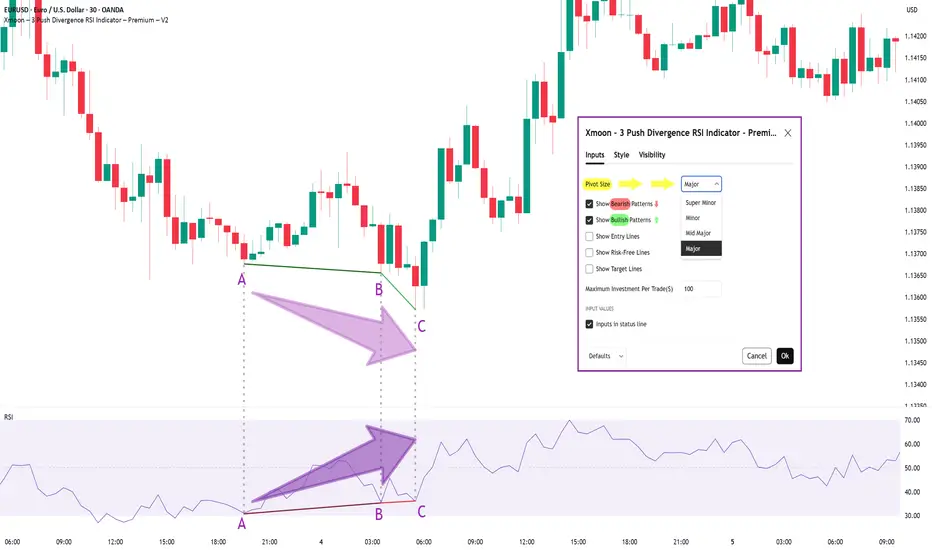
📉 When the price moves in the same direction three consecutive times on pivot points (e.g., making lower lows or higher highs), but the RSI shows the opposite behavior, it indicates a clear divergence !
💡 This divergence can act as a strong signal for a potential trend reversal.
🎯 The Xmoon Indicator is designed to detect this critical moment.
⚙️ Xmoon Indicator Settings Panel
The Xmoon settings panel offers the following options:
🔸 Pattern Type Selection: In the first and second lines, you can specify which type of pattern should be displayed: only bullish patterns or only bearish ones. You can also check both options.
🔸 Pivot Type Selection: From the dropdown menu, you can choose one of four pivot types:
“Super Minor”, “Minor”, “Mid-Major”, and “Major”, ordered from smallest to largest.
📌 Educational Note: The greater the distance (in candle count) between two lows or two highs, the larger the pivot is considered.
A Major Pivot is the largest among them.
✅ Larger Pivot = Higher Accuracy
❗ But naturally = Fewer Signals
📣 If you have any questions or need guidance, feel free to ask us. We’d be happy to help.
🔻🔻🔻بخش فارسی – Persian Section 🔻🔻🔻
📘 آموزش اندیکاتور ایکسمون - قسمت اول
🎯 استراتژی سهپوش واگرایی (3Push Divergence RSI)
🔥 هسته اصلی ایکسمون
بر پایه یکی از قویترین استراتژیهای تحلیل تکنیکال طراحی شده است
الگوی پیشرفته سهپوش واگرایی
🔁 الگویی که معمولاً در نقاط چرخش مهم بازار ظاهر میشود
📉 وقتی قیمت سه بار پشت سر هم روی نقاط پیوت ، در یک جهت حرکت میکند (مثلاً کفهای پایینتر یا سقفهای بالاتر میسازد) ، اما آر-اِس-آی خلاف آن را نشان میدهد، یعنی یک واگرایی آشکار رخ داده است
💡این واگرایی میتواند سیگنالی قوی برای برگشت روند باشد
🎯 اندیکاتور ایکسمون این لحظه را شناسایی میکند
⚙️ پنجره تنظیمات اندیکاتور ایکسمون
در بخش تنظیمات اندیکاتور ایکسمون، امکاناتی در اختیار شما قرار دارند
🔸 انتخاب نوع الگو: در خط اول و دوم میتوانید مشخص کنید چه نوع الگویی نمایش داده شود
فقط الگوهای صعودی یا فقط نزولی. همچنین می توانید تیک هر دو گزینه را بزنید
🔸 انتخاب نوع پیوتها: از پنجره کشویی بالا، می توانید یکی از ۴ نوع پیوت را انتخاب کنید
پیوت ها به ترتیب از کوچک به بزرگ عبارتند از: سوپر مینور ، مینور ، میدماژور و ماژور
📌 نکته آموزشی: هرچه فاصله بین دو کف یا دو سقف بیشتر باشد (یعنی تعداد کندلهای بین آنها زیادتر باشد)، آن پیوت، بزرگتر محسوب میشود
پیوت ماژور از بقیه بزرگ تر است
✅ پیوت بزرگتر = دقت بالاتر
❗ اما طبیعتاً = تعداد سیگنال کمتر
📣 اگر سوالی دارید یا نیاز به راهنمایی دارید، خوشحال میشویم از ما بپرسید
با کمال میل در خدمتتان هستیم