EURUSD ALCISTA?GOOG MORNING. GIVIN CONFIRMATION IN h1 To search for entries in m15
It is not an investment recommendation, it is an analysis from my perspective.
EURUSD trade ideas

Long 30M EURUSDThis is what I see from 30min chart
It will need to go back to the top once again before heading down
Day Trend is still bearish
RSI of week chart is still at overbought region
Goodluck

eurusdEur Usd is moving towrds 4hr supply zone once it tap lokk for 15 min smt then go for short trade

EURUSD_LongStrong bullish break of structure which is fresh and unmitigated, waiting for a pullback for possible long entries

EURUSD Pullback Could Present A Buying Opportunity📊 I’m analyzing EURUSD and have observed a recent bullish break of structure on the daily chart 📈. My bias remains to the upside, but with price now stretched after its latest push, I’m watching for a pullback into important value zones. A confirmed bullish break of market structure from these areas could set up a strong long opportunity 🔍💡🚀 (not financial advice).

Continue the trend !This is the most beautiful, clearest setup. Wait for confirmation - big possibility for a continuation to the upside.
First target 1.17625-50. SAFE TRADING!

Fundamental Market Analysis for August 13, 2025 EURUSDThe euro/dollar pair is holding near recent levels but remains under pressure from U.S. expectations: market participants are pricing in the risk of a more hawkish Federal Reserve tone if inflation and consumer activity do not show a sustained slowdown. Against this backdrop, capital inflows into dollar-denominated assets continue, and demand for protection via USD remains moderate.
In the Eurozone, the picture is more restrained: corporate and consumer confidence has only partially recovered, fiscal space is limited, and the ECB maintains a cautious tone after its recent decisions. Growth forecasts for the year ahead remain low, which dampens appetite for the euro during periods of increased global uncertainty.
Yield differentials and central bank balance sheet policies are creating a fundamental bias in favor of the dollar in the short term. Without strong positive surprises from the Eurozone, the pair retains potential for a moderate decline toward 1.16500.
Trading recommendation: SELL 1.16850, SL 1.17000, TP 1.16500

Done!Obviously, this pair is about to breakout to the upside. High tight flag on the backend of a cup with handle, after confirmation news. Perfect setup. All news confirms! Also, I’m not a day trader!!!! I swing for real money, as a trader for a hedge fund, changing when dailies confirm.

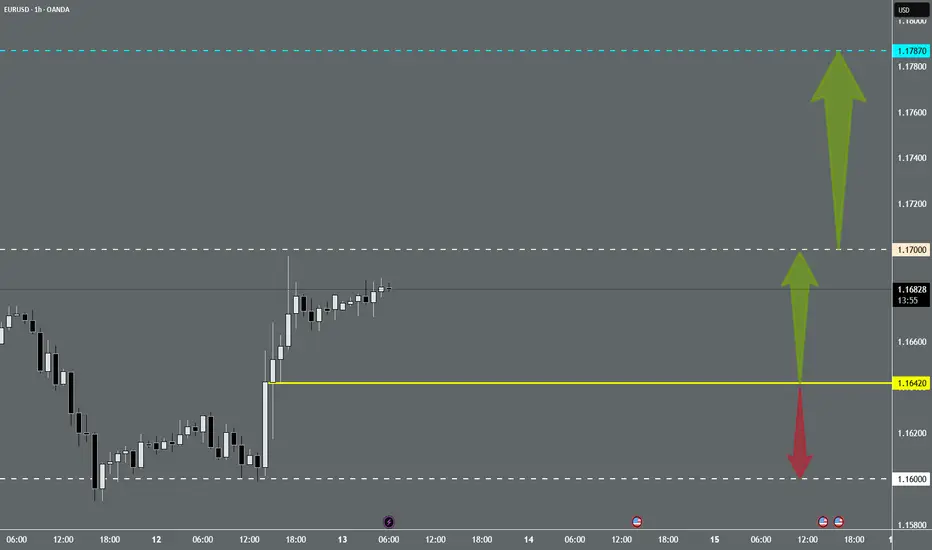
EUR/USD - Potential TargetsDear Friends in Trading,
How I see it,
** I apologies for all the changes. It's 4 my eyes. I will settle on a standard soon.
Keynote:
We need price to hold above key support @ 1.16420
You can also use a 100 SMA or EMA.
Price needs to stay above it (1HR TF) to breach 1.17000 decisively.
Sellers will defend this psychological level.
I sincerely hope my point of view offers a valued insight
Thank you for taking the time study my analysis.
DXY & Fiber. Daily Outlook. CPI AugustFX:EURUSD
ICEUS:DX1!
Expecting massive displacement on Dollar Index. Changing my stance completely based on the CPI day and the closure on the daily timeframe

"EUR/USD Rejection Blocks & Trendline Confluence"Price respected a bearish trendline multiple times before tapping into 4H Key level. The confluence created a high-probability reversal zone, leading to a clean breakout.
Understanding how to combine ARX Rejection Blocks with structure is key for precise entries more free educational content is linked in my profile.

EURUSD - market structureEURUSD - market structure , SERA , use risk and trade managment for better result


EURUSd buy bias
Current Price: ~1.16284
Main Structure:
Left side shows a completed Wave 3 and the market in Wave 4 correction.
Two potential scenarios for Wave 5 (final bullish push) are drawn:
Red Path: Immediate breakout toward Wave 5 target.
Blue Path: Deeper pullback into the marked demand zone before rallying into Wave 5.
Demand Zone (Wave 4 target area): Around 1.15367 – 1.16000, expected to act as support.
Target for Wave 5: ~1.17050 – 1.17066 (resistance zone).
Right Side: A bigger picture projection shows another full Elliott cycle after this smaller Wave 5, with a fresh impulse wave starting mid-month and aiming for higher highs.
This setup suggests you are preparing for a bullish continuation after the correction, with a focus on catching Wave 5 for both short-term and medium-term gains.

EURUSD Bullish Flag continuation support at 1.1544EURUSD Bullish Flag continuation support at 1.1544
The EURUSD remains in a bullish trend, with recent price action showing signs of a corrective pullback within the broader uptrend.
Support Zone: 1.1544 – a key level from previous consolidation. Price is currently testing or approaching this level.
A bullish rebound from 1.1544 would confirm ongoing upside momentum, with potential targets at:
1.1714 – initial resistance
1.1795 – psychological and structural level
1.1890 – extended resistance on the longer-term chart
Bearish Scenario:
A confirmed break and daily close below 1.1544 would weaken the bullish outlook and suggest deeper downside risk toward:
1.1500 – minor support
1.1450 – stronger support and potential demand zone
Outlook:
Bullish bias remains intact while the EURUSD holds above 1.1544 A sustained break below this level could shift momentum to the downside in the short term.
This communication is for informational purposes only and should not be viewed as any form of recommendation as to a particular course of action or as investment advice. It is not intended as an offer or solicitation for the purchase or sale of any financial instrument or as an official confirmation of any transaction. Opinions, estimates and assumptions expressed herein are made as of the date of this communication and are subject to change without notice. This communication has been prepared based upon information, including market prices, data and other information, believed to be reliable; however, Trade Nation does not warrant its completeness or accuracy. All market prices and market data contained in or attached to this communication are indicative and subject to change without notice.

The Day Ahead - Main focus US CPI Tuesday, 12 August – Key events
Data:
US: July CPI (main focus), NFIB small business optimism, federal budget balance, jobless claims change.
UK: June average weekly earnings, unemployment rate.
Japan: July M2, M3.
Germany/Eurozone: August ZEW surveys, Germany June current account.
Canada: June building permits.
Central banks:
Fed’s Barkin speaks.
RBA: Cut cash rate by 25 bps to 3.60%.
Earnings:
CoreWeave – after market.
Circle Internet Group – before market.
On Holding – before market.
CAVA – after market.
Main watchpoints:
US CPI will drive USD, bonds, and Fed rate-cut expectations.
RBA cut highlights policy divergence.
Earnings may move AI/cloud, crypto/payments, and consumer stocks.
This communication is for informational purposes only and should not be viewed as any form of recommendation as to a particular course of action or as investment advice. It is not intended as an offer or solicitation for the purchase or sale of any financial instrument or as an official confirmation of any transaction. Opinions, estimates and assumptions expressed herein are made as of the date of this communication and are subject to change without notice. This communication has been prepared based upon information, including market prices, data and other information, believed to be reliable; however, Trade Nation does not warrant its completeness or accuracy. All market prices and market data contained in or attached to this communication are indicative and subject to change without notice.

Eurusd in rangeEurusd in range- corrective pattern
Expect Oscilation between lines....
Beware the brake of them!

EUR/USD – Possible Pullback SetupWe’re adding this one to the watchlist, but we need the pullback to push a bit deeper into the OTZ.
If that happens, we’ll watch closely to see if the VMS strategy aligns for a potential trade opportunity.
Patience first — execution only if all rules are met.

EURUSD Holds Steady Ahead of CPI DataAfter the payrolls revision shock, EURUSD appears to have stabilized between the 1.1600 and 1.1710 levels. This sideways movement may continue at least until the release of inflation data tomorrow.
The upcoming inflation report is expected to align with forecasts that see Core PCE rising above 3% by the end of this year, with a gradual monthly increase. However, a downside surprise could trigger a rally in stocks, cryptocurrencies, and EURUSD over the next few days.

EUR USD SHORT RESULT Price is at the major resistance Trendline and zone and has lost momentum to continue upward after failing to hold.
Trade is still running though, will keep watch on where price decides to go next.
_THE_KLASSIC_TRADER_.

EUR USD SHORT RESULT Price was at resistance Trendline and zone after the aggressive pump at the news of the previous week, with conflunce of the demand zone to be filled I opened the short, but price went higher to the channel resistance.
Better Set-ups coming
_THE_KLASSIC_TRADER_.💪

1:2 EURUSD SELLS 40 pips gainThe EUR/USD could drop by 40 pips today toward the 1.16120 level due to a combination of market factors. Weaker-than-expected Eurozone data and stronger U.S. figures—or hawkish Fed comments—could push the dollar higher. Risk-off sentiment may also boost demand for the greenback. From a technical standpoint, price action near resistance combined with a possible break below support aligns with this move. Indicators are currently showing strong downside momentum potential, which could accelerate the fall toward the target.

SHORT EURUSDEntry is brought a bit lower to prevent being trapped in a false breakout. this triangular pattern is a wave 2 correction which should follow a sharp move downwards to fill the FVG-fair value gap on the daily timeframe at least
